Singapore Straits Times Index (STI) has Dark Cloud Cover issues!Technically, this is a classic pullback all set up...
A strong rally to the upside based on vaccine elation
supported by financials and sectors for "going back to Normal"
followed by a Dark Cloud Cover candlestick pattern
that was confirmed with a Gap Down.
It is just above a range support, but breaking into the next Gap Down range (below the red line) would be very bearish.
MACD is showing a bearish cross down
Similarly the Relative Price Strength has crossed down
What this means is that to keep up with the bullish rally, there needs to be a much greater upward push...
which is less probable than the easier downside retracement.
Still, this downside may be quick, shallow and a set up for the bigger picture in 2021...
STI trade ideas

STI 301120 : WILL SANTA CLAUS DELIVER 3108?The STI continues its uptrend in both the ST/MT to 3108.
Support is at 2839.
A break of 2839 will test 2767 then 2671.
LT outlook is still downtrend with 3108 as the pivot point.

STI closes at 2813 looking for 3108The STI closed exactly at 2813 on the Kijun line of the monthly charts as discussed in last week's post. The next target remains unchanged at 3108 on the montly Supertrend line.
Short term support at 2779.
A break of 2742 (Supertrend Pivot) will test 2651.

STI Bulls targets 2813 with an eye on 3108The STI continues its uptrend in the ST with the buy signal at 2494 since 031120 on the 4hr.
The monthly supertrend line at 3108 will be the target of the bulls into the year end.
Support is now at 2665.
A break below 2624 will resume its ST downtrend.

STI TARGETS 2813, ST/MT UPTRENDSTI has flashed a MT buy signal on the weekly chart with a target of 2813.
Support now at 2637.
A break of 2637 will test 2566.

STI RALLIES WITH WALL STREET. SUPPORT AT 2506. A Biden win gave the STI a strong boost and broke the ST downtrend on 4hr charts on the 3rd of Nov 2020 at 2517. The STI hit and intraday high of 2519.
Levels to support uptrend on the day and 4hr charts will be at 2506.
Uptrend targets are now at 2626 and then 2697 initially.
A break of 2506 will see the test of 2200.

STI: STRAITS TIMES INDEXSTRAITS TIMES INDEX
It is possible to continue the correction
Targets around 2236 - 1993
✅ f you like what I do, put 👍 and subscribe
Waiting for your comment, what do you think about this?

STI BEARISH ON ALL TIME FRAMES. WATCH 2448.The STI short signal on the 4hr charts issued on 271020 gave traders 2 days to prepare their shorts and trim positions.
The STI short signal on 281020 the day charts was the last line in the sand to trim positions.
STI gapped down on 291020 to test 2448. A break and hold below 2448 will test 2200.
Only a break and hold above 2509 will resume ST selling pressures.
The STI has been on a MT/LT DOWNTREND SINCE THE SHORT SIGNAL WAS ISSUED ON THE WEEK CHARTS ON THE 5TH OF OCT 2019 LAST YEAR.

STI key levelsHere are the key levels to watch on STI, overall direction is bearish as long as price holds below the trendline and a break below our pivot level could trigger a further drop

STI TESTS 2516 TWICEThe STI made an intraday high of 2569 on the 13 oct and has since faced selling pressure throughout the week to test 2516.
A break of 2516 will quickly move to 2509 and a close below 2509 will resume downtrend in all timeframes.
A hold above 2516 will test 2569 and may start an uptrend on the daily charts.

STI TESTING SUPPORT AT 2516The STI has paused its downtrend in the ST on 121020 at 2542.
The buy signal on the 4hr charts at 2510 remains valid only if 2516 holds.
A break below 2516 will test 2485 and a close below 2485 will resume downtrend on all time frames to test the lows.
A bounce from 2516 and hold above the SSSA daily charts above 2524 will relieve LT downtrend pressures and start a ST uptrend.

How much more to fall for STI ?Maybe the locals here love STI more than anything as they are familiar with it.
I have shown you guys before here why I prefer investing in US indices over STI.
Again, no right or wrong, it depends on your level of comfort and preferences.
Today, the government announced an important piece of news , read here. .
For those who are looking to invest in local stocks should pay attention to this news as it means a return to normalcy (at least 50% of pre-Covid 19 days, I hope) as workers are returning to office, entertainment pubs can reopen, restrictions lifted for sports facilities, etc.
We are about 3 months away from year end and if this reopening does coincide with the festive seasons like Christmas , it may be a good boost to the retail markets.
Of particular interest, I am watching some stocks that I either have invested or intend to take a position; these include but not restricted to
Suntec City
Comfort Delgro
Genting Singapore
DBS Bank
Wilmar , etc.
Also, December is a school holiday month and if certain travels are allowed, this would also boost the much needed retail therapy and travelling that many missed.
You would note from chart that DBS bank has a very close pattern with the STI as it is one of the main component stock of STI. Yes, DBS is also embroiled in some way with the 2 trillion money being laundered. Not sure how long the investigation would take, but I guess it may takes a while.......So, no hurry to scoop up the prices as you can see there is some more room to fall.....
Hang on there guys, light is at the end of the tunnel , stay positive .

STI BUY SIGNAL 091020 TARGETS 2547The STI has generated a buy signal at 2520 on 091020.
Immediate target is 2547.
A close above 2547 and hold will generate a ST/MT uptrend towards 2717
Failure to break above 2547 will retest 2510 and resume its MT/LT downtrend.
The STI is in a persistent MT/LT downtrend till otherwise indicated.

STI Weekly Chart - Good RR to longWeekly chart showing STI is well supported @ 2500
Good R/R to long

Key levels to watch on STI These are the key resistance and support area for me now, if prices reversed below our resistance area, a break below our green trend line could give the confirmation of a further drop to our support area

STI downtrend intact. Tries to stay above 2500. 031020.The STI has tried multiple times to hold the 2500 level in the last trading week.
A break and hold above 2510 will relieve the selling pressure.
A range within the downtrend has develop between 2450 and 2510 in the ST
A test of 2450 is still imminent.

STI downtrend struggles to break above 2500The STI is into its downtrend for 15th weeks now since the 24th of July 2020.
2500 level needs to be reclaimed and a close above 2520 will negate the correction.
The downside target of 2200 in the MT/LT remains a viable target if a sustained recovery above 2520 and 2551 fails to materialize.


STI consolidating for a higher lowSTI consolidating for a higher low, possible retest of previous highs

Descending Triangle Formed. Looking good to shortBased on TA, descending triangle should formed in a downtrend.
STI hit the TA theory exactly.

STI OUTLOOK 140920. weakness persistsThe STI is struggling to hold on to 2500. All indicators are on a downtrend.
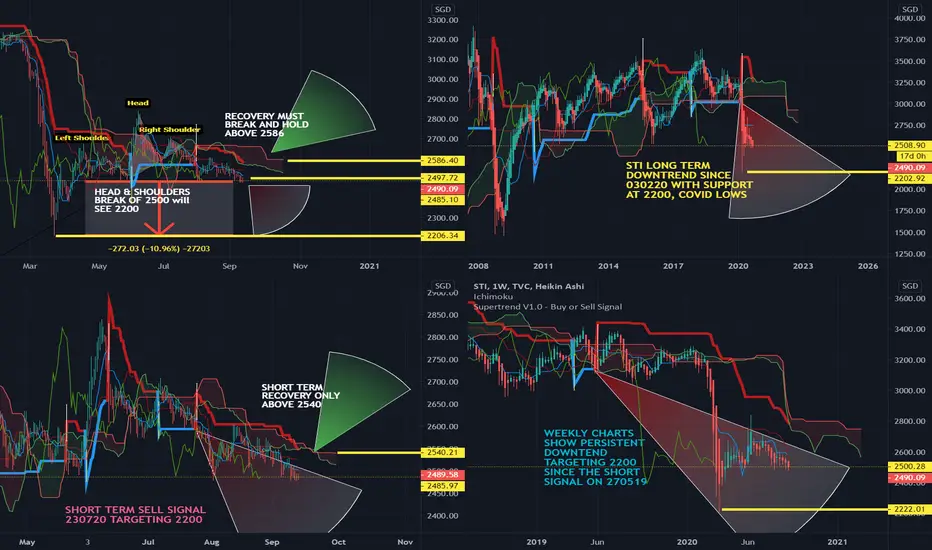
To negate short term weakness, the STI must close back above 2540 - 2586 and hold.
The Medium and Long term prospects are weak and in a persistent downtrend.
2200 is the next target is weakness persists in the MT.
Caution : STI closes below 3500.The STI is in its 8th month of correction since February 2020. The technical picture has worsened in the trading week starting 070920. My previous post on the 6th of Sep highlighted the technical weakness on all time frames. A worst case scenario of a test of 3200. It would be prudent for long only traders to lighten exposure for the last quarter of 2020.
For portfolio investors, they will be opportunities to look for trading ideas that I have and will continue to post as a trading idea.
For investors looking at buying on the dip, look for companies that have remained on an uptrend on the monthly charts that have held technically above the Ichimoku Cloud SSSA line.

STI - Singapore slumps into technical recessionSingapore's GDP shrank by 41.2% in the second quarter, following a 3.3% drop in the earlier 3 months.
All in all, the Head & Shoulder pattern has formed.
