SX5E trade ideas


Euro Stoxx 50 outbreak The european Index, DJ Euro Stoxx 50, representing the biggest 50 enterprises (marketcapitalisation) in Europe, has crossed the upper limit of the very long symmetrical triangle.
The fundamental data from EU-Zone and Europe are positive; only the EURO could be an obstacle because it had gained force in comparison with the US-Dollar. But this should change during this year, because of the tax reform from Trump and the tapering from the FED. The Dollar should strengthen versus the Euro.
The european central bank (ECB) has also tapered its QE-Program (with now producing 30 BN Euro per month - out of thin air) but it isn´t expectable to have rising interest rates as well.
With a weaker Euro the Global Player in Europe should take profit and have rising exports.
Of course there are many risks for the EU-Zone; for example the election in italy where it is expected that the Party of Grillo could win - and he is against all the austerity programs of the EU and the ICF.
Technically the Euro Stoxx 50 can profit from its outbreak - if the index doesn´t fall back.
Compared with the S&P 500 (blue line) european stocks have much space on the upside. P/E and P/B are also less expensive than in US.
indicators:
not bullish! - but little signs of a positive trend

Europe 50 starting a new rallyor at least another upleg towards 3700. Last time we updated that index we suggested we would see another leg down at minimum. We got that. Could have been the beginning of something more bearish but recent advance is not only impulsive ( the trend ) but has retraced enough of previous decline to leave us with waves overlapping indicating that at minimum we are in a bullish correction.
In other words if you are using the Elliot Wave Principle you cannot say for sure we started a new rally at 3466 i.e. a 5 waves affair with a minor correction in progress as wave 2 as shown on the chart BUT you can say with high confidence worst case scenario is we are in a bullish correction. The most bearish I could be for now is we would get another leg up towards 3700 in a B wave of a Flat that would be followed by a sharp C wave down just below recent low.
Markets are much more bullish that we all think. It's just it might start to get choppy. Hold on tight.

Road clear for Eurostoxx RallyThe correction, which began in November 2017 is most likely finished. It has cleared the road for further upside in the Eurostoxx 50. The ball is now with the bulls. We would like to see swift upside if our base case scenario is correct. It is depicted in black color.


EuroSTOXX: New Bullmarket - Target 5.500"European stock markets join the world party" - this is BusinessDay.co.za, Capetown, Southafrica, headline on January 3rd 2018. And continues: "World stocks hit fresh highs on Wednesday with European markets joining the party as early indications suggest 2018 will be another year of synchronised global growth led by a shining European economy. ... MSCI’s index of global stocks, which tracks shares in 47 countries, pushed on to new record highs on Wednesday — after posting its biggest one-day gain in more than two weeks on Tuesday, and in the wake of its best year since 2009 in 2017." ... "Investors have woken up in the new year and looked forward to another firm year for global growth with very muted downside risk," said Investec economist Philip Shaw, though he warned against reading too much into the first two trading days of the new year." ... "This after Wall Street started the new year as it ended the old, scoring another set of record closing peaks. The Dow Jones industrial average rose 0.42%, while the S&P 500 gained 0.83% and the Nasdaq composite index 1.5%. The gains in riskier assets came as industry surveys from India to Germany to Canada showed quickening activity. "The breadth of the recovery is extraordinary," said Deutsche Bank macro strategist Alan Ruskin, noting that of 31 countries covered, only three failed to show growth while all the largest manufacturing sectors improved." Source: www.businesslive.co.za
Since beginning of 2016 Europe is showing strong fundamental data such as 8 consecutive quarters of growing GDP, record low unemployment rate and record TAX revenue surplus in Germany and record high PMI´s all over Europe. Same time most European Stockmarket Indices are far away from All Time Highs seen before 9/11, 2008´s subprime or 2011´s Euro crisis. The major reason are fears about "The Rise Of Populism" in Europe. In Dezember 2016 (Italian Constitutional Referendum), the France Election in April/May 2016, The Catalonien Crisis and now before the upcomming Italian Parliament Election the fears are traded (short) in "The Rise of Populism Trade". Expectations for the next Election in Italy in 2 month form now on are clearly negative, once more. If ever this fears are overdone than European Stockmarkets will be effected by this and will go higher on the long run.
The chart itself also showing now a clear broken major 17-year downtrendline with a confirmed short term re test. Another re test might occur- even later this year. On the long run the EuroSTOXX 50 will turn higher for 2.000 points, at least until 2024. Europe k gets more attention from investors in Southafrica. Likely more global Investors going to focus on Europe on a more positive view. If the Italian Election might not cause major damages in the EU than the EuroSTOXX50 might gain strong momentum to the upside later this year or 2019/2020.


The trend *was* your friend- Bullish trend is broken
- Ichimoku setup is bearish, EWO and MACD are bearish
- HaOscilator suggests there may be some chance for a minor bounce. Chikou Span also hit past Kumo bottom, which means around 3480 there is some resistance. Any retest to 3520-3560 zone is an opportunity to look for a short entry.

Potential Reversal upon Closing Above EMA(5)I can see a potential Long setup for EUSTX50 index. Couple of things that I observed:
1. Price is currently retesting EMA(200) and this is also a resistance-turned-support zone (back in April 2017).
2. A divergence observed between the chart and RSI(14), as chart is making lower low, whereas RSI(14) is making higher low.
If price can close around 3530 (which I roughly calculate should be when it close above EMA(50)), then I may open a Long position. Otherwise, no trade on this index.

Triangle Pattern In The Eurostoxx 50 Index -> CorrectionIt looks like the Eurostoxx 50 is tracing out a contracting triangle as part of its correction. The structure is nearly finished and should resolve with a spike to the downside. Overall the structure most likely forms a corrective zig zag before the most European equity index continues its journey to the upside. We are bullish after this correction completes!


Stoxx 50 / SX5E - Short Long Term - Up to 1000 Pips OpportunitySX5E seems to not be able to get into a reversal phase yet. If the current support does not hold, we can expect it to fall further below.
However, if the support holds firmly, then the opportunity is lost.
I will keep an eye on it as it does seem to be weak at the moment and open a position at the right time.
Expect to keep it open for at least a week.
Happy trading!


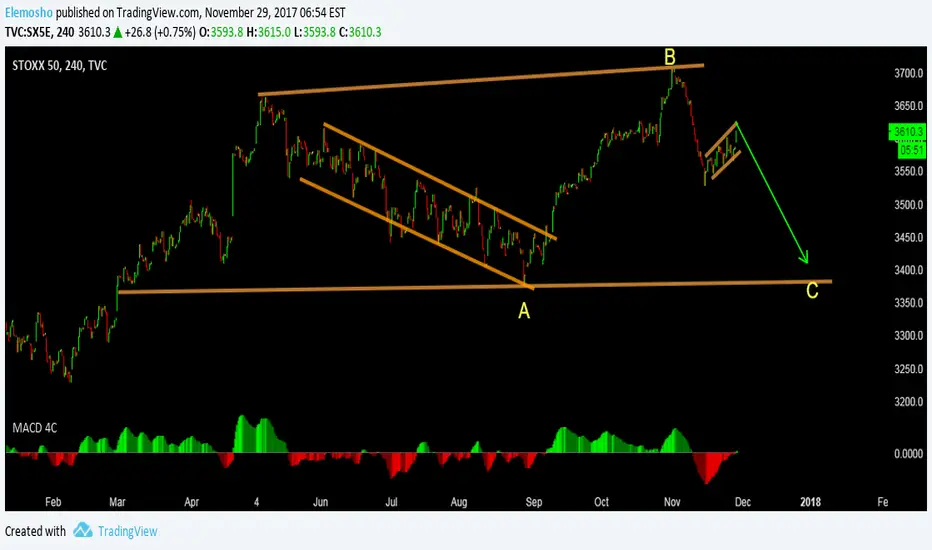
STOXX50 - SELL ContinuaI am expecting and ABC correction on the EURO STOXX 50 to complete the C leg.
LIKE and FOLLOW for updates
Happy Trading (*_*)
EUR STOXX50 (4hr chart). Sell the break of confluence.EUR STOXX50 (4hr chart). Sell the break of confluence.

Weakness - Bulls are not strong enough- Ichimoku is back to neutral. Price trades in thick Kumo. Warning: Senkou span cross (bearish Kumo twist) 26 weeks ahead!
- Heikin-Ashi shows mixed price action, indecision, consolidation. Warning: haDelta+ and haOscillator may give sell signals.
- MACD shows weakness
- EWO is bearish
I think bulls cannot have much hope on this market now.

Euro 50 as clear as the DAXWe are not sure if current corrective rally is over but to us the picture is quite compelling suggesting as long the November high holds we must expect another leg down that should bring the index close to 3400.
A well divided wave down ( The trend ) followed by a choppy advance ( Corrective counter trend ) just make it for a textbook Elliott pattern. That being said Is it only a larger correction in a big bull market or the beginning of a bear market? That is not clear. Not at all.
We will take it one wave at the time.


STOXX50 longLook for bullish evidence and long-> move to breakeven as soon as possible.
In the past 13 years, every time when the mkt move below ema from an uptend, the chance of going up is 5/6.

