SXY (Swiss Franc) Swissie So, the Swiss Franc is generally used as a reserve currency. Something different from The Reserve Currency, but similiar. During times of high volatility investors look to throw their money in safe haven currencies like the Swiss to protect from the wild whipsaws of the market.
So, here on the swiss there are no Harmonic Patterns to speak of so the COT data will have to work.
So, what we have is the Swissie is the Non-Coms took a major step foraward toward the Zero Line.
The commercials have further increased their longs to 16,366 which is a 1,934 increase from 14,432 and the Non-Coms are really increasing their shorts by double. We went from 4,375 to 8,697 orders short which is an increase of 4,322.
Now on to the Net data:
the Commercials:
current- (4,280) // Previous- (7,754)
Non-Coms
Current- 1,766 // Previous- 8,989
So as you can see we have taken major steps to the zero line especially in regards to the Non-Coms which i think the Swiss' bull run is coming to an end, and it might be wise to plan on shorting the Swiss here pretty soon.
SXY trade ideas


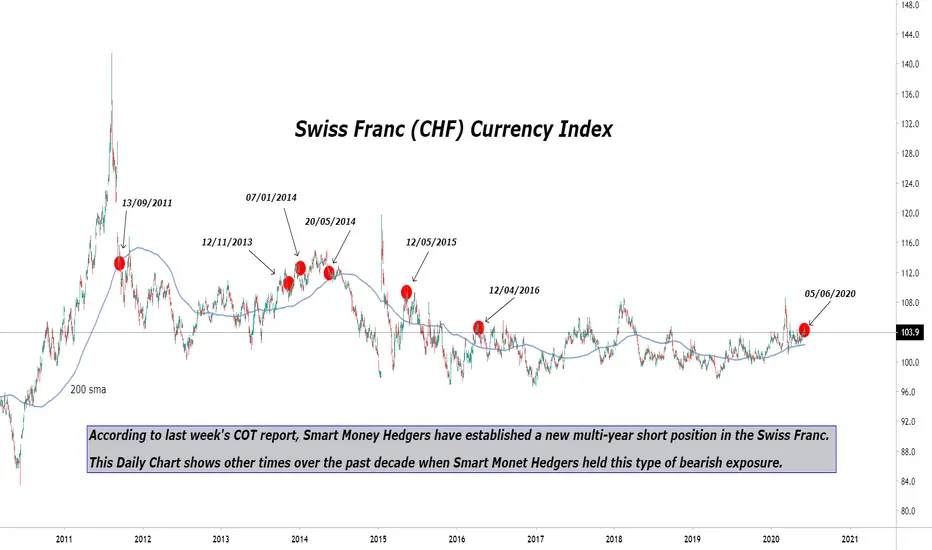
Smart Money’s new Multi Year Short Position.. #forex
Each week, the Commodity Futures Trading Commission (CFTC) publishes a report known as the Commitment of Traders (COT). In this report, information on long and short positions held by three groups of traders can be found. (Commercial Hedgers, Large Speculators, and Non-Reprtables).
Commercial Hedgers, more commonly known as ‘Smart Money’ Hedgers
Large Speculators, Funds, Investment Banks, etc
Non-Reportables, Individual Traders, small funds, etc
Depending on your trading strategy, knowing the exposure held amongst these three groups of traders can help determine future price moves.
In this article, we are focusing on the ‘Smart Money’. When the Smart Money Hedgers have reached an extreme, (current exposure held, same as 3-5 years prior) we consider this to be a notable event.
Smart Money Hedgers are good at what they do, there is no doubt about that, they have an excellent track record of ‘getting it right’ most of the time. But in order to trade off the back of Smart Money’s positioning, we need to understand a few basic things.
First things first. The data within the COT report is NOT a buy or sell signal, it’s more of a broad outlook at how the three groups of traders are positioned. For example, if a trader is long on a particular asset and is intending to hold his/her position for the medium term (up to 12 weeks) it would be helpful and useful to monitor what the large speculators are doing as they are trend followers. The Smart Money on the other hand uses a very complex strategy, they hedge their positions and lock in prices along the way. At Bottomcatcher we take note of the exposure held amongst Smart Money Hedgers once they have reached an extreme as they tend to influence the markets and steer it at extremes. So in this case we would be looking for turning points.
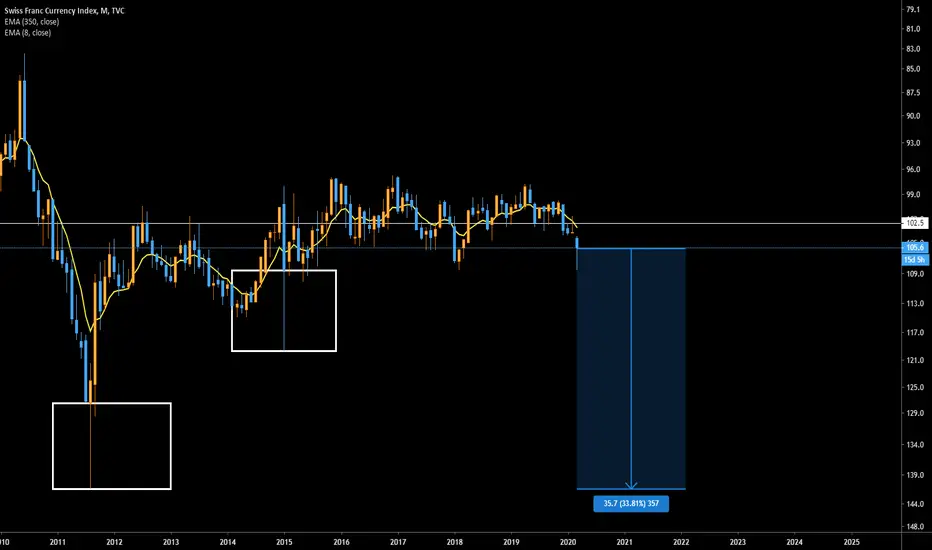
Once an extreme position has been established, in this case, the Smart Money is ‘Short’ the Swiss Franc (CHF), we then have the challenge of getting the timing right. (Hence, the COT report is NOT a buy or Sell signal provider). The timing of a change in direction (turning point) can vary from days to months, on average it’s about 3 weeks. By plotting a 200 period daily moving average on a chart can help us determine when to get into position.
A good example of this is shown in the above chart, in particular on 20/05/2014 when the Smart Money was heavily Short. It finally broke below its 200 daily moving average on the 17th July 2014 some two months later (that would have been the sell signal) and continued to decline 14%. Other times whilst holding above the 200 daily moving average, Smart Money Hedgers managed to drive the CHF down somewhat, at the very least capping further upside for the medium term against its peers, which may well have been their intention.
CHF Analysisif he breaks the 104.9 level it will go to the 107.1 level
OR if he goes down and breaks the 101.1 level it will go to 99.9 level
Still, RSI there are not buying or selling saturation
BETWEEN THE 101.8 & 104.4 IT MAY GO IN HORIZONTAL WAY
ALSO, THERE ARE NOT IMPORTANT NEWS ON CHF


Wait 107 point for bullish Swiss FrancThe Swiss Franc index is in a descending triangle scince 2011 and it is already breaking the symmetrical triangle and it is time to climb but we are waiting for a break of point 107.8 in order for the real rise and departure to start the targets shown on the chart. The downtrend since 2011 has waited for the highlighted points to break and not to rush.


The Writing on the WallThe Swiss during WWII stored Gold for the Nazi's.
If you think the Swiss are fools, I recommend you eat a Bat.

Buy all Currency against CHFBuy all currency against CHF this week. #USDCHF Might Rocket upside move as US30 will tend to support, they might talk of good results in drugs and Vaccines this week. #GBPCHF another strong upside. #EURCHF might resist not much upside expected. Target SXY 104 to start Selling #USDCHF and #CADCHF. EURO might also bottom and go Up supporting #EURCHF or keep it Sideways.


