TNX - The Event we've been waiting for since July We have repeatedly indicated the "Everything Must Go Sale" would begin
once we saw 10 Year Note Yields Cross 1.645 and then move beyond 1.71
to 1.76 and onto 2.12%
All asset Classes being sold is NOT something the Majority of Investors
remotely understand or believe it possible.
Preferring Correlations and Inverse Correlations to remain the Norm.
It isn't and the September Sell-off appears to have been forgotten.
Not surprising, memories are short, convictions are strong.
Price does not care what you "believe" - rather it demonstrates the
convictions of your beliefs.
Belief in the 11X Bond Complex... remains at all-time highs.
Return of depreciating Captial is favored to Equities which continue
to be the perceived Inflation Hedge.
The circular Logic is a complete Sh_t Mix of Mass Delusions as participants
will discover one the Next Great Unwind begins.
Everyone losses a hand.
_______________________________________________________________
With last week's one Day Wonder spiking @ nearly 10% while the DX began
to move over 95... RCO's are again heating up.
_______________________________________________________________
We indicated the Infrastructure Bill would end up @ $1 Trillion after all
the non-sense - Ultimately it was the FEDs handlers who reduced the
increased threat of a Bond Market Accident.
Suggesting DC piddle into a far less Aggressive Final number, Rates were
tamed down, preventing an even larger protest from the 007s.
Monday, President Biden signs into Law - $ 1 Trillion Infrastructure Bill.
AKA - another Giveaway to Insiders.
_______________________________________________________________
How much time does this Buy for the Equity Complex, we shall see.
It will become yet another nail in Confidence Coffin as Inflation continues
to Beat Expectations.
_______________________________________________________________
Q4 begins to see squaring of Position for yeat end begin into December.
With Notional Bets to a Strong finish to 2021 for appearance's sake, there
IS something out there... that will blindside the markets.
_______________________________________________________________
The 30 Year Auctions Failure... did not go unnoticed.
TNX trade ideas


TNX - 10 Year Note YieldNo mention of the 2% jump off the Trend Line for Yields.
We sold TLT 3x today.
ZN, as indicated after the 8 AM Sell, provided the Direction.
The Equity Complex is setting up the Reversal with Squeeze
after Squeeze.
For the next 3 Trading Days - Continue to press all SELLS to 45%.
____________________________________________________
The Bond Market will call the FED again...
We anticipate a Chop into one Final High prior to a Sharp Reversal.

TNX - 10 Year Note YieldWaiting on ZN to break 130 again.
Rates up .9% this morning.
IF the FED panders to Equiites.
Bonds will sell, there was an 8 AM EST SELL

TNX - RSI remains above 50The 10 Year Note Yield, in prior downtrends would provide the RSI in the Negative well below 50.
ARCA, as always is used to Prop Up the FANG GANG.
But BANG, the die is cast.
Anticipating a reversal in the 10 Yr Yield into the FOMC, which creates and enforces the SELL in
TECH.
EPS, as indicated months ago, would be a complete disaster...
Delivered.
NQ ES YM - 4 Gaps below
Symmetry mirrors September 15, 2021 reversal setting up.
2% - 2.12% - 2.37% Price Objectives on Break of 1.765

TNX - MeanwhileWhile Higher Taxes for the Muddle Class are on the way.
The Billionaires Boys Club sees the Stimmy as their Salvation.
Higher Taxes? Only if I can get First Abuser Rights to 10X what
I'll be required to pay for "Them"....
The Bond Market believes the Stimulus - "Further Recovery,
Infrastructure, Spending Bill" will get things on track once
it's pared back to $1 Trillion...
How do you mend a Broken Global Economy as Yield Curves
are flattening around the Globe?
You cannot.
Global Markets - showing the way.
And all those people out of work and resources?
F_ck em, appears to be the Path.
____________________________________________________
Have a good evening everyone

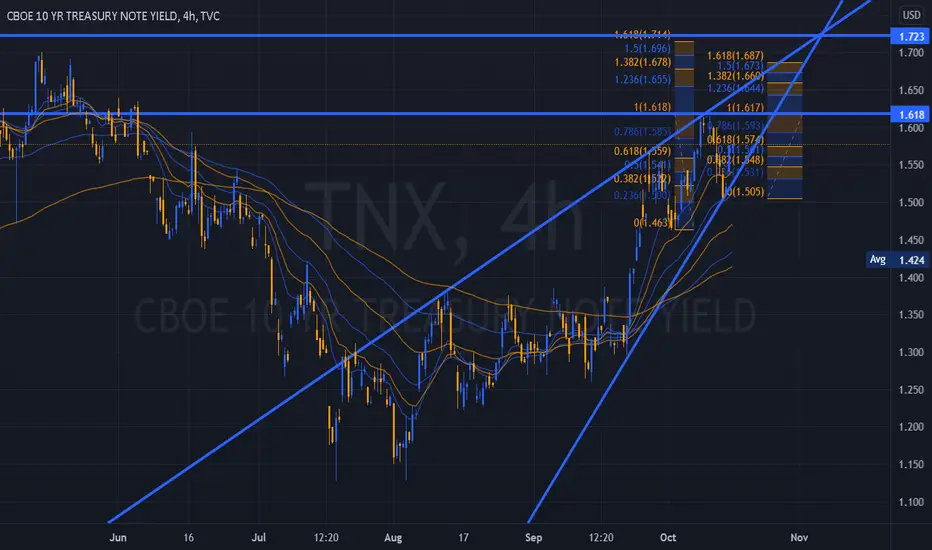
TNX - 10 Year Note Yield / High to Highs FIB Wave ExtensionsThe 10Yr Yield is performing as indicated. The Reversal is trading
the Trend Line and FIB Extensions to near perfection.
Beyond the 1Hr, which is a better TF to illustrate the Price
action - The Daily continues to remain in Strength within the
trend.
The Trade Plan has a break of the 1.7650 Highs as the Catalyst
for the test of the Equity Complex 200SMAs.
Given the Complexity of this Counter-Trend, Equites could continue
to rise as Yields Rise for the Short Term.
_________________________________________________________________________
The current Environment is dis-similar to 2016 when Yields and Equities
were rising. Traders cite this as a non-conditional similarity and are
using it to Echo.
It is entirely dis-similar and not a confirmation by any metric.
The Markets in 2016 were fueled by a Tax Cut, a Give-away for the very
Wealthy and Corporations.
Since March of 2020, Price action has been fueled entirely by the "V" Shaped
Recovery narrative - Supported by $10s of Trillions in DEBT - Daylight and Shadow.
The Meme's for Buying are far and wide - Fundamentally, they are almost always,
without exception - Incorrect - Fundamentals do matter, Debt matters, Solvency
matters... This abject degeneracy will meet its maker in 2022 as 5/5 concludes.
Never in the History of the US Equity Complex has Factual Reality been this distorted.
It will end with the Equities Markets down 50% - 90% IMHO.
_________________________________________________________________________
During Powell's Friday discussion, his admission "Inflation is not Transitory, but here to
stay longer than the Federal Reserve had Initially indicated..."
Any Human purchasing Food & Energy was far ahead of this malaise from Chair Powell.
Inflation Fears will need to be calmed for there not to be a Panic event, we indicated
it would be Supply Shortages devolving into a 30%+ Price increase.
Historically - this is the trigger of prior Inflations throughout History.
_________________________________________________________________________
The Hourly indicated it is time to pay attention to a return to Fill at least one of the
GAPs below and backtest the lower trendline, the overthrow appears to be short-term
exhaustion.
This would provide the NQ with room for a retest of the recent highs @ 15483, well short
of our Price Objectives Between 15513/17.

Are Rising Rates Over Rated ?? These are twelve month candles. Since the decline in rates started in 1982 there has never been a single close above overhead resistance on a year over year basis. Are we getting carried away with fear of rising rates?

TNX - A break of 1.645 during GlobexThis break, although outside of RTH, is indeed important.
It signals a retracement potential, but more importantly it
opens the Higher Price Objective @ 1.71 - 1.76.
The Equity Complex is pretending the "what me worry trade"
once again.
We are concerned, as it represents a very large issue for the
Equity Complex should the ROCs continue to build.
All eyes should be on the Yield Curve's MidPoint. It can imply
a rather large selloff.
Today thru Tomorrow has all the hallmarks of problems developing.

TNX - Breaking 1.645Could post a problem for the Equity Complex.
The ROC's would begin to increase again, averaging 3.12%
would push TNX to 1.71 very quickly.
This would not provide anything but a SELL for TECH.
The DX has been supportive of Higher Prices for Equities
as it remains in a small Countertrend.
The JPY/USDX is the primary cause.
Once the Fuse is lit, it is Blue Skies

A market event in Treasuries: wave 3 of E is loomingIt's hard to believe, but 3-4 weeks from now the 10Y yield will break above 3% (could hit 4..5% in a couple of months). This should cause all stock markets to lose 2/3 of their market cap, and should bring EURUSD way below parity (0.88 is the target).
For the last few months the cycle always ended around the 20th of the month. Just compare DB, TLT / TNX - if you want to appreciate the subtleness of action of the invisible hand of the market.


TNX Watch the 10 year early next weekInterestingly the 10year yield retested the 618 and broke higher on Friday at the same time the NASDAQ rallied into the close. It's a good idea to keep and eye on this going into next week. At this point the yield looks prime to go back to 1.69 or higher. Whether the market cares or not will be determined.

TXN - 10 Year Note YieldWe Indicated the 10 Year Note Yield would initially retest the Highs
several months back.
We can see the APEX resides at the Prior Highs.
The effort will be a multi-week affair, although as ROCs continue
to build we are beginning to see Wider spread within the FIB Wave,
indicating caution at a Resistance of 1.645%.
The DX is benefitting from this as GOLD begins to SELL once again.
It's time to pay attention very closely to the Bond Complex - it remains
at Risk for now and the unexpected is shaking the confidence of a great
number of Retail Traders who piled back into TLT on the aspirations of
yet another Large Bull run to 172.
Probability, 007s - is not on your side.
The coming Reaction will provide some very real indications over the coming
weeks. We can see the effects upon the NQ this morning.
As 8 AM ET approaches, let's see how the Bond Complex begins its Position for the
Week ahead.
New2021 Lows for ZN as Financials appear to have made a Double Top.
Trade safe out there, speculators. The past is not Prologue.

TNX - 10Yr Yield /'Come on IN Equity Dip Buyers"The waters warm - just fine and we assure you there are no
predatory creatures lurking about.
Please ignore the Trend.
Our assumptions include:
The Herd is always Correct.
CNCB and Lacy Hunt are "Pitch Perfect".
Rates are heading lower, towards ZERO.
TLT's hiccup this morning is nothing, simply a
small bump on the road until 172.
Debt doesn't matter, It's in the "Future" - we
never subscribe to the idea of "Back to the Future"
as our overlords are merely us from the Future...
We are cocksure confident - "This is It~!" No more
down, only up, the SELL is Over.
No one would dare SELL Bonds here with Negative
Real Returns.
No one would demand higher rates, ever... regardless
of the insurmountable DEBT Load.
The FED won't' permit the Bond Vigilantes to Price in
Inflation again as it is - wait for it... "TRANSitory.
Yeah, naw, wrong again desperados.
Looking rather forward to the NEXT SELL in TLT.
- HK

ARIASWAVE LONG TERM VIEW -BITCOIN -DOW JONES -GOLD -10YR YIELDSThis video was originally intended to be a members only video but I have decided to share it with all my followers.
In this video I share my thoughts about the long term view of these markets.
It has been a long process in terms of thinking about how certain markets will impact each other in the long run.
Every time I share my ideas it allows me to reflect on each one after the fact at a deeper level in order to identify possible faults in the analysis.
This leads to a lot of background process thinking and is entirely based on the AriasWave methodology.
This is why they are called ideas and they should never be taken as financial advice.
My goal is to understand where we are in the long term patterns in order to produce better long or short trade ideas consistently depending on the pattern for that market.
These ideas are also mostly understood by current members that have already begun learning and using the AriasWave methodology.
The AriasWave methodology teaches you exactly whether or not a correction is complete because it describes exactly what is involved in the corrective process.
In essence everything is a correction, it just depends on the magnitude and the observable degree of trend using available chart data.
I welcome productive comments and hope to bring you some actionable ideas that help you with your own analysis in the years to come.
Remember to use Disciplined Money Management Principles to ensure longevity as a trader.
If you don't know the long term pattern shouldn't you be doing your research instead of just following the crowd?
Just remember: I am not a financial advisor, I suggest using this only as a guide. Always do your own research.

TNX 10y government bond yields falling Wondering why are growth stocks moon lambo-ing today? TNX 10 year government bond yields is started falling last night. It's good for tech.

Three Time Domains and their ImplicationsAs a foundation to my theory - this chart shows crypto to be the new Gold regardless of predictions by talking heads.
Fundamentally, most disasters are man made, usually when we see ourselves as God. That is a whole other topic. COVID itself being man made is not as important as the power grab by ideologists (the bane of mankind) and the restriction of freedoms and trade. Volatility will remain high based on government manipulation to the point of collapse.
My theory is this - that unrestrained supply and demand of crypto as an asset gives credibility to the use of Fibonacci retracements in crypto trading when it comes to order timing.
The charts that follow show how Fib retracements based on unique chart characteristics can give insight for price action and risk analysis.
My assumptions are;
* Volatility regime consistent
*Algorithm trading still fear/greed based, not driven totally by AI, yet
*Market manipulation not feasible in crypto by design
For everything there is a season, hope this helps your situational awareness regarding price action and risk analysis
Grace and Peace

10 year yield is trending higherThe 10 year yield is in a clear uptrend. This is important to keep an eye on, because a wise man once said: "Interest rates are like gravity for stocks...." If interest rates continue higher, then the stock market could run into some trouble....

TNX - 10Yr Yield largest SELL Side Offer since Mid-FebruaryPricing in "Inflation" has been a series of rapid events for Price.
Yields began the highest velocity spike in History during the
January to April adjustment.
Bond Sellers have begun to increase their Sell.
Retail is now 83% Short against the NQ ES YM... ahead of the
most important Week we have had in Months, Since February.
TNX has run-up to its -.236, a Catalyst Level.
Duress in Bonds will further increase VX in Equities, both directions
as there are only a limited number of Capital Pools.
Money will flow where the returns can develop:
CASH
METALS
COMMODITIES
BONDS
STOCKS
REAL ESTATE
Crypto (Unregulated Illusory Capital)
Choose wisely, this cuts both ways.
It is remarkable how few Bond Holders did not envision this
possibility. The engrained mindset becomes one of defiance at
any cost to preserve the Cult's Dogma.
The Bond Market within the United States is ever so slowly
being destroyed, its destruction is accelerating for reasons
we have outlined repeatedly.
Trade Safe out there, disruptions are simply beginning.
- HK

10 Year Note YieldPrice is moving in a well-defined channel on the Shorter duration.
The DX remains stubbornly over 94, a level that appears to be acting
as Support for now.
A pause that refreshes, one that TLT is attempting to make sense of
in its way to 139.
TLT tracks a market-weighted index of debt issued by the US Treasury
with remaining maturities of 20 years or more out to 30 years.
What remains a clear divergence is the weighting to the Mid-Point
of the UST Curve.
TLT is sickly as ZB underperforms ZN to the downside, it holds up better
in a SELL due to duration.
This divergence has been growing for some time and provided a clear
indication all is not well in the Land of Wood Paneling.
A veneer so thin, you can see through it... if you are paying attention.
Fortunately, most do not, the tendency towards swilling the "conventional wisdom"
satisfies their cleft palates.
Repeated Pies in the face, a welcome event as Purchasing Power Parity continues
to decline. The Market is raising rates out the Curve in defiance of YCC.
The thinking is... you're borrowing insane amounts of Debt and we are collecting
Chicken Scratch... you'll need to pay us more.
You may control the Short end of the Curve, but out here... all you can do is offload
your accumulated Debt on your balance sheet to feed us - xoxo 007
Reverse Repurchases increased 60% in 30 Days to $1.621 Trillion.
60% in 30 days.
Yeah, naw, that is not going to work much longer - the revolt has simply just begun.

$spy $tnx $tlt A breakout and confirmation of pattern = BearishIf this pattern plays out, it would be disastrous for stocks and bonds in my opinion, as bonds become more attractive in yld and stocks traders (massively leveraged) have to deleverage.
