Headed back to 1.3 (10yr) I think the yields take a break this week and pullback to retest that 1.37 area.
Chart is the exact inverse of the SPX 1hr. Sept job report Friday could could effect whether we fall back below 1.37 or bounce
TNX trade ideas

The catalyst after another fake out SPX rally thats coming The catalyst after another fake out SPX rally thats coming and will or may send us into the needed bear mode

Value vs. Growth + US10YTalk about sensitivity to interest rates. Long duration equities or short duration? Value or Growth? In this type of environment, at times it can feel as if interest rate movement is the end all be all. To be honest, if you think that, I don't believe you're necessarily wrong. Sensitivity to changes in the yields is driving the displayed relationship. For now...

TNX base breakoutTNX broke the 1.37 level I was watching. The alert went off yesterday but the market did not react. Today a different story. See previous chart.

TNXweekly RSI on TNX moved above 61.8. Last time when weekly RSI moved above this level, ten year yields rose from around 1.53% to around 1.76%.

A market event in Treasuries: wave E is no jokeThe amount of destructive power accumulated in the markets is unprecedented. All bubbles are going to pop at the same time. The short dollar, the long stocks and all other yield: all will unwind (unexpectedly as usual) in the most violent fashion. We are going to see a nearly 100% correlated move in all instruments. I track around 40 symbols and all of them stage a huge move. It feels like the entire market has approached a cliff... and is ready to embrace the void.
10Y yield surely will hit 4-5% in wave E. Wave E usually completes everything wave C didn't dare.
1929 is no comparison to what's coming. Back then the Dow only lost 49%, and this time stocks will lose 2/3 of value, accompanies by another 2/3 haircut in debt.
There will be only two safe havens: the Dollar (EUR below 0.90) and the Yen (USDJPY ~87), EURJPY below 90.

TNX Heading Higher?Not really sure what to make of this just yet, but the 10Y yield definitely appears to be heading higher. Ironically enough, this is happening amid a #fed that is committed (at least in the near term) to maintaining low interest rates.
My guess is the Fed knows rates will rise on their own, thereby creating a competitive environment among lenders.
We will continue to watch this one; for now it looks like we are heading to test 1.75 - 1.77. Neither long, nor short for now. Let's just observe.

Rates Breakout - Be Cautious on the ramifications24/Sep/2021 08:22 AM AUTHOR: Brandon Gum
--
10 yr yield is breaking out.
This is after they were down 5% on Monday of this week on Evergrande default contagion fears.
Fed met this week. They indicated tampering(?)
Sentiment trader suggested that lots of money managers are not positioned for a move higher in rates and to be careful of your positioning and know what you own.
IWM should outperform (as they do with rising rates - though I dont understand the text book theory behind this.
Regional banks should do well in rising rate environment.
Growth names that leverage cheap capital will be hit.
No comments on other sectors. Im not there in my development yet.
======================

US Government Bonds 10YR Yeld (TXN)We can bet that there will be a recession before 2024. The reverse repo agreements of the Fed surges to all-time highs in 2021, with those financial firms parking more than $ 1 trillion in funds at the Fed since August. Isn't that related to Evergrande's failure? The first signs began right towards May/June. Evergrande has not paid interest on maturing dollar bonds and, probably, someone was forced to sell the family silverware or government bonds to create liquidity, strictly in dollars. I make a random name: China?

TNX basing for a reversal?Yields gapped up after the long weekend. Keeping my eye on this again as the TNX is developing a basing pattern despite the fact that everyone expects low rates to continue due to the weak job report last Friday. If the bond market starts pricing in higher rates it could be something that would spook the market. May just fall back again as it has been doing but worth paying attention to.

TNX, target: 0,000$ until 2023TNX most likely scenario: we will check the new trendline one more time until 2023, target: 0,000$
stop loss: the former support line: 1,500$ - 200 ema on 5 year chart: 1,700$


bullish pattern ahead for bitcoinbitcoin is going to up as it follows 10y yield and it is going up from here .

Global equities remain strong at the end of the monthThe S&P 500 is on track to close its seventh consecutive month with gains after another record close on Wall Street. For many investors, August was a surprisingly strong month for equity markets, with the S&P 500 up more than 3% for the month and the technology-heavy Nasdaq 100 up as much as 4%, marking its third straight month of gains. Markets in Asia performed well, with the MSCI Asia-Pacific Equity Index hitting a more than two-week high. Europe is also on track to finish the last day of the month strong. The dollar weakened again, while the key 10-year US-Treasury yield was trading at around 1.28%. The strong rally at the end of the month was triggered by supportive Fed policies and a very strong corporate earnings season. In Afghanistan, the Taliban celebrated a victory over the US and its allies after the withdrawal of US troops from Afghanistan. Oil prices continued to move sideways as traders assessed the prospect of additional OPEC+ production, while other commodities gained, particularly aluminum and nickel. Bitcoin fell to around $47,000.
The markets reacted exactly as we expected on Friday and continued their positive momentum in the following days. The momentum remains in place for now, and I expect markets to continue to advance in the third quarter as strong corporate earnings and growth rates, combined with the Fed's ongoing stimulus measures and low interest rates, continue to support. Although some sectors such as energy and financials are experiencing temporary headwinds due to slightly lower oil prices and a less steep yield curve, the equity market rally is broad-based. While the technology sector is currently performing stronger, I see cyclical sectors such as consumer discretionary, industrials and real estate performing strongly in September. Traders are now waiting for Friday's key jobs data, which will shed light on the strength of the economy and influence bets on the Federal Reserve's next move on bond tapering. A strong jobs gain will boost the USD by increasing the likelihood that the Fed will take further steps toward tapering bonds. A weak outcome would likely lead to further USD losses. The best outcome for the stock market would be if Friday's NFPs were close or slightly better than expected (+750K jobs).


TNX - 10 year bond yieldWeekly chart of US 10 year bond yield. Rates bottom around RSI 38.2 at the end of July 2021. RSI is currently approaching 50 level where there is resistance as was the case in Dec 2019. RSI 50 also provided support in Aug 2018. So, that level is significant. If RSI is able to move above that level, it would show clear intent that rates want to go higher, which would be negative for tech stocks

10 YEAR BOND YIELD - Have Interest Rates Bottomed?My count has not changed that much over all the attempts that I have made at finding the right count in this market.
Which is why I always ask the question, have interest rates bottomed?
I believe once we rise above a couple of key levels mentioned in the video we will have more of an idea.
At the same time I find it intriguing how the NASDAQ and Dow Jones both appear to be at an inflection point.
I have linked the latest NASDAQ and other ideas below.
Remember to use Disciplined Money Management Principles to ensure longevity as a trader.
If you don't know the long term pattern shouldn't you be doing your research instead of just following the crowd?
Just remember: I am not a financial advisor, I suggest using this only as a guide. Always do your own research.


CBO 10-TY TREASURY: Elliott Analysis and RUSSELLElliott Forecast. Note the wave correlation between the 10-yr yield and the Russel US2000.
The RUT tends to consolidate as the 10-yr yield lowers or corrects.
Trade your plan.


TNX chart we have a rotation look daily turning up but candle hitting 200 day can pull back some maybe
look weekly on bottom heading up
I said we hit near 1.20 1.30 banks run
Know lets see how far we can get TNX near 175 we will then puke market
Remember TNX up banks rally
TNX down QQQ up
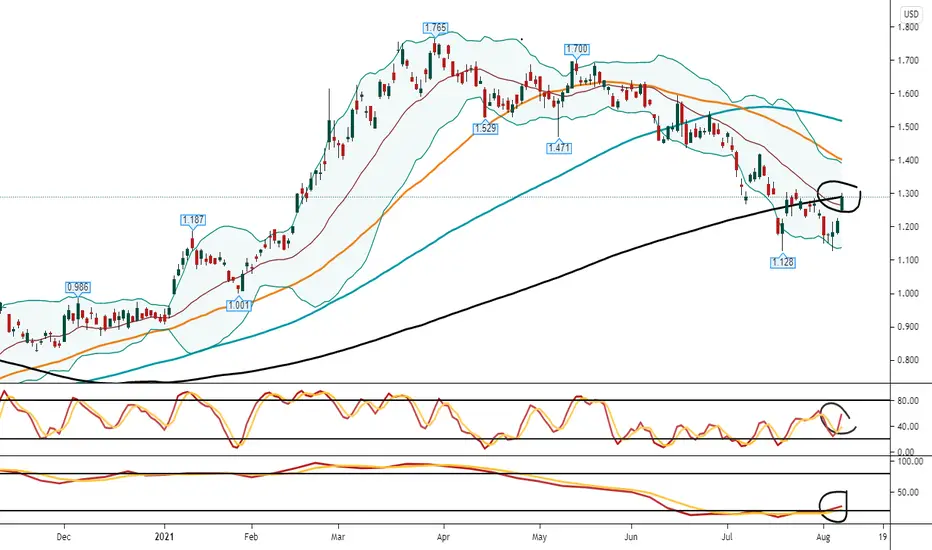
Bonds Yields May Have BottomedAfter four months of sliding, bond yields may be turning higher.
The first pattern on this chart of the 10-year Treasury Yield is the double-bottom around 1.128%. This corresponds to an oversold condition on the weekly stochastic, which has often marked bottoms for TNX.
Next is the price action in the iShares 20+ Year Treasury Bond ETF (TLT). It tracks longer-dated securities, but is a useful and liquid instrument that provides inverse signals:
Notice the rising trend line that began in early June and is now breaking. TLT also had a bearish engulfing candle on July 20 that served as resistance this week. In addition, Wednesday had a bearish hanging-man candle. Those patterns on TLT suggest the uptrend in bond prices is exhausted. (If correct, it means yields will move higher.)
This could be a big deal because early 2021 saw a dramatic shift toward value stocks and away from growth. Another move up in yields could revive that trend. Banks and financials in particular could benefit.
TradeStation is a pioneer in the trading industry, providing access to stocks, options, futures and cryptocurrencies. See our Overview for more.

TNX Yearly R1 to the Yearly PivotLook for next support on the Yearly pivot point(P) at 1.07%. the Yearly R1 pivot point to the Yearly P = textbook algorithmic move.
