TNX trade ideas

TNX: 10 Year T-Note Yield Headed Higher? The Jury Is OutYes, the Fed has spoken. Halloween came early and the sky was falling.
I don't think the 10 Year T-Note Yield is going much higher.
The Federal Reserve doesn't control the front end on the curve. The market does.
I still remain bullish on bonds and-TLT.
The above chart is still in a down trend channel.
The CHOP is high (indicator under the chart), but is back in the shaded area below 61.8.
Look, Friday was a good cop bad cop Fed speak mumbo jumbo gumbo. The markets don't have clear direction.
So, I will think rates are going higher ONLY IF yields break the down trend channel to the upside.
If the Fed does raise rates - this will most likely have very negative effects on all markets, especially foreign.
I don't think they will.
So don't panic. Follow your charts. They will know when. Right now I think rates head lower.
Good luck to you. Don.
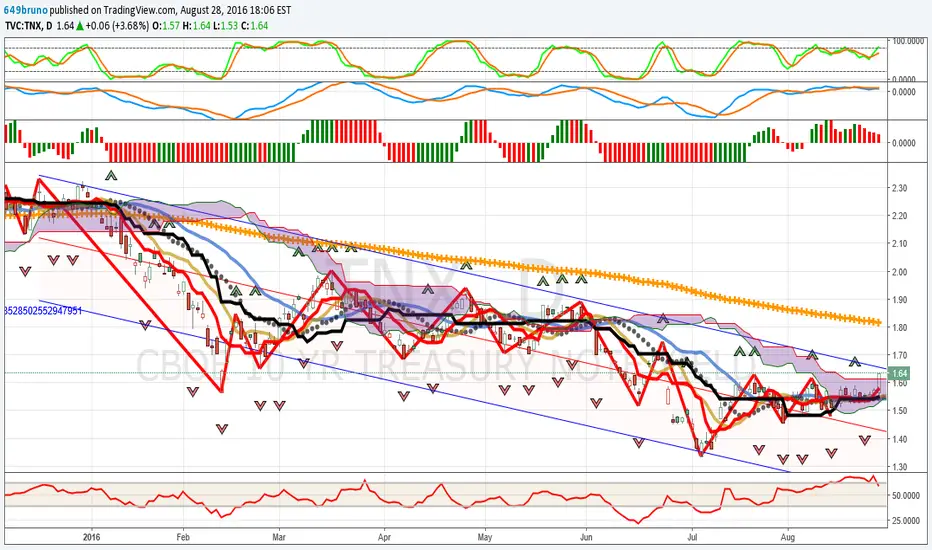
TNX: 10 Year T-Note Yield: Longer Term View Is LowerThis is the longer term view (daily chart) for the 10 Year T-Note Yield.
It is heading lower.
I would change my opinion if....
1. The yield trades above the Ichimoku Cloud;
2. The 89 day moving average turns up;
3. The Alligator jaws open and feed in the up-trend.
4. The red border on the top of the cloud switches and becomes green (indicating a positive trend).
5. The yield breaches the down-trend channel to the upside.
Until then, it is my opinion that 10 Year T-Note yields will head lower.
Good luck to you in all your trades. Don.
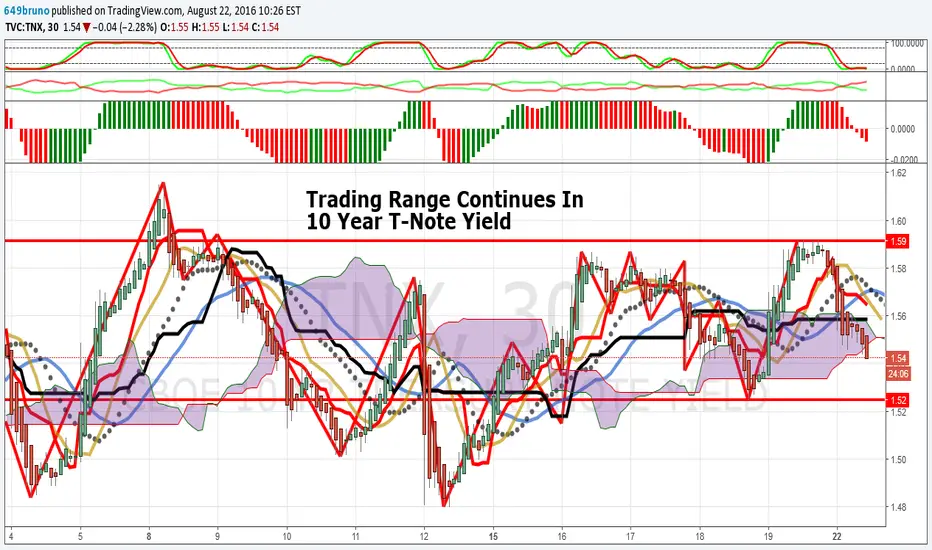
Trading Range Continues In 10 Year T-Note YieldI am publishing this chart because 10 Year T-Note Yields are essentially trading from
1.59 on the high side to 1.52 on the low side.
Interest sensitive assets generally trade in concert with these pivots.
Which way will the trading range be resolved?
Based on the longer term chart (published next), I believe 10 Year T-Note yields will break to the down side.
Good luck to you in all your trades. Don.
Summer Doldrums: 10 Year T-Note Yield: Clues For Trades, Part 2Part 2 of 2.
This is a close-up of chart one, just the past 30 days.
It is summer and volumes are low.
10 Year T-Note yields are in a tight trading range, from 1.59 to 1.49,
and volumes can put you to sleep.
Add to the mix the Federal Reserve regional commentary, some hawkish, some dovish -
And you have all the conditions for whip-saw action.
So, whether it's currencies-bonds-stocks-gold-REIT-etc.
Light volumes and excessive pivot swings may "goof-up" your trade.
Pay attention to daily and weekly charts when trading a 15 minute/ 30 minute chart.
Knowing the longer trend is critical.
Good luck to you with your trades. Don.

Summer Doldrums: 10 Year T-Note Yield: A Clue For Your TradesPart 1 Of 2.
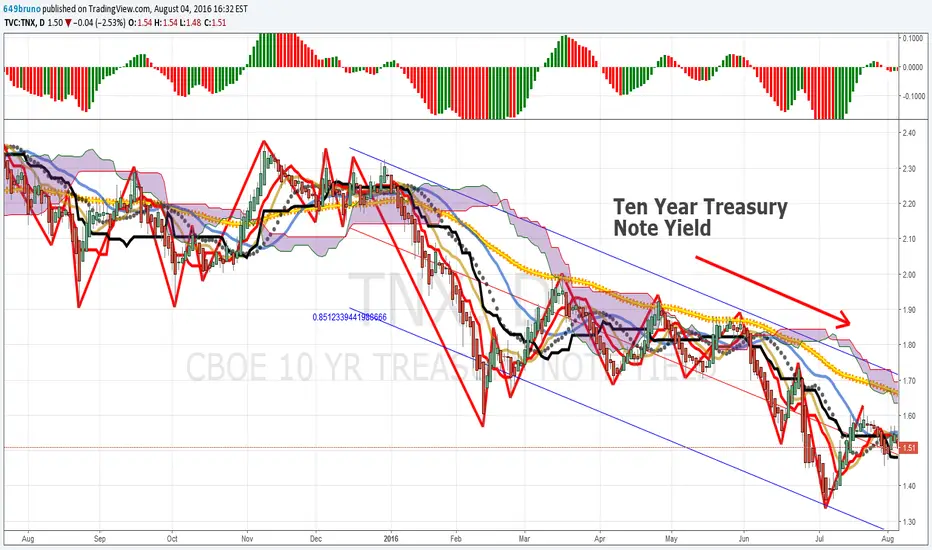
This is a chart of 10 Year T-Note Yields. It is in a down-trend, for sure.
The yield was 3% at the beginning of 2014. It is half of that now.
What trades do you try and execute that are impacted by 10 Year T-Note yields?
Go to chart two for a close up of the "summer doldrums trading pattern" as generated in the bond-market.
Don.

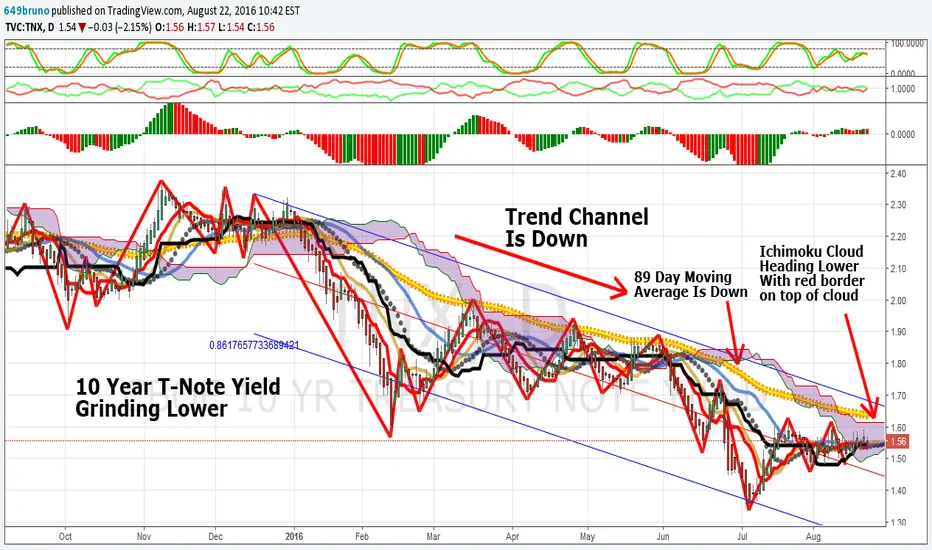
Which Way Are U.S. Interest Rates Heading? Down.This chart is part one of two.
I wish to show you the INVERSE relationship of falling yields and the bullish pattern in-TLT.
(The chart for-TLT published next).
There is a lot of down-side pressure in this chart.
A falling Ichimoku cloud , a sinking 89 day moving average , and a regression trend channel that is solidly DOWN.
In my opinion the 10 Year T-Note yield will soon sink to 1.40, then 1.25.
This should fuel-TLT to continued bullish highs.
Good luck to you. Don.


Ten Year U.S. Treasury Note Yield (TNX)This chart is for the Ten Year U.S. Treasury Note Yield.
If you are considering interest sensitive assets (such as real estate, or REIT's), use this analysis to guide your decision.
In my opinion interest rates are FALLING. They have been falling for a long time.
As I published many times, look for INVERSE relationships between interest sensitive items and falling rates.
Don


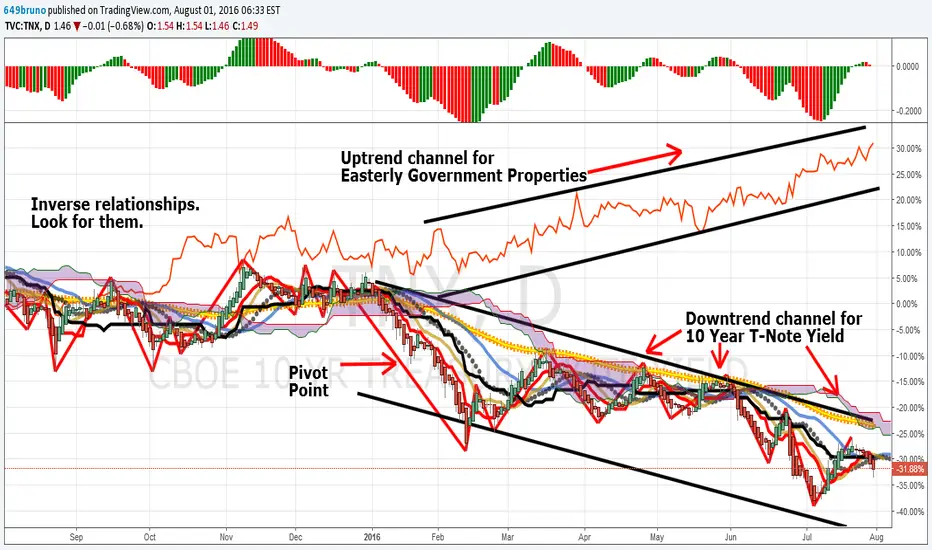
Falling US 10 Year T-Note Yield Vs Easterly Govt Properties: DEAEasterly Government Properties-DEA.
Another strong INVERSE relationship.
Here is another example of CAUSE & EFFECT you can use. A classic predictive tool.....
The INVERSE relationship when interest rates fall and real estate assets rise.
Easterly Government Properties, Inc. is a real estate investment trust (REIT). The Company is focused primarily on the acquisition, development and management of Class A commercial properties that are leased to the United States Government agencies, such as the Drug Enforcement Administration, Federal Bureau of Investigation, Internal Revenue Service, Patent and Trademark Office, Customs and Border Protection, U.S. Forest Service, Immigration and Customs Enforcement, and Department of Transportation. The Company owns approximately 40 properties in the United States, encompassing over 2.6 million square-feet in the aggregate.
They also currently pay a 4.49% dividend.
I ask you to compare both channels on the above chart. There is a direct correlation between the falling yield and the rising stock price.
This is the INVERSE RELATIONSHIP you should be looking for.
DEA-had a secondary public offering (of 6.1M shares at $18) on 06-02-2016. The last close was $20.49. I have to conclude the offering was well received.
As always, good luck to you. Don.
Falling US 10 Year T-Note Yield Vs Caretrust REIT: CTRECaretrust REIT.
Another strong INVERSE relationship.
Here is another example of CAUSE & EFFECT you can use. A classic predictive tool.....
The INVERSE relationship when interest rates fall and real estate assets rise.
CareTrust REIT, Inc. is a self-administered, self-managed real estate investment trust (REIT). The Company is primarily engaged in the ownership, acquisition and leasing of healthcare-related properties. The Company's segment consists of investments in healthcare-related real estate assets.
They also currently pay a 4.71% dividend. Their earnings are due to be reported 08-08-2016.
I ask you to compare both channels on the above chart. There is a direct correlation between the falling yield and the rising stock price.
As always, good luck to you. Don.

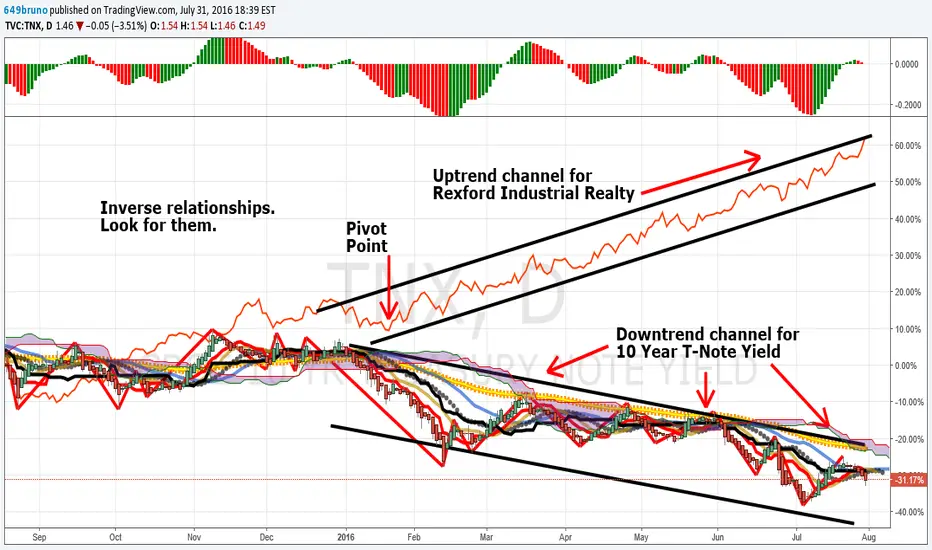
Falling US 10 Year T-Note Yield Vs Rexford Indust Realty: REXR
Another strong INVERSE relationship.
Look at REXR-Rexford Industrial Realty. Here is another example of CAUSE & EFFECT you can use. A classic predictive tool.....
The INVERSE relationship when interest rates fall and real estate assets rise.
Rexford Industrial Realty, Inc. is a self-administered and self-managed full-service real estate investment trust (REIT). The Company is focused on owning, operating and acquiring industrial properties in Southern California infill markets. The Company's consolidated portfolio consists of approximately 119 properties with over 12.0 million rentable square-feet.
They also currently pay a 2.36% dividend. Their earnings are due to be reported 08-03-2016.
I ask you to compare both channels on the above chart. There is a direct correlation between the falling yield and the rising stock price.
As always, good luck to you. Don.
SDY: S&P SPDR Hi-Dividend ETF Vs Falling 10 Year T-Note YieldAnother strong INVERSE relationship.
Look at SDY-the S&P-Hi-Dividend-ETF. Here is another example of CAUSE & EFFECT you can use. A classic predictive tool.....
The INVERSE relationship when interest rates fall and dividends become important.
SDY-seeks to provide investment results that correspond generally to the total return performance of the S&P-High Yield Dividend Aristocrats Index. The fund generally invests substantially all, but at least 80%, of its total assets in the securities comprising the index. The index is designed to measure the performance of the highest dividend yielding S&P-Composite 1500 Index constituents that have followed a managed-dividends policy of consistently increasing dividends every year for at least 20 consecutive years. The fund is non-diversified.
If the 10 Year T-Note yield is falling, the SDY-should be an inverse trade, and the SDY-ETF should keep grinding higher.
As always, good luck to you. Don.

Realty Income Corp (O): Falling US 10 Year T-Note Yield Vs "O"Another strong INVERSE relationship.
Look at O-Realty Income Corp. Here is another example of CAUSE & EFFECT you can use. A classic predictive tool.....
The INVERSE relationship when interest rates fall and real estate assets rise.
Caution: O-continues to rise because it has a sound business plan. So falling rates alone will not save a poorly run company.
But it sure will enhance a company such as-Realty Income Corp.
They also currently pay a 3.38% dividend.
As always, good luck to you. Don.

XLF: Falling US 10 Year T-Note Yield Vs XLF (Banks)With the S&P-500 at all time highs, have you ever wondered why financials are lagging?
Many people bought bank shares last year because they were cheap. Guess what? They got cheaper.
This is a comparison of-XLF and the falling yield for 10 year T-Notes.
This is a a NON-INVERS E relationship.
If yields keep falling, banks will have a very hard time making money on interest rate spreads.
Some regional banks may buck this trend, but I believe most will not.
If crude slips below $40 per barrell, many banks will have non-performing loans with oil companies.
My conclusion, XLF-grinds lower as 10 year T-Bill yields continue to fall.
Good luck to you with all of your trades. Don.

Falling US 10 Year T-Note Yield Vs Silver (SLV)Inverse relationship installment number 5.
I thought I would show you an INVERSE relationship between silver-and-falling rates.
It is not nearly as strong as-gold .
In quality engineering we would call this a problem with the "signal to noise ratio".
The signal would be the falling 10 year yield, but the noise is that silver-doesn't rally as well as-gold.
In April rates FELL but silver-also went lower. Just before May 1st yields rose and silver-rose.
Not exactly an INVERSE relationship - so I wouldn't use one to help predict the other.
Since mid-May silver-has demonstrated an INVERSE relationship with falling yields - but, as I said, not as strong as-gold.
Good luck to you in your trades. Don.

Falling US 10 Year T-Note Yield Vs Terreno Reality (TRNO)Inverse relationship example number 4.
One tool I use to position myself, long or short, is any strong correlation in the 10 Year Treasury Note yield and an interest sensitive asset.
Look at Terreno-Reality. There is a CAUSE & EFFECT you can use. A classic predictive tool.....
The INVERSE relationship when interest rates fall and real estate assets rise.
Caution: TRNO-is also rising because it has a sound business plan. So falling rates alone will not save a poorly run company.
But it sure will enhance a company such as-TRNO. This is why I have been long TRNO-many times.
One other thing. The stocks I have featured, ADC-TRNO-MNR, all have great dividend yields as well as great earnings .
This would be one reason why the INVERSE relationship is so strong.
Martin Zweig taught all of us to NEVER FIGHT THE TAPE. I don't.
When I see a good harmonic pattern or a STRONG INVERSE RELATIONSHIP I act on it.
As always, good luck to you.

Falling US 10 Year T-Note Yield Vs Monmouth Reality (MNR) Inverse relationships installment number 3.
One more time - One tool I use to position myself, long or short, is any strong correlation in the 10 Year Treasury Note yield and an interest sensitive asset.
Look at Monmouth-Reality. There is a CAUSE & EFFECT you can use. A classic predictive tool.....
The INVERSE relationship when interest rates fall and real estate assets rise.
Caution: MNR-is also rising because it has a sound business plan. So falling rates alone will not save a poorly run company.
But it sure will enhance a company such as-MNR.
This is why I have been long MNR-many times.
As always, good luck to you.

Falling US 10 Year T-Note Yield Vs Gold (GLD)Inverse Relationships Installment 2.
One tool I use to position myself, long or short, is any strong correlation in the 10 Year Treasury Note yield and an interest sensitive asset.
Look at-Gold. There is a CAUSE & EFFECT you can use. A classic predictive tool.....
The INVERSE relationship when interest rates fell and gold-began to breakout to the upside.
This is why I have been long gold-SWC-HL-GORO-GDX-many times.
My advice is to look for INVERSE relations and strong correlations in opposite directions.
It will give you an early warning for market turns.
As always, good luck to you. Don.

Falling US 10 Year T-Note Yield Vs Agree Reality (ADC)One tool I use to position myself, long or short, is any strong correlation in the 10 Year Treasury Note yield and an interest sensitive asset.
Look at Agree Reality. There is a CAUSE & EFFECT you can use. A classic predictive tool.....
The INVERSE relationship when interest rates fall and real estate assets rise.
Caution: ADC-is also rising because it has a sound business plan. So falling rates alone will not save a poorly run company.
But it sure will enhance a company such as-ADC.
This is why I have been long ADC-many times.
I think it's due for a pullback to $49, and then the uptrend should continue.
As always, good luck to you.
