TNX US 10 Year Yields.. A pause that refreshes ?As 10 year yields tend to drive many investment decisions these days ...
My current view of where we have been and with a roadmap for where we are headed.
Not investment advice. Do your own due diligence.
S.
TNX trade ideas

Potential Topping Patterns in Treasury YieldsFew charts have mattered more to investors recently than the yield on the 10-year Treasury note. After a strong move to the upside, some contrary signals may be emerging.
The first pattern on today’s chart is the potential “hanging man” candlestick on October 19. It was followed by a lower close, and then a trio of bearish outside days. Such price action may be consistent with a reversal.
Second, MACD made a lower high in late October as yields inched higher. That kind of divergence (marked in yellow) can reflect exhaustion of a trend.
Third, the recent lower highs have produced a descending triangle. While this isn’t typically a reversal pattern, the tightening prices may indicate the uptrend has lost strength.
Next, TNX has come within roughly 20 basis points of the yield on the TVC:US02Y two-year Treasury note. That level for the yield curve was the peak in September 2022 before it inverted under 100 basis points. Is it also holding the longer rate down?
Finally, we previously identified 5.25 percent as a potential upside level. However, TNX has approached 5 percent without being able to close above it. Some traders may view the “nice round number” as a logical place for the move to end.
TradeStation has, for decades, advanced the trading industry, providing access to stocks, options, futures and cryptocurrencies. See our Overview for more.
Important Information
TradeStation Securities, Inc., TradeStation Crypto, Inc., and TradeStation Technologies, Inc. are each wholly owned subsidiaries of TradeStation Group, Inc., all operating, and providing products and services, under the TradeStation brand and trademark. TradeStation Crypto, Inc. offers to self-directed investors and traders cryptocurrency brokerage services. It is neither licensed with the SEC or the CFTC nor is it a Member of NFA. When applying for, or purchasing, accounts, subscriptions, products, and services, it is important that you know which company you will be dealing with. Please click here for further important information explaining what this means.
This content is for informational and educational purposes only. This is not a recommendation regarding any investment or investment strategy. Any opinions expressed herein are those of the author and do not represent the views or opinions of TradeStation or any of its affiliates.
Investing involves risks. Past performance, whether actual or indicated by historical tests of strategies, is no guarantee of future performance or success. There is a possibility that you may sustain a loss equal to or greater than your entire investment regardless of which asset class you trade (equities, options, futures, or digital assets); therefore, you should not invest or risk money that you cannot afford to lose. Before trading any asset class, first read the relevant risk disclosure statements on the Important Documents page, found here: www.tradestation.com .

ACKMAN!!!! Ackman Bond Short.
4% to 5%
Don't Overthink it
...addanfdakkfdandfaskpnpdfinpndpankniafnpadsnpfeanpfksadnpkfndpafnpdsppdknsnfdsdfna
fpdpmjafsdoko [kads[kp
faofadpomfoodsaomp

WHY TO GET BULLISHNow every bear will come out and say market going to crash. In my opinion i am bullish and this is the double bottom setup. Looks at TNX it has formed a double top which means it is going to go down which inturn will push equities higher. I have loaded calls .

$TNX The First of Many Targets TNX is reaching it's first target of many in a swelling breakout. Noted are the target levels to watch out for on the way up, ultimately looking to close our long position nearing the 10% line as we fill this bullish box.


The Red Trend Is the One We Should Avoid Dipping my toes in the treasuries.
This began as a look at the 10 Year in the near term. The consensus and overwhelming opinion is the yields at 5% sometime next year. It seems like the yield will be above it's current yield for most of 2024.
The above was what seems likely based on some research. The surprise could be a rapid (further) rise in yields during Q4 in which case they'd come back down perhaps as early as Q1/2 of next year.
------------------------
Reason for posting: The Red Channel is a scary one indeed. We are currently in it, it is not all that well defined yet, but could easily be a well defined trend as early as end of next year.
Scary? At 10% yields, you can probably convince the masses into adopting a centralized digital bank currency, perhaps even global. The roughly 8 years until 10%, if in that trend, is much time for much to happen.
--------------------
Love one another and take these posts as a piece of paper picked up on the sidewalk, there is no intention for this to be taken as advice for anyone else's decisions, except the love part :)

Short Term Yields fall, NORMAL Curve coming?🚨🚨🚨🚨🚨🚨🚨
1 & 2Yr #yields are falling pretty decently today.
This can be very good short term.
However.......
It's conceivable BAD in the long term (has been historically) IF the curve normalizes.
Current rates
2Yr 5.056 vs 10Yr 4.749
The #Fed rarely does things right. I Wonder. Why is that? Can it be by design?
#bonds #stocks TVC:TNX

3 major spirals f 10.11,12 Call for a PEAK in 10 yr 10/4-10The data and time data = price the spirals = time I now have 3 very powerful points that call for a MAJOR PEAK this week they all focus 10/4 ,5,10 see pinned tweet to understand . time spirals based on the golden ratio of lunar cycles MY BIBLE

$TNX Historically is highGood Morning!
Historically, Since 1967, #interestrates have been MUCH higher, around 2008 they began to go lower. Most individuals never mention this.
So what's the BIG DEAL?!
The US was growing FASTER & the DEBT is now ASTRONOMICAL!
Costs a TON in payments alone!
SOMETHING has to give, SOON.
Daily we could be setting up for some relief.
TVC:TNX

10yr yield set to drop. Bearish AB-CD patternlooking for yields to drop from here. I'm targeting 4.696% at minimum which is B leg of the bearish AB-CD pattern. Also there is a double top resistance forming (bottom chart)

$TNX looking to normalize = Not good short termWe've made a stink about the TVC:TNX & the TVC:DXY for a VERY long time now. WAY OVER 1 year.
They're trading congruent & it's a danger.
Short term #interestrates have been stuck for a while.
Keep looking for a normalization of the #yield curve!
= Long term rates higher than short term (getting closer).
#dollar #stocks

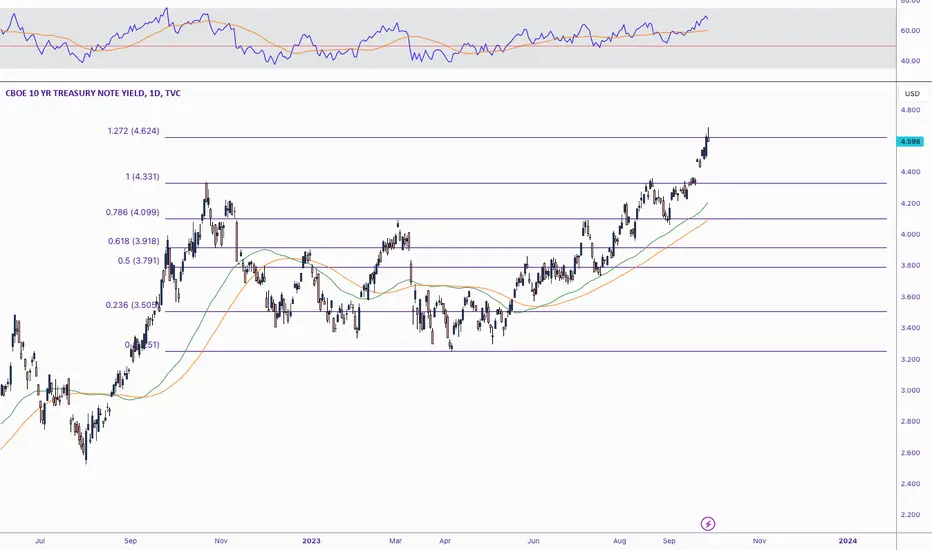
TNX Q2 2023, 1d chartKeeping an eye on the progress for 10yr yields.
Reaching the 1.272 fib, if the DXY weakness persists, this might retrace some back .
Previous TLT idea:
Will $TNX catch up to shorter term yields?G-Morning!
Shorter term yields haven't moved much as of late.
Demand has slowed down & this coincides with the expectation that the #fed will be cutting rates soon.
The 2Yr #yield recently caught up with the strength of the shorter term #InterestRates & looks to be settling in the area just like the others.
On the other end the 10 Yr #yield has been pumping.
HAs been strong & hasn't been this overbought since Sept 22.
Many compare #InterestRates to GFC (Great Financial Crisis) but they were on their way DOWN vs now, they are on the way up!
Back then this was not much of an issue because #debt was SIGNIFICANTLY lower. Compared to Trillions now.
TVC:TNX

How High Can Yields Fly?Borrowing costs are back in focus after Jerome Powell & Co. made some hawkish revisions to next year’s Dot Plot. How high might they go? Today we’ll ponder that question using a long-term monthly chart of the 10-year U.S. Treasury note’s yield.
The first pattern is the falling trendline that began way back in 1985. TNX ripped through that level 17 months ago, ending a generational decline in U.S. rates.
Next, the move broke the pre-pandemic peak around 3.25. Notice how yields came down to test and hold that level between March and May. So, an old high becomes a new low. Does that confirm a directional change?
Third, TNX hit 4.33 last October. That was almost exactly the same level where it peaked in June 2008 as the subprime meltdown took shape. Above that level, the next apparent resistance would be the June 2007 high of 5.32. Depending on how things go, traders may look all the way up toward the May 2001 high around 5.53.
TradeStation has, for decades, advanced the trading industry, providing access to stocks, options, futures and cryptocurrencies. See our Overview for more.
Important Information
TradeStation Securities, Inc., TradeStation Crypto, Inc., and TradeStation Technologies, Inc. are each wholly owned subsidiaries of TradeStation Group, Inc., all operating, and providing products and services, under the TradeStation brand and trademark. TradeStation Crypto, Inc. offers to self-directed investors and traders cryptocurrency brokerage services. It is neither licensed with the SEC or the CFTC nor is it a Member of NFA. When applying for, or purchasing, accounts, subscriptions, products, and services, it is important that you know which company you will be dealing with. Please click here for further important information explaining what this means.
This content is for informational and educational purposes only. This is not a recommendation regarding any investment or investment strategy. Any opinions expressed herein are those of the author and do not represent the views or opinions of TradeStation or any of its affiliates.
Investing involves risks. Past performance, whether actual or indicated by historical tests of strategies, is no guarantee of future performance or success. There is a possibility that you may sustain a loss equal to or greater than your entire investment regardless of which asset class you trade (equities, options, futures, or digital assets); therefore, you should not invest or risk money that you cannot afford to lose. Before trading any asset class, first read the relevant risk disclosure statements on the Important Documents page, found here: www.tradestation.com .

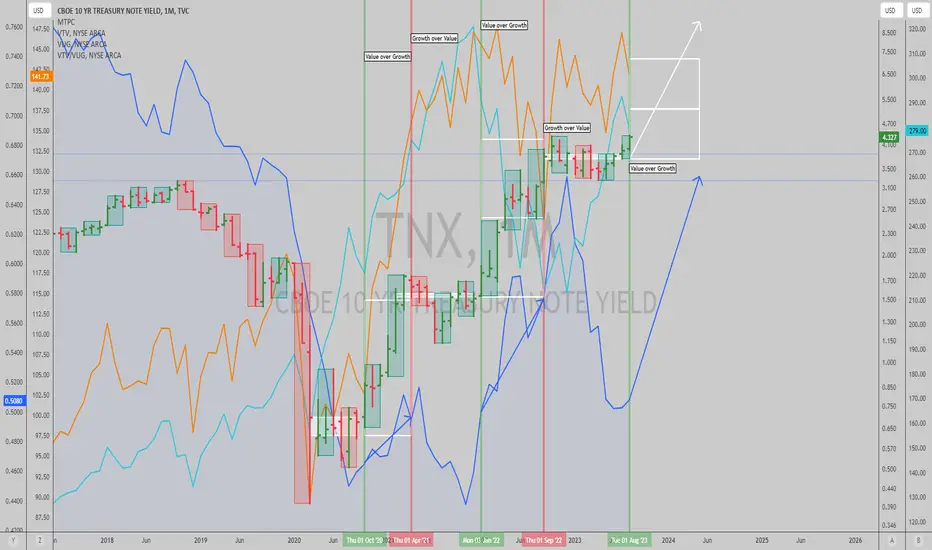
$TNX: Monthly trend in rates helps rotate effectivelyUntil recently, value stocks were underperforming, prompting questions about the relevance of the value factor. During the pandemic, growth stocks like Amazon and Tesla thrived, but as economies reopened, value stocks improved. However, the shift to value didn't materialize as both value and growth stocks have experienced alternating periods of strong performance and underperformance which we could track effectively monitoring Time@Mode trends in the monthly TVC:TNX chart as shown in this publication.
Long-term interest rates, as indicated by the 10-year bond rate, play a significant role in determining the performance of these stocks. When rates rise, value stocks tend to do better because growth stocks, with longer-term cash flows, are discounted more heavily, making them appear less valuable.
We are entering a period of fast and substantial increases in interest rates, as per Time@Mode analysis of 10-year bond rates. Thus, I expect energy, value, coal and other names to perform well while this rally in yields lasts, relatively vs growth, biotech, and other rate sensitive names.
Best of luck!
Cheers,
Ivan Labrie.
$TNX $NDX $DJI $SPX $DXY $VIX calls from Sept 11 on pointWe posted an interesting idea September 11th. These are today's notes.
---
The TVC:TNX is pumping higher - "Coincidentally" the SAME time frame that the TVC:NDQ TVC:DJI & SP:SPX are breaking down!
The 2yr has moved a bit & is testing a breakout level.
All shorter time frames from the 2year are STAGNANT!
#stocks #dollar #yield

yields and oilCrude oil went up over 1000% in the 1970s.
We now have the most aggressive 8 year moving average for yields in over 50 years.
Got commodities?
#crudeoil #uranium #gold #silver #inflation #yields #fomc #fed #copper #platinum

$TX 10Yr has done well while short term yields stagnant, oh ohIt's important to keep and eye on the 10 & 2Yr yields.
The inverted #yield curve has huge prediction probability.
BUT
The strongest aspect of this is when it normalizes.
We're not far from that as the10yr has been pumping and the shorter time frames have been pretty stagnant. Now, there's 2 ways this happens.
Soft landing, economy slowly recovers
OR
Lower rates, usually = consequences
Guess which is the historical?
TVC:TNX

$TNX, 2Yr Yield, $DXY, $VIX analysisThe 10Yr - TVC:TNX and the 2Yr #yield have held pretty steady the last few days.
Won't be shocked if it doesn't do much until the DJ:DJI & TVC:NDQ , "coincidentally", break out of the patterns we've spoken about.
TVC:DXY losing a lil bit of steam. Is it topping again?
The only odd man out is the $VIX.
It's closer to the lower end of range. IMO this is just something to look at and not of much use until it is.
September will go out with a BANG!!!
One way or another!

The Most Important Chart In The WorldOne seemingly unassuming asset holds a tremendous sway over EVERYTHING: yield on the 10-year US Treasury bond.
Often referred to as the "risk-free rate," as it rises, a domino effect is set in motion, triggering adjustments in mortgage rates, credit card interest rates, lending rates, and the valuation of growth stocks.
That's why I'm saying this is the most important chart in the world.
Study it. Chart it. Follow it.
For homeowners and prospective buyers, changes in the 10-year Treasury yield can be the difference between an affordable mortgage and a substantial financial burden. This impacts millions of home buyers, banks, and middle parties that handle massive transactions.
Credit card interest rates also dance to the tune of the 10-year Treasury yield. Many credit card issuers tie their interest rates to this benchmark, meaning that as the yield climbs, credit card APRs rise as well. This directly affects consumers, who find themselves paying more in interest
on existing balances and new purchases.
Ooooof! See why the 10-year yield matters so much?
There's more...
Lending rates, which influence the cost of borrowing for businesses and individuals alike, are tightly connected to the 10-year Treasury yield as. When the yield rises, banks adjust their prime lending rates upwards, making loans more expensive. This can lead to a slowdown in business expansion and capital expenditure as borrowing becomes less attractive.
Growth stocks... shall we address the elephant in the room? As the yield on the 10-year Treasury rises, the opportunity cost of investing in riskier assets also rises. Investors may shift their focus towards safer assets like bonds due to the improved yield, causing growth stocks to lose their appeal. The valuation of growth stocks heavily relies on discounted cash flow models, which incorporate the risk-free rate as a discounting factor. A higher risk-free rate can lead to lower valuations, affecting investment decisions.
In conclusion, add this asset to your watchlist.

TNX its your time40 years of equities rising, could it be its time for bonds to take hold. A 40 year trend broken clearly and with power, and the FED doing all it can to keep its rise down, yet increasing rates? Its about the next election, and the pivot point of a country. Its the economy stupid, is the election base, but they wont speak it, they are covering it up. Bidenomics is a all an illusion, supported by the "free" press. When they have achieved total disinformation levels, and they have, they will have accomplished their goal of total slavery. "They will believe anything they are told now".

$TNX has been pumping while short term yields fizzleGoing to bring this up AGAIN.
Short term #yields have been stagnant for some time now. Most are trading within a VERY TIGHT RANGE.
3Month - 1Year yield has been relatively flat.
The 2Yr had nice bump but is struggling to go over 5%.
HOWEVER, we pointed this out some time ago, the 10YR has BEEN PUMPING! TVC:TNX
