Commodities Double Bottom?Looking at Commodities via the Thomson Reuters/CoreCommodity CRB Index (TRJEFFCRB), an index that tracks 19 commodities including coca, coffee, copper, corn, gold, orange juice, soybeans, unleaded gas, wheat, etc, to see if the 1999 bottom will continue to hold as support today.
We can see price has currently found support on the bullish order block formed back in 1999, rebounding off that block and creating what could turn out to be a double bottom.
The trend is bearish, as confirmed by our Range MA indicator, and our Bull/Bear Power indicator even signaled a downtrend via a red arrow at almost the perfect local top on Jan 6, 2020.
Right now the question is should we be looking for a reversal of the bearish trend and close short positions (for example puts on commodities ETFs that are reflective of this index)?
To get confirmation of a reversal of the bearish trend, we will be looking for a long signal from the Bull/Bear power indicator as would be represented by a green arrow on the chart.
TRJEFFCRB trade ideas

The philosophy way of approaching saving energy(no "free" energyThe philosophy way of approaching saving energy( FYI there’s no “free” energy )
Since 2016 we've been using solar panel for saving energy. After that, by having a project to use this economic way of the COP more than 100% in 10 years, it has become a little bored. So we’ve begun to explore the ways of using solar panel at night.
Evidently now within a world economic recession of the central banks manipulation failure, within a condition of weather changing, 90% days is rainy in this city and no sunlight to kill disease. We feel maybe it’s time to make a small innovation here. Based on many ignored acknowledge on the internet.
1, we have to admit that there’re many people have had a “perpetual machine” succeed. That’s very easy if you can use some self-recover source of energy, like using batteries. Batteries can recover themselves if you let them rest for a while, so it’s simple. You buy a lot of batteries, you let some of them do work and you let some of them recover energy, then you switch them to get the work forever. Very simple.
2, the real deal here is a over-unity which is the input greater than the out put. We can tell you guys, there’re some cases in human history where we’ve achieved that, the nuclear bombs have done that many times and the nuclear generator factory. But that is impossible to use at home, right? and it needs tremendous investment why we call that there’s no “free” energy, you must invest it from the first place.
3, so how to get an over-unity machine, we point out the philosophy way of approaching saving energy to get there. We’re neither physicists nor scientists, what we’re talking about here is a “philosophy”.
BUT WE REALLY SUGGET physicists and scientists look at this to think about your understanding of energy and try to break your prisons.
what is “ENERGY”?
1) energy has two elements binding forever, cycle and force, or voltage and current, or electron spin positive and negative, magnetic flux flow clock wise or counter clock wise, and so on…… fundamentally 1 unit energy is a electron pairs.
2) Numerous electrons pairs are full of our universe to resonance together.
3) there's no time. so there’s no speed. speed is a movement distance where is measured by solar cycle. For example, 1 year= 12 months, 1 day= 24 hours, those are all solar cycles. For example 1 light year is a distance.
4) the energy cycle can’t be cut. if you cut cycle then the force is growth to maintain the energy.
5) energy has many transforms, like mechanic( inertial), electricity, magnetic… but they’re the same thing. they just have different cycles and forces.
so the way to get an over-unity, you have to make them “jump”……
4, think about the nuclear power. Einstein make atoms jump from a mechanic cycle into an sub-atom cycle, by squeezing uranium together with heat. Heat is a cycle too, a wave length. The force has become huge to separate particles, to trigger a chain reaction. So if you can make a machine to jump through into smaller cycles, but bigger than the nuclear cycle, then you should’ve had real over-unity already.
5, to be clear, for making that machine, you have to invest hardwares. Nothing is free, the mistakes of many people have made are:
1) i don’t know why, but it run faster at short circuit. ( it’s a saving not an adding)
2) i can’t explain where is this energy comes from but it’s working. ( you have a leak point in your system, the universe is balancing, no investment no energy)
3) i want to charge a big battery to drive my car ( please easy, first you make a self runner)
6, some people have made a self runner but they’re too eager for output. In fact, if you loop back the energy then you should’ve observed the input energy has been reduced significantly.
7, in fact our generators and motors, most of them have only 50% efficiency or lower.
7, if we have a machine can save more than 50% energy, that has a little bit higher efficiencies than most of machines. Then there maybe, maybe a way.......

Commodities - a continued bearish outlookI posted a chart on commodities back in 2018 that has come to pass but I now think the bottom may be even lower than I thought back then. These 3 Fibonacci measurements could suggest an area of confluence to me with the 5th wave of a C wave extending into a final low.....


Commodities - building a base, preparing for blast off?I posted a really bearish chart on commodities back in 2018 but this chart, while still eventually bearish in outlook, suggests that we might see some strength in commodities at least in the medium term. I have included a very bullish blue count that goes one step further in suggesting that commodities may have in fact bottomed.


Commodities are Getting Ready to POP!!Gold typically leads commodities by a few months and so given the surges and breakouts in gold, silver, and platinum, I think the CRB index is next.
Looking at the chart, its clear this is a chart that has been gradually shifting in trends. In my opinion, most of the heavy selling is over. CRB index has been forming a sexy looking base and looks like it could begin surging. Timing wise, this coincides perfectly with the Fed & central banks globally beginning new easing cycles. Its still early, as the breakout has not started, but its looking ready to get its first real pop sooner rather than later. In my view the CRB index presents tremendous value over the next several years, especially now at these ridiculously suppressed prices.

Commodities rolling over (but likely not yet) to the downsideBuilding on The_Unwind 's post about commodities .
I agree commodities are on the way down to new lows (and multi-year bottom). It is a deflationary cycle, interest rates is the most obvious proof that we live in a deflationary environment. Having extremely low or negative interest rates simply means that fewer and fewer people/businesses take credit (the price of money deflates) or the supply of money exceeds the demand for it. Either way, it means trouble for commodities that thrive in the inflationary environment and for stocks eventually.
Having agreed to the big picture my Elliottwave count suggests that before we go onto a death spiral with oil testing 25-20 and stock market crush at least 30% we might have one final rip upwards which will unsettle bears and make everyone talk bullish nonsense again. Elliottwave.com says 'waves E are attended by psychology as emotional as that of a fifth wave'.
I might be wrong. I base my judgement on the gut feeling that the structure does not look complete. Those 3-3-3 moves come in 5-waves pack (ABCDE or WYXZ) at least. Final wave E may not travel all the way up as indicated on the chart. It sometimes ends below the previous high (wave C).
As for fundamentals.. well it might be anything. The Fed may suddenly drop comments that they will do an emergency, earlier cut. Or they cut more than expected. Or Trump tweets something about alignment with the Fed to act aggressively or any similar short-term hype. The irony is that the news will be deflationary by nature (increasing money supply when nobody needs it) but people will talk about the money flood which is supposed to raise prices and the powerfull Fed saving the economy.

CRB Index Down 50 %,.. Lead By Oil,.Continues To PlungeThe CRB Index of Major Commodities TRJEFFCRB ,
is breaking down once again, in a potential Head and Shoulder's Reversal Pattern
down to extremely important major support.
As seen here on the Monthly CRB Chart,
commodity prices as measured by the CRB Index are down a whopping 50 %,..,since 2011 !
With most market observer's looking to the plunge in interest rates,
as the major factor or potential cause for an upcoming worldwide economic slowdown,
the sharp decline in commodity prices going on 8 years now,lead by energy and industrial metals weakness like copper,
have long been foreshadowing an economic day of reckoning on the horizon,
The message here is to pay attention to the CRB Index of major commodity prices daily,
for clues about the health of the overall economy.
Right now, commodities are telling you the same story,
of strong pending weakness from the demand side,
just as long term interest rates are flashing the same confirming message.
Concluding thought.
I wonder how much longer,it will take for the stock market,
to heed the same ominous warning signs that are out there ..?
THE_UNWIND
8/17/19
NEW YORK


Late Cycle 101 (Comes down to Q2/Q3 Corp Profits) Late Cycle indicators. Watch for yield curve steepening. As Druckmiller says, a recession can not be official without a corporate profit recession which leads to significant repricing of equity. It appears we are at the inflection point of another 2016 or repeat of 2000, 2007...Q2/Q3 is the do or die. If we get through without negative YOY earnings , it could be another 2016. This will be a big quarter for the market to determine if bond holders or equity bulls have it right. Without a system shock event, corp profits is the only thing that can cause an official recession. Otherwise its just a massive slowdown and Q4 2018 could have been the final act before spreads steepen.


Commodities vs S&P500 like Growth and Value stocks are cyclicalsCommodities index vs S&P500 like Growth and Value stocks are cyclicals ... alternating between economic cycles.


Re-Visiting Oil, the CRB Index and the FEDFundamental:
Today is December 18, 2018. The US Fed meets on Wednesday, December 19, 2018.
Not much to say; just watch and wait.
Technical:
I am neutral this CRB Index.
With oil oversold and the CRB Index oversold, it won't be a surprise if after the US Fed meets this week, we get some type of risk on sentiment flowing back into the markets.
I watch this drop and remain neutral until evidence shows up that this is going green.
Besides this, it still can go awry with a continued slide. I am open-minded to anything; however, at this point, I refrain from jumping in short with everyone else.
The same can be said above USOil itself on a monthly basis:


Commodities - very bearish countFor me, one of the difficulties with any attempts at technical analysis is factoring in your mood when looking at a chart. Bad mood = bearish count, good mood = bullish count. I guess I woke up a bit grumpy this morning as this count for commodities is about as bearish as they come. If, and that really is a big if, this count has any merits does it also mean that we are eventually going to see further US dollar strength going forward?

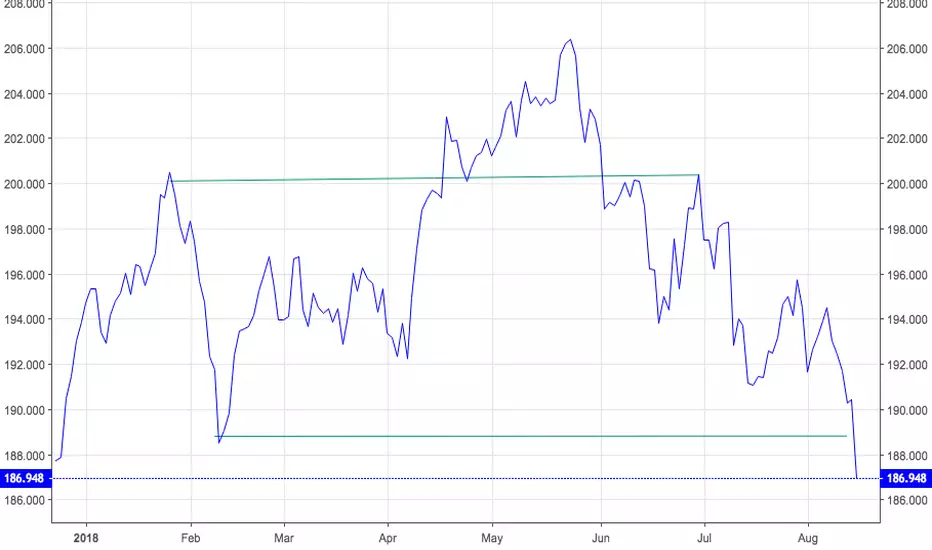
CRB INDEX @ Monthly SupportA weekly chart informed from a monthly chart's support and resistance. As you can see from here, the CRB index fell from the monthly resistance above after forming a new high breaking resistance (also a yearly autp pivot point). It pulled back to the 38% level, which is also a weekly support level.

CRB Commodity Index 2018 Head and Shouder's Reversal CRB Commodity Index on 8/15/18 broke down from a 2018 Head And Shoulder's Pattern,
a reversal of fortune, the implications of which seem to imply that inflationary pressures may have reached a peak
for the year, and with that, a slowdown in world economic growth, foreshadowed by the recent decline in world stock indices,
and US interest rates.
THE_UNWIND