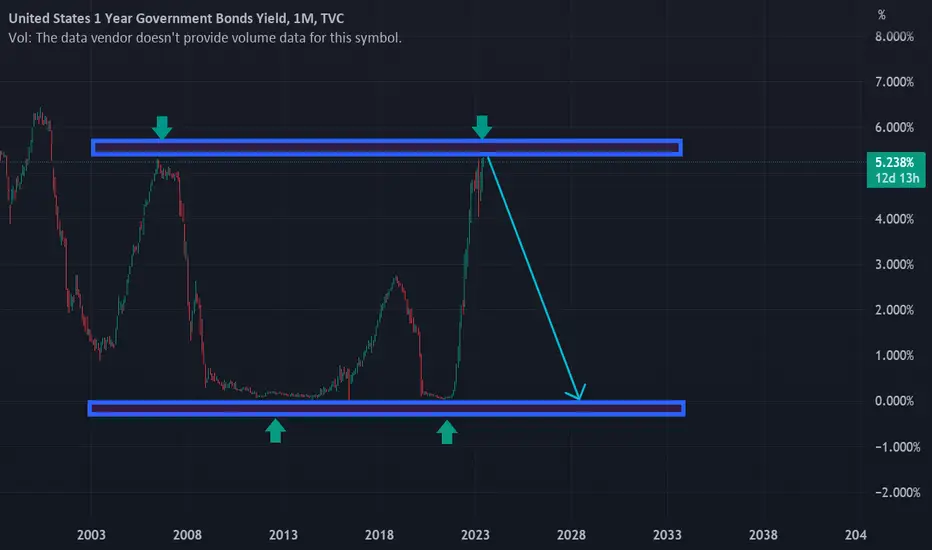
How US01Y may relate to stock crashesUsing the 200 Week Moving Average,
we spot that stock crashes often relate with drop in short term bond yields.
Prior to 2008, yield rates usually drop by a few percents by hardly below 0.5%.
However since QE in 2008, bond yield decrease to a nearly 0% level.
These features allow us to spot these financial crisis on the graph easily.
However, whether if this indicator is leading indicator or lagging indicator requires future research.
US01Y trade ideas

1 year T bill yield on Fed DayJust a quick visual of the yield chart for the 1-year Treasury Bill.
Disclosure: Not a recommendation to buy or sell securities.

1 year yields matterA break lower in 1 year yields will confirm that a recession has arrived. Stock market should follow lower until the FED drastically cuts rate, & then markets will recover. Same playbook for the last 100 years. This time ain't different

US01Y Treasury Head and ShouldersBeen watching the US01Y treasury as its chart patterns certainly are just as valid as normal stocks, but it really reflects the basis of the whole US economy being highly correlated to the fed interest rate.
Right now we have a very well-defined head and shoulders pattern after quite the straight line up from near-zero from the covid era.
The action this week in particular is interesting, in that it may be starting to reveal an initial tipping point.
Up until this week, I wasn't sure if it was going to be a head-and-shoulders fakeout leading to a continued uptrend in rates, but this looks more like the possible beginning of a new trend back down, **if this decline continues over the next few weeks...**
The 200-week SMA on the left screen would be a likely target, so somewhere between 2.5% - 3%...
Let's see!

Long term perspectiveThe short term pull back can be an effect due to the upcoming interest rate this upcoming june, and this pull back is a good sign of buying opportunity for long-term.
The key point in here is that the bond is set to move downward means the dollar might also fall and so the stocks will do the opposite direction.
Dollar cost averaging I believe is the best strategy for now due to uncertainty of when will the market executw the direction that we are eyeing.
This is a pov, an speculation, invest at your own risk.

1 YR US BILLS - WEEKLYSeeing a weekly momentum shift forming, expect major trend change.
Couple of scenarios, Economy could break and fed allows inflation to creep up while easing on rates, If they reduce reverse repo rates then yields will drop as money market funds buy 1 yr bills on the open market again.
Otherwise they might have to increase rates if inflation continues to weigh heavily on the economy with prices shooting up too fast.
1D
1W

1yr vs 3 month yieldMarket priced in rate cuts for later this year based on the December Dot Plot, but you can see that the market has started to price that back out because of CPI and PPI numbers. PCE release on Feb 29th, and Fed meeting in March with a new Dot Plot.
The Fed once again f'ed up by showing rate cuts in their Dot Plot, we'll see if they screw up again. Appears that Powell isn't the only village idiot, he's got company there at the Fed, lol. There gonna figure out that they can't SCHEDULE a rate cut, it should only happen when necessary.
This is how rebound inflation happens, the Fed did it with their Dot Plot. Morons. The incompetence is staggering.

RatesJust an image I use to see where we are relative to history. Well the market is leaning so far towards easing that market rates (defined here as an average of 1,2,3 years are trading at historic discounts to the fed funds rate. Core and measured CPI there for you too. Enjoy, AMK

I am BEARISH BONDS NOW The chart posted is the 1yr Tbill rate we seem to have a LOW in place This should be clear over the next 10 TD

Us rates going down?As many of you know.. I'm not fan of making small chart analysis but due to data ive got i will be updating .. for moment and as much of pressure from infaltion has cooled down... we can clearly see a rate cuts in near future... plus.. next year is Us election.. so fed is under heavy pressure now.

US 1 YEAR NOTE ANALYSISThe yields on the short term Treasury Bills have been on the rise since the FOMC started hiking the Dollar interest rates in March 2022. Earlier this week, the FOMC maintained the interest rates at 5.25% for the first time. This marks the beginning of the end of the current economic cycle. The yields are now at previous resistance from the 2007/2008 highs. If the FOMC Pivots at 5.25%, the short term Treasury yields will fall.
Bond yields divergingThis chart shows that 1 year yields are diverging in trend direction away from longer term yields. I don't know what this means but it looks very odd indeed. Markets appear to be betting that deflation is on the way.


Us rates trend down Us short term rates are heading lower and markets are telling you that. Follow the trend

1 2 & 10 Year yield seem to be toppish short term, $VIX in range🚨#yields look to be topping🚨
Things are FALLING into place!
Been posting on $DJI & $BTC RANGES
Risk reward was great late last week & on this dip (focusing on DOW JONES ATM)
$VIX staying 18-23 is ok
Adding more $ on dips
#stocks #crypto

Weekly U.S. Treasuries Analysis (Week 07/2023)First Thing First: This analysis is for “general overview only” as it is solely based on price action. That’s why it is called momentum analysis in the first place. Support/Resistant, Volume Macro view nor any other factors are not used during write up. Refer to the individual pair analysis for a more comprehensive write up.
US1Y: Bullish
US2Y: Bullish
US5Y: Bullish
US10Y: Bullish
US30Y: Bullish
S&P Index: Bearish
WK 07 (11 Feb 2023)

This data is wrongThe US 1 year chart is wrong. It didn't drop by 99%. Someone from Trading View must fix this before they cause a panic. Thanks.

US01Y just diedPublishing this just so you are aware.
Ofcourse must be some kind of bug, right ?
..RIGHT?


This is very frightening and doesn't look good, 1 Year TresurysThis is very frightening and doesn't look good, 1 Year Treasury yield dropping to 0.03%???? Is this the capitulation moment we've been waiting for? Sound the alarm!

Huge Recession WarningWith the 2022 recession ever coming closer, more hints that it’s nearing appear. One of those hints include this graph, which shows the 1 year bond surpassing the 4% mark, and it’s more than any other bond. For the first time in more than 15 years, the 1 year bond surpasses 4%. The yield curve has been inverted for more than 1 month, and it’s still inverted. At any point Black Monday can happen and crash the market. I believe the recession that is about to happen will be worse than even the 2008 recession. It’s more of a depression, not a recession. The 1 year bond didn’t reach as high back then before the recession.
TVC:US01Y
SP:SPX


5 Years of the Yield Curve
2018 - Flattening curve throughout the year with some slight inversion towards the end.
2019 - Complete inversion early in the year lasting awhile. Entire curve beginning to fall.
2020 - COVID Fed response slams the short end to the ground with the longer end having a pretty muted reaction.
2021 - Curve starts to stretch with short rates being extremely low and long rates showing pretty strong upside.
2021 - So far, the short rates have become unhooked from the 0 line and launched towards long rates. The curve has inverted again and there are no signs of slowing on the short end.
