US02Y trade ideas


Comparing US02Y vs US10YBy decrementing US10Y from US02Y we see the actual breakout so to speak.
Volatile. Already touched the previous Global Resistance with a huge spike and most likely next 2 to 3 years are going to be volatile as well coming to an end around Nov 2021 - the point that looks pretty similar to what we already saw in 1991 | 2001 | 2008 and notice since 2008 the move down wasn't that significant comparing to the previous two(1991-1993 and 2001-2003) thank's to US QE I guess? We might actually end this trend or maybe just maybe from 2021 to 2023 going below the ZERO which you can comment the possibility of that happens and how do you prepare yourself ;-)
According to this time analysis in Nov 2021 "the disaster" is going to be at the peak.


US02Y: BUY or SELL?12 years of doubts before the actual recession
OR
12 years that the trend is going to change?

Treasure Bonds Indicators don´t look goodA quick review on indicators specifically, 21-49 EMAs on RSI show a significantbear cross following the same behavior dron 2001 and 2008 recessions, get ready for an important correction on the stock market as I announced days ago.


No Rate Cut, Higher Rates, Stock Market Up?I believe stock markets worldwide will continue its bull run despite past indicators like the yield curve inversion signaling a bear market/recession. We are entering a new era of time.


Rate cut on PointFED with no other choice but to cut rates as predicted a few weeks ago. This was no coincidence and perfectly plays into the recession scenario.
Cutting rates with the fully loaded balance sheet is a very precarious task and markets are bound to become increasingly unstable Because of the insanely high uncertainty when it comes to monetary policy.
Long on bonds with tanking yields, Short global markets

interest rate bounce off the zero line or enter below zone and gold rockets up?? something to watch for

3.015 is the only level in play for 2 year yields...It is very clear from the monthly chart here that this has been an uptrend for some time now. The 2 year yields have started to see some widely anticipated profit taking just shy of the 2.618 extended target for the 3rd wave.
The market has since retraced and held the 23.6% in a corrective 4th wave process.
Time to start paying attention to yields again for 2019.

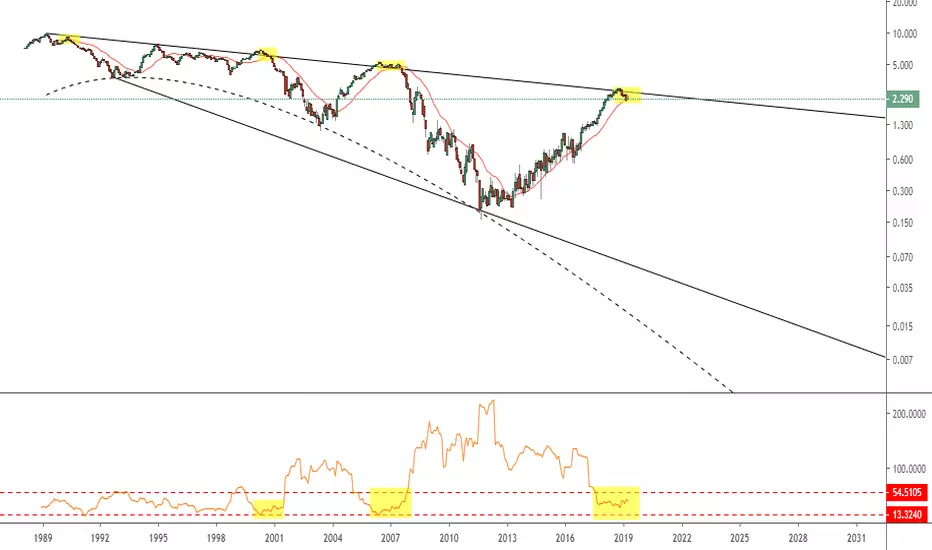
US02Y 2 Year Yield - History Repeats Itself2YY is falling after a retest of the multi-decade trend. This will be the fourth time in history.
These are followed by a major bear market and recession.

expecting fed to reduce ratesInversion on the yield curve is making markets very uneasy and for good reason. Now the fed is stuck between to evils. Raising rates to reduce the balance sheet in order to be prepared for the inevitable recession (lets be honest, its too late for that now), OR reduce rates to at least flatten the yield curve. This would show in the yield of the 2 year and 3 month treasury being reduced to 2.4% and below.
This is exactly what they wanted to avoid but thats the price the FED pays for letting the market dictate monetary policy when they should've been raising rates long ago.
Expecting short term rates to fall shortly. There is not much that can be done now but brace because there is a decade worth of a shitstorm about to be unleashed in the form of credit and corporate debt and capitulation.
Long on the vix is a great way to protect assets if you are looking for a hedge.

Monetary easing is expected...USO2Y 2-Year US Treasury Bonds Predicting Interest Rate. If the graph analysis is correct. We can see a nearly 1% downward trend in interest rates this year. Monetary easing is expected.


$USDJPY Is Savaged, Hammered Over 3%FX turmoil early in the evening session with the AUDUSD falling to .6750, USDJPY falling through 105 and USDTRY blasting through 5.6.
EURUSD and GBPUSD are taking some heat, too, in what is being explained as carry trades being unwound as market participants are finally getting the gist: growth and inflation are slowing.
In my previous post, my intermediate TACVOL range was114.44/108.30. Price action had been unable to break above the range top, and now completely falling through the bottom. I would like this move play out before jumping in.
However, if you've read my work, I been trying to prepare readers for the epic shift.
If we look towards US/Japan rate differentials, USDJPY is suggesting US yields have much more to fall.
This was the largest rate of change move since 2017.
Current TACVOL range 115.54/108.87; -2.81 score suggesting a pull back is in order at least near-term.


US02Y/US05Y RATIO INDEXThis ratio shows us that we are in a beginning period for going below 1, in that case this is the first signal, and is the following one US02Y/US10Y will go in the same direction, recession will begin.
thank for this last one
