2 Year yields are weakeningWhich often signals a incoming recession.
The market leads the #FED who always raise and lower rates too late.
We have #Unemployment starting to tick up
Tight financial conditions, delinquencies on the rise.
So make hay over the next few months in memestocks, coins, bitcoin, alts, NVDA and so on.
But don't be left holding the hot potato when the music stops playings.
#Macro
#Meltup
#NVDA
#Nasdaq
#Stocks
#Bitcoin
#Altcoins
#Ethereum
#Pulsechain
US02Y trade ideas

2 Year US Treasury Yield going down2 Year US Treasury Yield going down.
2 Year US Treasury Yield is always the first one to go down, few months before the Federal Reserve starts cutting rates.
Hold 2 Year US Treasuries to capitalize on it. (Yield down, Bond price up)

T-notes Interest rate vs its future pricingIt's Inverse relation. An increasing interest rate will drive down the future's price.

$US02Y $US10Y $GLD $IVOL $TLT - The Chart tells the futureHere we have a historical chart showing what will likely be obvious in 2 quarters. The chart bats 100% on the issue but not on the resolution. As you can see with LTCM and the Bhat crisis in the late 90s. This chart is great for signaling when to risk-off, it does not signal risk on, for that I use the CBOE:BXY . The way I play the waiting game after going risk off is exposure to AMEX:IVOL NASDAQ:IEF AMEX:GLD NASDAQ:TLT AMEX:UUP
Cheers,

We are close folks. 2 year bond market close to shift to a downtrend that could be trigger a major correction on spy . Recession time ahead folks


Can higher projected US02Y impact GOLD price ?TVC:US02Y has been trading to attractive levels fibonacci levels of 50% resulting in formation of bullish flag. Price is projected to go to 5.5% according to flag pattern. Recent NFP had higher than expected unemployment claims. Will this scenario attract investors to buy more bongs ?
What do you think will be impact of bullish bonds yield to the price of GOLD ?

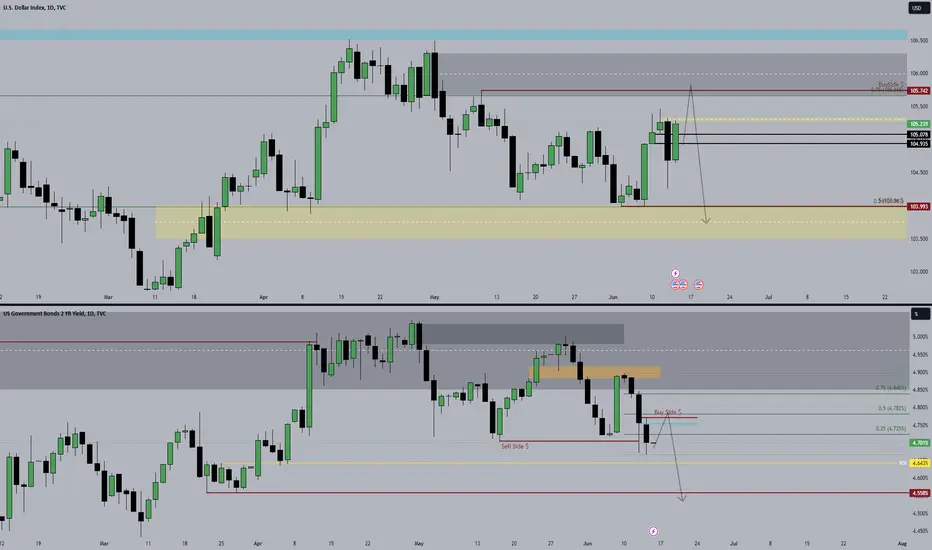
*SMC* DXY correlated with US02Y Bonds As we can see on the daily tf, DXY has created Relative Equal High at 105.459 which translate to this level being a liquidity pool. We are likely to see 105.459 being taken out put where can it go? As we can see, above 105.459, the closer PDArray is the OrderBlock (made the 30 Apr) which confluate with the 75% of the Dealing Range and another buyside liquidity pool at 105.742. I dont expect DXY to trade above the mean threshold of the OrderBlock and if it touched I expect a strong reaction to the downside.
Concerning the 02 year Bonds , the body has respected the OrderBlock (30 Apr) creating relative equal low which has been taken out (june 12). There is a ''crack'' in correlation right now between the DXY and the major Bonds of the US which leads me to think that there is a higher probability for the DXY to follow the Bound and drop lower.
Fundamentally, Powell has been pointing out the progress that has been made (which could eventually lead to a cut of rates) However, the ''Dot Plot' ' surprised the market of a likely to only 1 cut this year instead of 2-3 rate cut priced-in, which could be the reason why DXY has been going higher the last couple of days.
Yields are still selling off after yesterday's dropLet's see how the TVC:VIX does over the next few days/weeks.
Still think it eventually breaks its major support level, at least temporarily.
The 2Yr and 10Yr are crashing and following yesterdays drop. TVC:TNX
#interestrates, as we said, will likely be cut, even if a little. They will most likely be raised again next year. Not political...
Anyway, since we have stated COUNTLESS times. They CANNOT lower rates but MUST lower them.

2Y yield - 45 degrees, break-outs and break-downs. Using 45 degree angles for 2Y yield (or inflation barometer) and stock market (faang). Pretty useful.
Bolts show where break downs of inflation are and where inflation is rising.
45 degrees show the strongest trend. You dont even need to use RSI. all must equal

Bond Yields about to crater?GOOD MORNING!
The 2Yr & 10Yr have broken the triangle pattern we posted on long ago.
The TVC:TNX (10Yr) has gone lower compared to the 2Yr in the same time frame.
Again, natural normalization is still out the window! What does this point to?
Will fed do what they are good at & mess it up again?
---
Now look @ the 10Yr on a weekly chart!
AH HA! Are Bond #yields about to crater???

Stock Market Going DownStock Market is going down...
2 Year treasury is heading down
Nonfarm Payrolls are heading down
Unemployment rate is heading up
SPY looks like it's topping out
NASDAQ:TLT AMEX:TMF

Yields - Bullish - First Week of June 2024smt at lows + respect of bullish fair value. Anticipating completion of MMBM

2YR yield in Ascending triangle formationNext Breakout in July around FOMC Meeting, if Fed cuts then yields expected to fall and breakout below 4.7% support level. Long USD Bonds would be preferred direction.

We have a Grey Rhino here - Markets are driven by ignoranceThe US long-term bonds have hit new lows, the yield curve has been inverted for two years now, and inflation remains uncertain, meaning interest rates may not ease at all. Yet, stock markets are reaching new highs.
We have a "grey rhino" in this market. A grey rhino is a large and visible animal that cannot be ignored. Try not to get too close to them because when they start charging, we can never outrun them.
In this market context, we face a big, obvious problem that investors completely ignore until it becomes a crisis. It's different from a "black swan," which is a rare and unpredictable event.
When we recognize that there are problems many do not understand, we have already won half the battle.
U.S. Treasury Bonds Futures & Options
Ticker: ZB
Minimum fluctuation:
1/32 of one point (0.03125) = $31.25
2-Year Yield Futures
Ticker: 2YY
Minimum fluctuation:
0.001 Index points (1/10th basis point per annum) = $1.00
Disclaimer:
• What presented here is not a recommendation, please consult your licensed broker.
• Our mission is to create lateral thinking skills for every investor and trader, knowing when to take a calculated risk with market uncertainty and a bolder risk when opportunity arises.
CME Real-time Market Data help identify trading set-ups in real-time and express my market views. If you have futures in your trading portfolio, you can check out on CME Group data plans available that suit your trading needs www.tradingview.com

US two-year yields climbed four basis points to 4.87%.The latest minutes had more hawkish undertones than the market was expecting.
"Participants at the meeting assessed it would take longer than previously anticipated to gain greater confidence in inflation moving sustainably to 2%."
"Various participants mentioned willingness to tighten policy further should risks to outlook materialize and make such action appropriate."
Though it largely repeated rhetoric used by FOMC officials after the latest policy meeting, US stocks still weakened while the dollar and Government bond yields strengthened
It is unlikely to make a material difference to the long term outlook for US policy, as is reflected by little change in US interest rate futures.
The Hawkish undertones can be justified given the lack of the April CPI data before the minutes were recorded.
The stock market fell during regular trading hours as the most recent Federal Reserve minutes indicated that officials are not in a hurry to lower interest rates. After fighting for direction for most of the session, the S&P 500 fell sharply as several Fed officials expressed concern about the extent to which policy is constraining the economy - but the minutes also indicated policy "was regarded as restrictive. Treasuries were under pressure, with shorter maturities underperforming.
US two-year yields climbed four basis points to 4.87%. The dollar rose, weakening the appeal of commodities priced in the currency.

The INFAMOUS Blow Off Top!!! US10Y US02Y $TLTThe indicators from this chart which backtested to call the 1990s Gulf War recession, the Thai Baht, the 1998 LTCM, the 2000 dotcom bubble, the great financial crisis, and the COVID pandemic all before they officially happened. It is calling for whatever this next crisis is going to be called. I placed MOAB or mother of all speculative bubbles for the crisis holding name. I am sure the talking heads on TV who never saw this coming will give their two cents about how great everything is. Clearly, we have issues in society and those issues are being pasted over on the market with money printing.
This isn't doom-bear BS, it's just an indicator that has front-run every single one of these black-swan events.
The best way to play this is to reduce broad market exposure and sell into the big up days. Look at defensive plays like bonds, gold, and US dollars. Now that doesn't mean you can't stay net long, for that consider option spreads, but this tells you to clearly lower your exposure.
NASDAQ:TLT AMEX:GLD TVC:GOLD NASDAQ:IEF AMEX:SPY NASDAQ:QQQ

US02Y Next Move The matter still requires deeper analysis, despite the absence of wide-ranging movement today. The recent decline in bonds did not help boost gold prices. The yield on the two-year US bond is currently at a support level of about 4.8% on the one-dimensional chart and may look to rise. If the Federal Reserve maintains a tight policy, gold may struggle to rise. However, if we begin to receive signals indicating that the Federal Reserve may wish to continue lowering interest rates this year, gold may be more optimistic.
We should monitor the level of two-year and ten-year bonds, the direction of the dollar index, and geopolitical aspects to be clear about the direction of gold.

When the 2s/10s Chart Goes Red The Market is Dead $US02Y $US10YAs you can see there is a strong correlation between this predictive chart algo and the bond market steepening predicting the recession before the reason why. Now maybe this time is different. Maybe the massive stimulus during covid will give a false positive here. I just doubt it.

US RATES 2YEARS YIELD TREND UPUs rates is in up pressure... for moment its upward in direction to higher rates not down.... lets wait next weeks!

U.S Yields vs. Alternative stocks #Tesla #VWS #ORSTEDHigh U.S. Yields vs. Alternative stocks such as NASDAQ:TSLA #Tesla OMXCOP:VWS #Vestas OMXCOP:ORSTED #Ørsted OMXSTO:PCELL #Powercell.
Thesis is yields down, alternatives up.

Nasdaq, Semiconductors, Natural Gas, Bitcoin: FOMC reviewDiscussing the sell off in semis today.
Potential reversal in Nat gas
Bitcoin & crypto selloff.
FOMC tomorrow: No rate cut.
Will Powell come out hawkish tomorrow? its looking likely he will based off of the BOJ rate hike. Oil surging doesn't help the dovish case.
Commodities breaking out doesn't help the inflation fight.

US02Y/US10Y - Market tops happen when chart is going downHow long do we have before the next crash?
How many months until we've reached the market top? Hopefully not yet!
My estimate is a top in June 2024, when the FED starts cutting rates.
