Comparison of 3M to 30Y US Bond YieldsComparison of 3M to 30Y US Bond Yields. Monitoring bond yields to see if any spike in yields will reveal any systemic issue in the markets.
US03MY trade ideas

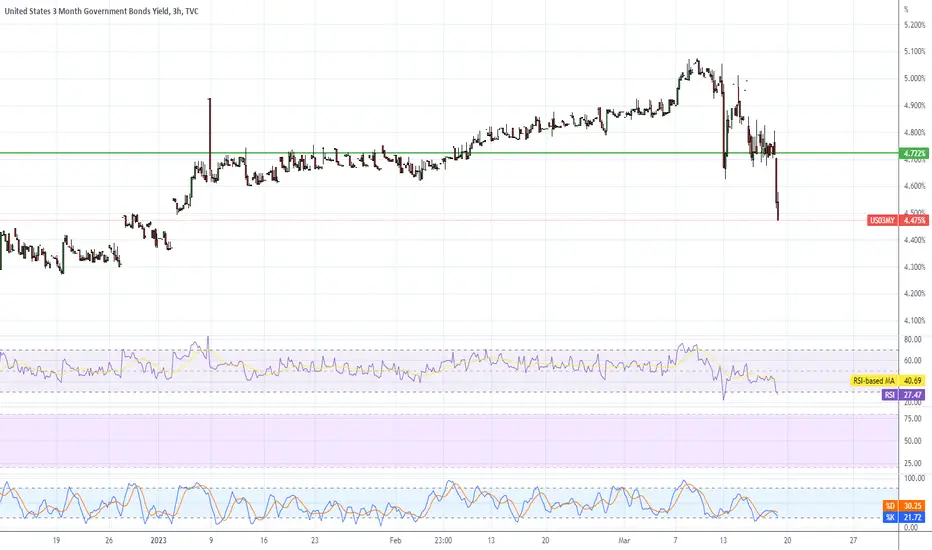
US 3mo as short term Leading Indicator?As I continue to watch bond markets and the 3 month specifically I have noticed a pattern for short term bullish confluence with SPY.
I have highlighted (with the light purple dots) the pops in the daily 3mo chart that occur after at least a five day downward yield slide. Above the 3mo candles is a snip of the SPY chart that corresponds with the initial 3mo daily pop. The text in green notes the percentages over the following 7 and 13 trading days. A couple of the SPY snips actually fell off on the 14th day after the initial pop so that is where I am capping the potential gains going forward. Please also note that the Dec 4th pop resulted in a loss in SPY for both the 7 and 13 trading days afterwards.
The SPY fractal that starts from today’s 3mo pop (Tues Dec 31) is essentially a copy of SPY action from mid-Nov to mid-Dec 2024. If it were to play out we would be at or slightly above all time highs going into the Jan 20th US inauguration and then flat into Jan 29 FOMC. FYI…the daily sideways scale of the SPY snips does not align perfectly with 3mo daily candles. I did try to line up the starting day for each though.
There are of course 3mo auctions 4 times a month on avg. (large snip left lower on chart) so take this info as you will. I am only noting what I see as a pattern of a pop in yield following a significant decline in yield and the corresponding SPY price action in the following week or two. One could easily argue that the santa rally is not here this year…and the glaring head and shoulders on the SPY daily chart warrants more downside. I am choosing to remain cautiously optimistic with the bond information in conjunction with my overall thesis leading into Q1 of 2025.
I believe the bond markets close at 2pm today, so assuming todays 3mo candle remains a green pop I offer this thesis as a possibility.
Thanks and take care. Happy New Year all.
MR

US Dollar Short: Crash comingBased on my updated Elliott Wave counts, USD is currently in a wave 3 down. I analyze this based on DXY, EUR/USD, USD/JPY, and USDSGD. Additionally, I also discussed the Fed rate cut. Instead of 25 basis points, the Fed might even cut 50 basis points.

Bond Market Corrections Become Faster and Faster Every Cyclegrok please find the next number in the sequence 903 511 315 = 215
215 days from the time the US03Y crosses below the 52wk moving average from when the 30 year bond bottoms. If this correction is to the same magnitude of previous correction the US30Y could fall by another 47% from current levels to 2.8%, or it could fall even further to 0.28%

US 3-month bond yield - a recession signal?The US 3-month bond yield looks like it's rolling over. In recent history this has sometimes been a signal of an incoming recession.

Market topping or not stopping?? Little bit of Macro1. Stocks are fundamentally overvalued.
2. The macro (yield curve and unemployment rate) I'm monitoring is at its peak/low and could be at potential turning point.
3. We need technical analysis to enter this trade and time the short if there is any at all.
These are some extremes I'm looking for that can either enrich you if you're right or make you poor if you lack risk managment skills.
I'm talking Michael Burry 2008 trade if history repeats itself.

US03MInteresting how the market goes up and the 3-month yield goes down, is anyone afraid???
All short-term MAs are in downtrend...

2024 US Recession | Key Factors2000 DOT-COM CRISIS
The dot-com crisis, also known as the "dot-com bubble" or "dot-com crash," was a period of economic turbulence that affected the technology and telecommunications sectors in the late 1990s and early 2000s. Here are some key points:
Euphoria Phase: In the 1990s, there was a boom in the technology and dot-com industry fueled by irrational investor euphoria. Many companies secured significant funding, even if they had weak or nonexistent business models.
Excessive Valuations: Valuations of technology companies skyrocketed, often based on exaggerated growth projections and unrealistic expectations. This led to rampant speculation in financial markets.
Bubble and Collapse: In 2000, the dot-com bubble began to burst. Many investors realized that numerous technology companies were unable to generate profits in the short term. This triggered a massive sell-off of stocks and a collapse in tech stock prices.
Economic Impacts: The crisis had widespread economic impacts, with the loss of value in many technology stocks and the bankruptcy of numerous companies. Investors suffered heavy losses, and this had repercussions on the entire stock market.
Economic Lessons: The dot-com crisis led to a reassessment of investment practices and taught lessons about the importance of carefully analyzing companies' fundamentals and avoiding investments based solely on speculative expectations.
Following this crisis, the technology sector experienced a correction but also contributed to shaping the industry in a more sustainable way. Many companies that survived the crisis implemented more realistic and sustainable strategies, contributing to the subsequent growth and development of the technology sector.
2007-2008 FINANCIAL CRISIS
The 2007-2008 financial crisis was a widespread event that had a significant impact on the global economy. Here are some key points:
Origins in the Subprime Mortgage Crisis: The crisis originated in the U.S. real estate sector, particularly in subprime mortgages (high-risk). An increase in mortgage defaults led to severe losses for financial institutions holding securities tied to these loans.
Spread of Financial Problems: Losses in the mortgage sector spread globally, involving international financial institutions. Lack of transparency in complex financial products contributed to the crisis's diffusion.
Bank Failures and Government Bailouts: Several major financial institutions either failed or were on the brink of failure. Government interventions, including bailouts and nationalizations, were necessary to prevent the collapse of the financial system.
Stock Market Crashes: Global stock markets experienced significant crashes. Investors lost confidence in financial institutions, leading to a flight from risk and an economic contraction.
Impact on the Real Economy: The financial crisis directly impacted the real economy. The ensuing global recession resulted in the loss of millions of jobs, decreased industrial production, and a contraction in consumer spending.
Financial Sector Reforms: The crisis prompted a reevaluation of financial regulations. In response, many nations implemented reforms to enhance financial oversight and mitigate systemic risks.
Lessons Learned: The financial crisis underscored the need for more effective risk management, increased transparency in financial markets, and better monitoring of financial institutions.
The 2007-2008 financial crisis had a lasting impact on the approach to economic and financial policies, leading to greater awareness of systemic risks and the adoption of measures to prevent future crises.
2019 PRE COVID
In 2019, I closely observed a significant event in the financial markets: the inversion of the yield curve, with 3-month yields surpassing those at 2, 5, and 10 years. This phenomenon, known as an inverted yield curve, is generally considered an advanced signal of a potential economic recession and has often been linked to various financial crises in the past. The inversion of the yield curve occurred when short-term government bond yields, such as those at 3 months, exceeded those at long-term, like 2, 5, and 10 years. This situation raised concerns among investors and analysts, as historically, similar inversions have been followed by periods of economic contraction. Subsequently, in 2020, the COVID-19 pandemic occurred, originating in late 2019 in the city of Wuhan, Hubei province, China. The virus was identified as a new strain of coronavirus, known as SARS-CoV-2. The global spread of the virus was rapid throughout 2020, causing a worldwide pandemic. Countries worldwide implemented lockdown and social distancing measures to contain the virus's spread. The economic impact of the pandemic was significant globally, with sectors such as tourism, aviation, and hospitality particularly affected, leading to business closures and job losses. Efforts to develop a vaccine for COVID-19 were intense, and in 2020, several vaccines were approved, contributing to efforts to contain the virus's spread. In 2021, the Delta variant of the virus emerged as a highly transmissible variant, leading to new increases in cases in many regions worldwide. Subsequent variants continued to impact pandemic management. Government and health authorities' responses varied from country to country, with measures ranging from lockdowns and mass vaccinations to specific crisis management strategies. The pandemic highlighted the need for international cooperation, robust healthcare systems, and global preparedness to address future pandemics. In summary, the observation of the yield curve inversion in 2019 served as a predictive element, suggesting imminent economic challenges, and the subsequent pandemic confirmed the complexity and interconnectedness of factors influencing global economic health.
2024 Outlook
The outlook for 2024 presents significant economic challenges, outlined by a series of critical indicators. At the core of these dynamics are the interest rates, which have reached exceptionally high levels, fueling an atmosphere of uncertainty and impacting access to credit and spending by businesses and consumers. One of the primary concerns is the inversion of the yield curve, manifested between July and September 2022. This phenomenon, often associated with periods of economic recession, has heightened alarm about the stability of the economic environment. The upward break of the 3-month curve compared to the 2, 5, 10, and 30-year curves has raised questions about the future trajectory of the economy. Simultaneously, housing prices in the United States have reached historic highs, raising concerns about a potential real estate bubble. This situation prompts questions about the sustainability of the real estate market and the risks associated with a potential collapse in housing prices. Geopolitical instability further contributes to the complexity of the economic landscape. With ongoing conflicts in Russia, the Red Sea, Palestine, and escalating tensions in Taiwan, investors are compelled to assess the potential impact of these events on global economic stability. The S&P/Experian Consumer Credit Default Composite Index, showing an upward trend since December 2021, suggests an increase in financial difficulties among consumers. Similarly, the charge-off rate on credit card loans for all commercial banks, increasing since the first quarter of 2022, reflects growing financial pressure on consumers and the banking sector. In this context, it is essential to adopt a prudent approach based on a detailed analysis of economic and financial data. The ability to adapt to changing market conditions becomes crucial for individuals, businesses, and financial institutions. Continuous monitoring of the evolution of economic and geopolitical indicators will be decisive in understanding and addressing the challenges that 2024 may bring.

credit spreads cannot be ignored3 month yield - 10Yr yield compared to SPX for last 60yrs...prety clear that when spreads correct, markets correct. question is when do these yields correct with everyone expected fed to start cutting in 2024.

Rate Inversion DisappearingInteresting how the market basically topped out in July around the same time bond traders started correcting the inversion on longer term bonds.
I said a few months ago that bond traders don't know what they're doing, lol. They were assuming rates were just gonna drop back down, now they've adjusted. Problem is, all of the bonds banks have bought in the past year are now under water.

#dxy $dxy #elliottwave US 3 months yield ⬇️This count is based on my assumptions so anything can happen not a trading or financial advice just for educational purposes only kindly do your own ta thanks trade with care good luck.

Bond Yield goes down #Dxy goes down #elliottwave 26Sept23This count is based on my assumptions so anything can happen not a trading or financial advice just for educational purposes only kindly do your own ta thanks trade with care good luck.

US 3 Month Treasury Bills 1. We have broken a very important trendline
2. Short term rates have surpassed long term rates for bonds
3.

50DMA and TBILLS indicating when bear market hitsHere's a closer look at a highly reliable cyclical bear market indicator. Over the past two decades, it has consistently proven itself as a trusted signal, often aligning with yield curve inversions. In contrast to employing trendlines and breakouts for precision, this chart relies on moving averages. These moving averages function in a similar manner to channels, as they calculate the mean, much like a channel does in various aspects. When there's a breakdown from this mean, it typically signifies a significant loss of support.
From a fundamental perspective, this shift suggests that the market is heading towards a risk-off sentiment, leading investors towards products such as TLT due to their appealing pricing in comparison to stock valuations. The divergence we're witnessing appears unlike any we've encountered before. To return to the mean, it would require either a prolonged consolidation at higher levels for many months or a sudden and sharp downturn. I have my own theories on how such a downturn might occur, possibly triggered by an event akin to a cyber attack on financial systems, similar to the disruption caused by the COVID pandemic. However, that's a discussion for another day.
In this scenario, our focus should be on reacting to developments rather than attempting to predict them. Currently, the most crucial level to monitor is a potential retest of the 4100 range on the SPX, coupled with how the yield curve reacts when it approaches its initial resistance. If a breakout occurs in these areas, it could signify an increasingly uncertain market environment. For a more detailed analysis, please refer to the chart below, which provides insights into the points I've discussed.

Bond Yield Inversion vs. SPXThis is nothing new, really. People who have been in markets long enough know that when short term bond yields (3 month and 2 year, for example) come up to meet and invert to a higher yield than longer term bonds (like the 10 year, 30 year etc) that it often precedes a large market sell off as well as a recession that affects most everyone, not just stock prices.
On this graph, I maybe got a little carried away. I have the 1 month, 3 month, 1 year, 2 year, 10 year and 30 year as well as the actual Fed Funds rate with SPX in the background.
This goes back to the mid 1990s, you can see the dotcom boom, you see the yields invert, SPX tops and then takes near 3 years to finally find bottom before reversing course.
Unfortunately for long only stock holders, the treasury yields started to climb with stocks as well until they inverted in 2007 once more. Stocks started to come down, and, well, then 2008 happened...
You can see that in general, the fed funds and the shorter term yields find a plateau at their top, tend to stay there for awhile (sometimes for a whole year), then as they start to come back down, the stock market tends to be near its highs, and then the stock market starts to come down.
Big money tends to see higher treasury yields as a safer haven for their money than stocks at this point. If you have the ability to hold the treasury to expiration, you're guaranteed to get 100% of the money back plus whatever the yield % was at time of purchase as interest paid to you by the government.
Furthermore, there is an inverse relationship between bond yield percentage going up, and the value of bonds on the open market. As yields go up, the value of bonds goes down. Vice versa, as yields start to retract, bond values go up. So, there is high incentive to start buying a lot of bonds as the rates plateau near the top. Maybe some of these large hedges start to sell some equities as a hedge and buy more bonds as we get to that point. Rebalance their portfolio to be more bond-heavy.
Higher short term yields, higher fed funds rate also generally mean that the cost to borrow money for anyone is higher. Higher interest rates means more money out of the pocket of anyone borrowing to pay interest. Bonds themselves are just government debt.
The stock market is generally forward looking, so it's often making moves in response to moves in the bond market before main street really starts to feel the effects of the tightening in a meaningful sense. As time has gone on, it seems the market is reacting earlier and earlier to rate hike cycles.
Take 2018 for example, the yields didn't really invert until they all were already on their way back down. 2018 had volmeggedon to deal with to start the year, then came back, set a new high, then had a very rough second half of the year as bond yields plateaued. But, as the market saw that this small rate hike cycle didn't do any meaningful harm to the economy and started retracting, stocks took off again:
Then COVID happened, yields plummet, cost to borrow was as cheap as it ever has been, the government pumped money everywhere to try and prevent a complete collapse of everything, stocks were off to the races harder than ever before after finding bottom just a few weeks into the pandemic.
But, mentioning the market kind-of getting ahead of itself again, we had all of 2022, as it became apparent that inflation was now raging and bigger rate hikes than we've seen since the Great Financial Crisis would be necessary, the stock market sold off despite the economy still showing very solid recovery out of the pandemic.
But now, treasury yields are still climbing, but so are stocks. Treasuries hit a little hiccup in March as a couple regional banks were found to be overlevered in treasuries that had too low of a yield, and as more people began withdrawing money and those banks needed liquidity, they had to sell those treasuries at a loss. If they didn't have to come up with that liquidity and were able to allow those treasuries to mature, they make that small percent of interest for holding them. But because they were forced to sell them as treasury values were at a low because they had inadequate liquidity to cover deposits being withdrawn.
But, now maybe surprisingly, despite some of the troubles and the market sell off for most of 2022, we're now not all that far off of CBOE:SPX 's highs from the end of 2021, start of 2022. But, we still don't know what the full effect of the current high interest rates are going to be. It's possible the old mechanism where when we finally reach the top for interest rates, right as we get the precipice of rates starting to fall, equities top out and start to sell off shortly thereafter again. For how big and how long? Who knows.
Despite the recent 'skip' from the federal reserve, opting to not hike at the June meeting, the 3 month yield, which typically is what most closely matches/leads what the fed is going to hike to, has in recent days made it look increasingly likely that we see at least a quarter point hike for July. The market probably won't like that news, maybe we get a few red days, but if economy data coming in still looks solid and inflation is showing a slow, steady reduction, it may not be long before the market decides to go back up again. We might even go past the 2021/early 2022 highs this year.
But, eventually, we'll find the top for yields, and I have a feeling a bigger correction for stocks will loom at that point. For right now, seems like a bad idea to go against the bulls. But, keep an eye out for when we finally reach the top in treasury yields, look in particular for the 3 month, fed funds and the 2 year to go sideways. Once all 3 start to go down, pay closer attention to economic data coming in. Also take a look at www.tradingview.com for evidence of lower highs off the lowest point for the current cycle. You see the combination of the two, we may be in for a big correction. Again.

Short Term Bond Yields Setting Up to Crash along with the DollarThe 3 Month Bill is currently breaking down and backtesting a Rising Wedge after Bearishly Diverging at some extreme highs while the DXY has also broken below a long term trend line and is backtesting the S/R Zone and Moving Averages as Resistance.
I have expectations that both of them will crash majorly in the coming weeks to months.

$Dxy #dxy #btc #xauusd $BTC if yield goes up dollar goes up.This count is based on my assumptions so anything can happen not a trading or financial advice just for educational purposes only kindly do your own ta thanks trade with care good luck.

Economic Recession 2024Economic Recession 2024
This aggressive rise in interest rates and the resulting inverted yield curve caused us to pull in that anticipated mid-decade recession to 2024.
If the Federal Reserve Board decides to be even more aggressive, it could make the recession steeper and potentially prolong it into 2025.

Economic Recession 2024Economic Recession 2024.
This aggressive rise in interest rates and the resulting inverted yield curve caused us to pull in that anticipated mid-decade recession to 2024. If the Federal Reserve Board decides to be even more aggressive, it could make the recession steeper and potentially prolong it into 2025.

3 MONTH US GOVERNMENT BOND YIELD5.3 - 5.5 Maybe the next stop for the short term bond yields where the market will pause, consolidate and then breakout/reverse. The fed may also maintain the rates at around 5.5.

3 month yieldThe market is pricing in a rate CUT, and they're not gonna get it. Expect turmoil next Wed.
If Simple Jack Powell gets dovish because of a few bank failures, he'll lose the inflation fight. Tofu futures haven't dropped yet. Then again, he is the Village idiot, so anything can happen.
3 month YieldMarket priced out the .25% hike for next week, if the Village Idiot sticks to his guns (which he should) then the market tanks next Wed because they need to price it back in and adjust portfolios accordingly.
The problem here is that we're dealing with a complete idiot, so chances are high that he won't do what he needs to do. Tanking the market is part of what's necessary to control inflation, even if it means more banks go under. Failure to do so will lead to uncontrolled inflation which will necessitate even higher interest rates which means even more banks will go under. Basically it's pain now or more pain later, and Simple Jack Powell isn't smart enough to understand that.
Just imagine, if he doesn't get inflation under control now and it goes into the teens like the 70's, and he has to slowly raise rates over 10%.... then you figure we'll really have an 80's S&L crisis except with larger regional banks this time.
The damage was done when they did COVID QE, I said it when they did it. The Fed members are older than I am (51 years old), they should all know better since they lived through the 80's S&L crisis. The idiots were all too busy snorting coke while working for investment firms apparently.
Remember when he said "transitory inflation"? LOL, Pepperidge Farms remembers.

A DEBT CRISIS IS COMINGHello Traders, Investors and Friends, have a nice holiday!
The US10Y bonds yield and the US03M bonds yield has flipped upside down since this 2022.
It has only flipped upside down three times in history since the 20th century.
The first time is in 2000 dot-com bobble, the second is in 2008 market crash, the third time is in 2019 unlimited QE
I think there’s a debt crisis coming, or a dollar credit crisis.
The long-term and short-term interest rates upside down is one of the best indicators for predicting recessions across a range of economic variables, and it has successfully predicted all recessions in recent decades without any false. So it's worth to watch.
There are four types of financial crisis:
The first is currency crisis;
Second, banking crisis;
Third, debt crisis;
Fourth, capital market crisis.
Continued interest rate hikes in the US and Europe due to inflation will dampen consumer demand and economic activity. In addition to inflation in Europe, there is also the impact of the energy crisis. In the case of weak demand in enjoying countries such as Europe and the United States, it will be transmitted to crude oil countries, producing countries and raw material countries. The decline in aggregate demand has a worldwide impact.
The IMF predicted that the global economic growth rate in 2023 will be 2.7%. The World Bank predicted in June this year that the global economic growth rate in 2023 will be 3%. Now it has been revised down to 1.9%. If the two major international economic institutions in the world lower the world economic growth rate in 2023 to below 3%, it means that they judge that the global economic recession in 2023 is inevitable. The managing director of the IMF, said "It is not ruled out that a debt crisis will happen in emerging market countries. In 2023, 2/3 of developing countries and 1/3 of emerging market countries may appear to varying degrees' debt crisis."
In 2021, the global debt is 272 trillion dollars. The global Debt-to-GDP ratio is extremely high. The developed economies to GDP ratio is 119.3%, and the Debt-to-GDP ratio of emerging market economies is 65.8%.
For developing countries and emerging market countries, most of the fiscal spending plans hit by the COVID-19 have expired by the end of 2021. Emerging market and developing economies that adopt austerity policy in 2022-2023 will rise from more than 60% in 2021 to more than 80%, and government spending as a proportion of GDP will be lower than in 2019. Rising interest rates in developed countries have put enormous pressure on the public finances of emerging market countries and developing economies. For countries with high levels of foreign debt, the financing environment has tightened, exchange rates have depreciated, and imported inflation has risen. These factors make them face a trade-off between monetary policy and fiscal policy.
The logic, you can think for yourself from the two perspectives of "bond issuance" and "interest rate", so I won't explain it in detail here.
All in all, this is not so much a debt crisis as a dollar credit crisis. Because another name for credit is debt.
Everything is not good to overdo it.
Anyway, happy holiday and best wishes!
And also, happy trading!
This is my opinion, I really hope it will be useful for you.
This is an article not financial advice, always do your own research.
And please don't forget to support this idea with your like and comment, It means a lot to me, thanks.
Be prepared and save your money. Make big profits!
