Betting on Treasury spreads: long 5Y, short 30Y It's obvious that the Fed has to continue Treasury purchases to keep rates suppressed; the Federal debt is so huge at this point (and the fact that financial fallout from covid isn't even close to resolved) indicates to me that yield curve pinning is likely part of our future.
If the Fed pins yields, they're likely to start out towards the front end of the curve. That means we'd see shorter duration yields drop, e.g. they might decide to pin the 5Y to zero.
Everyone's talking about inflation these days, so it isn't beyond belief that 30Y bond yields might pop up. This is the leg of the trade I'm most uncertain about. It seems not unbelievable to me that 35 year bond bull market continues, and asset inflation keeps pumping 30Ys.
In any case, the trade here would be a duration-weighted, delta-neutral curve trade. You might buy 5Y treasury futures and sell 30Y futures at a 4:1 ration to account for differences in duration. As you can see on the chart here, there seems to be a cyclical pattern whenever the Fed starts to dramatically intervene in the rates market. It would fit historical patterns that the 5Y-30Y rate continues to head lower.
At least partial credit to this idea goes to Kevin Muir.
US05Y trade ideas

Bond notes on Monthly Lows / Recovery will be Bearish for GoldIt is well known that Gold is tightly correlated with Bond notes, which are showing apparent recovery candles. I am on a strong Sell side regarding Gold's Medium-term and a slightest recovery on Bond notes could engage the historic decline on Gold. DX did approach the #92.80 Support but Gold remained more or less stationary Hourly 4 chart making a mere Lower High #1,955.80, highlighting the strong Bearish pressure it is under. The Hourly 4 Channel Down had no further room to go, so I don't expect this consolidation to continue. My focus shifts to the Fed leaving the rate unchanged due to the ties on Stock markets. Trading Gold is tricky for inexperienced and Traders, situations such as this one, even if we see all Bullish setups, this is not a good sign for those who want to Buy this market on Long-term (most of Traders will) as the more prominent area for Buyers to keep an eye on, having seen how well it held Price-action Lower in late November. This is a cautious market at the moment. As soon as Bond notes engage the recovery, Gold will initiate historic decline towards #1,700.80 zone.

ridethepig | Recession Strategy📍 This chart update comes from the ' Alpha Protocol - Seeking Immediate Extraction '
The cramped inversion should aways be considered the end game of an economic cycle. But of course we will get the v shapers and naysayers who obliges that stonks only go up. The space available to operate against the Robinhood army is becoming more flexible. Sharp speculators are seeing more of an advance in the 2's 5's curve and abandoning ship when it suits them.
The threat of recession completely materialised and shows the importance of outguessing its weakness. You can learn from this inversion that:
1️⃣ Every other time this happened it ended badly for the global economy via recession. ✅
2️⃣ A Fed that lags and finances the Whitehouse will only add fuel to the flames... "it's different this time". ✅
3️⃣ The longer the delay in USD devaluation from Fed, the worst the blow is going to be in Equity markets. Assuming USD does not devalue materially into 2020 its repo will grow and continue expanding the balance sheet , one way or another eventually this is going to look like Fed has been financing the WhiteHouse and then the game is up.
Powell's noble attempt to pick a fight with the end game in an economic cycle can be regarded as having come to nothing. The threat comes from confidence and credit. Aiming for a complete annihilation across risk assets into 2021, the presence of the inversion was sufficient. Now this move will be made with momentum.

Will it go higher together with 10 Year?If so will it bring equities down and DXY up? Will the correlation hold or diminish?

Bull time for #5Y - Bear time for Gold / correlationTaking all aspects into consideration, personally - Gold is ready for more than #200$ historic decline on Medium-term. New monetary stimulus is prepared by U.S. officials, “economy recovery” process is expected as U.S. Treasury yields and Bond notes (#5Y), dipped without finding the Support regarding market sentiment and Technically - Bearish Price-action should be rejected, subsequently weighing on traditional reaction of the market/Investors using Gold as a safe-haven. Down (almost #0.205), in the shape of a near-full-bodied daily Bearish candle, Monthly chart Price-action (Bond notes #5Y) is determined to challenge October #17 #1,998. Year opening level on a strong decline which added strong Buying pressure on Gold and is a sole Fundamental reason of Gold’s current strong upswing. Another point worth taking on board here is the RSI indicator seen on the Yearly low’s, indicating strong turn of the events which is a messenger that Gold is facing the ultimate Top and the time has come for an strong correction. It is more than obvious that all current recessions are gradually well planned, such as one on #2008, #2012 and current one #2020 - and the result is uncontrollable rise on Gold representing Safe-haven. Once the Bond notes (#5Y) find the Support, I will carefully monitor and start Selling Gold on local Highs. That is why DX is also hammered (suited for currency printing - Fed left the rate unchanged means free money for Wall street and Investment Banks - which they will share further the printed currency (DX $). Also, Stock markets are currently moving on Swings (which is not usual for that kind of market) as an main example of market turbulence. Bottom line: My estimation shows that Gold can Trade within #1,680.80 - #1,780.80 within #2 Months.


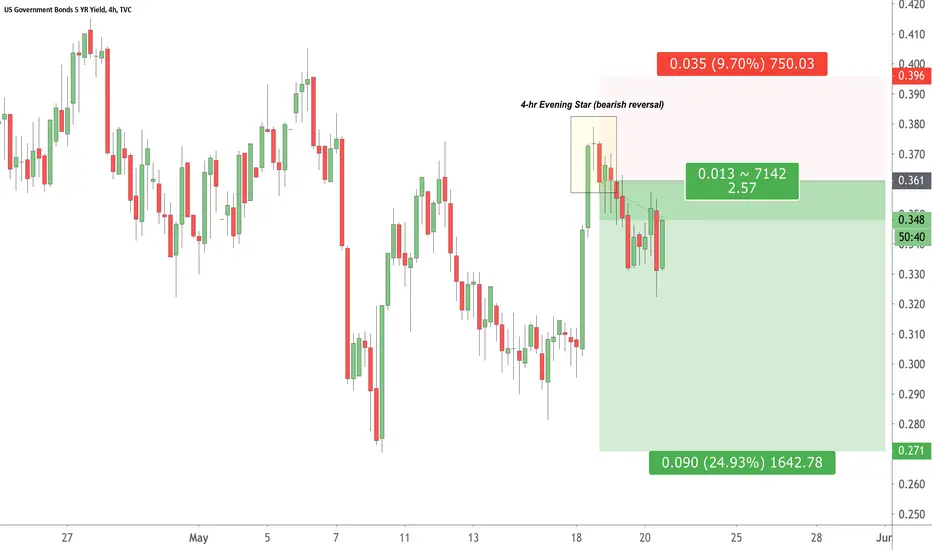
Easy Money: Update on my US05Yr Short from this WeekDownside remains,
17:17:45 (UTC)
Fri May 22, 2020
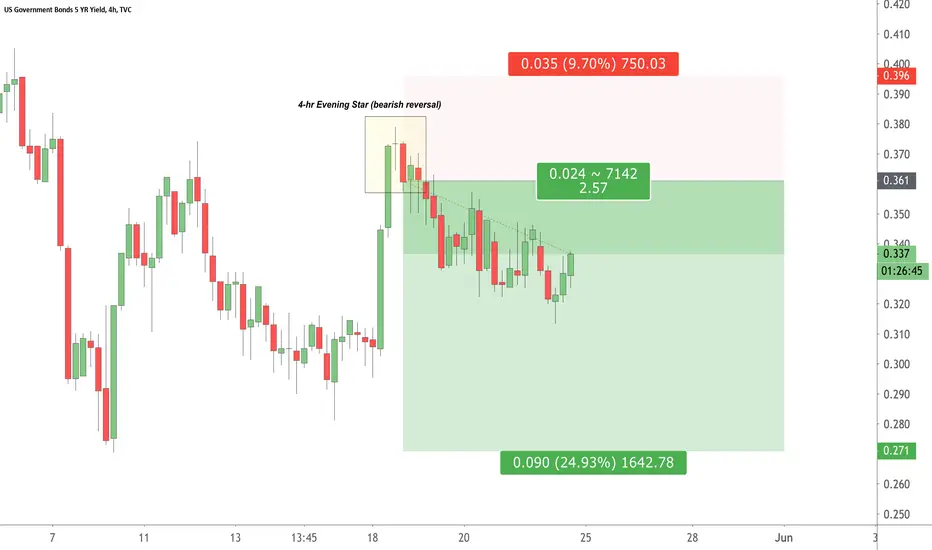


US05 Yr Yield Short Position Update Shorts covered at breakeven from entry taken yesterday.
21:54:07 (UTC)
Wed May 20, 2020


ridethepig | US 2s5s Curve Screaming Recession in 2020A timely update to the 2s5s US Curve which is breaking higher with the resteepening after flattening from 2016. This breakout indicated we have marked a meaningful base with the next target in play at 29bps which is the measured target from a breakout.
(1) Every other time this happened it ended badly for the global economy via recession.
(2) A Fed that lags and finances the Whitehouse will only add fuel to the flames... "it's different this time".
(3) The longer the delay in USD devaluation from Fed, the worst the blow is going to be in Equity markets. Assuming USD does not devalue materially into 2020 its repo will grow and continue expanding the balance sheet , one way or another eventually this is going to look like Fed has been financing the WhiteHouse and then the game is up.
For those tracking the renewed steepening there are plenty of opportunities if you know how to capture the symmetry; for example Banks outperforming was a no-brainer:
Defensives outperforming:
Rotation in full swing:
End of the Cycle? Smells like it...
Recession is calling...
Thanks for keeping all the support coming with likes, comments, charts, questions and etc! Best of luck those tracking for the end of the cycle... this chart will be one for the history books.

ALPHA PROTOCOL: SEEKING IMMEDIATE EXTRACTIONYou have opened the grave of an economic cycle. Before we dig deeper into the nature and consequences of our discovery, we will discuss the background to the thesis and consider first what we know from history a few lessons;
(1) Every other time this happened it ended badly for the global economy via recession. A
(2) A Fed that lags and finances the Whitehouse will only add fuel to the flames... "it's different this time".
(3) The longer the delay in USD devaluation from Fed, the worst the blow is going to be in Equity markets. Assuming USD does not devalue materially into 2020 its repo will grow and continue expanding the balance sheet, one way or another eventually this is going to look like Fed has been financing the WhiteHouse and then the game is up.
Protectionism is a serious error. There is no yellow brick road to success with protectionism, and it is no surprise the US via media manipulation have the masses deluded. This is a necessary component to the makeup of the next economic cycle; but it must be in balance, any overshoots or undershoots will destroy the effectiveness in manipulation.
Central Banks have been buying 20% of Gold supplies, expressing a view on global risk at rates we have not seen since the Nixon era when mortgage rates were surpassed by wages and no surprises this is also happening again now! Those with a background in fixed income will know alarm bells are ringing louder than usual in bond markets with wages ticking higher than mortgage rates. This is not sustainable and when danger threatens and the crowd does not smell it, don't stand like a sheep, rather run like a deer.
Now that Pandora's Box has been opened, it is equally important to understand the consequences and have a pulse to guide us on how to proceed:
Utilities starting to form a top:
Consumer Staples in the decade long chart:
For those with a background in waves you will know this is a typical example of a 5 wave count. This is time to start paying attention for any signs of a meaningful top forming. We know that once this final wave is completed a corrective chapter will begin. This chapter down is only a third of the pages compared with the rally and we can 'read' through it quickly.
Rotation in full swing:
Cyclicals vs Defensives :
Tracking Unemployment closely :
Vol sitting on the launch pad
Use this chart to good advantage, time to start paying close attention for early signs of a turn. As usual thanks for keeping the support coming with likes and we can open the conversation in the comments for all to share ideas and questions.


Time GuesstimateWe are watching a downtrend because of the order flow after the time target based on the wave analysis

RECESSION CLOCK STARTED An inverted yield curve means a market situation in which the yields offered, for longer maturities, are lower than the yields of the short-term portion of the curve (in this case the "short" is usually considered as the rates up to 2 years). This is a situation that is at first sight counter-intuitive. Those who have studied Finance will certainly remember the mantra for which 1 euro today is better than 1 euro tomorrow; an inverted curve, instead, says exactly the opposite: better 1 euro tomorrow. This means that investors, on average, are moving towards long-term investments, despite lower yields than short-term investments.

Spread national US bund 3 and 5 years, medium signal An inverted yield curve means a market situation in which the yields offered, for longer maturities, are lower than the yields of the short-term portion of the curve (in this case the "short" is usually considered as the rates up to 2 years). This is a situation that is at first sight counter-intuitive. Those who have studied Finance will certainly remember the mantra for which 1 euro today is better than 1 euro tomorrow; an inverted curve, instead, says exactly the opposite: better 1 euro tomorrow. This means that investors, on average, are moving towards long-term investments, despite lower yields than short-term investments.

Inversion of US-Treasury 2 & 5 yeild - a big picture viewA big picture of what history indicates will happen next. Nothing new here for the Macro people.
