US 10yr Bonds (US10Y) - Bullish RetracementOpportunity for trade with good Risk/Return ratio.
Signs of Bullish Momentum divergence on MACD indicator
Stop Loss and Profit Target determined by boundaries of Channel
US10Y trade ideas

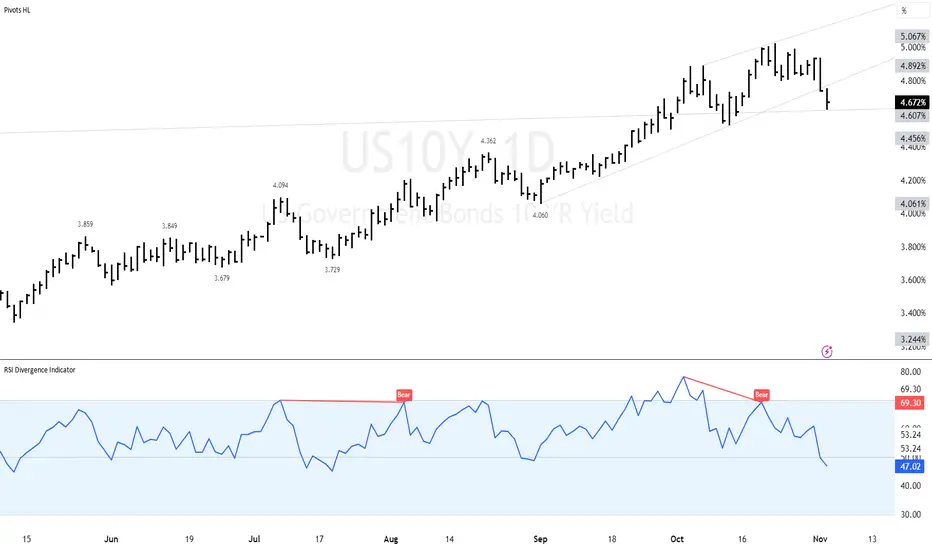
US 10Y yield approaching decent supportThe US 10Y yield is approaching decent support around 4.36/35 (August high, support line and Fibo) and the daily RSI is low (it does not normally maintain a move below 30) and this suggests that the market should hold this vicinity and attempt to recover.
It is helpful to use the daily RSI in conjunction with a target zone to add weight to an idea that the market is more or less likely to hold in this zone.
Disclaimer:
The information posted on Trading View is for informative purposes and is not intended to constitute advice in any form, including but not limited to investment, accounting, tax, legal or regulatory advice. The information therefore has no regard to the specific investment objectives, financial situation or particular needs of any specific recipient. Opinions expressed are our current opinions as of the date appearing on Trading View only. All illustrations, forecasts or hypothetical data are for illustrative purposes only. The Society of Technical Analysts Ltd does not make representation that the information provided is appropriate for use in all jurisdictions or by all Investors or other potential Investors. Parties are therefore responsible for compliance with applicable local laws and regulations. The Society of Technical Analysts will not be held liable for any loss or damage resulting directly or indirectly from the use of any information on this site.


US yields looking "toppy"; more weakness after rallyThe US CPI came down more than expected yesterday at 3.2% y/y, and as a result the USD fell sharply with US yeilds, while stocks and metals are on the rise. For now, this seems to be a very important data as it causes also a very important breakdown on USD index and US yeilds.
Looking at the US yeilds, we have five waves down, so it means that top is in place, and suggests that speculators believe that FED is done with hiking. But road map to lower yields/higher bonds will be a bit "bumpy", so be aware of some rally, especially if we consider five waves down on 10 year US yields. So A-B-C rally can cause some pullbacks on XXX/Dollar pairs, which will eventually see more upside after pullbacks.
Grega

US 10 Years Bond Yield 233 years old chart since 1790. 14/Nov/23US 10 years treasuries yields long term chart since 1790 is forming an expanding flat pattern ABC (Red), where it probably just completed wave II ( Blue Circled) = the first pullback of long term downtrend impulsive C wave ( Red )( further detail in next lower time frame chart ).

US 10Y TREASURY: no more rate hikes?Fed Chair Powell's speech in front of the IMF audience in Washington had some impact on the Treasury yields, but it seems that the market is still not ready to take another rate hike for granted. Namely, Powell`s hawkish tone on a possibility of another rate hike if the inflation “reaccelerate'' had an short impact on 2Y Treasuries which moved back to 5%, but the 10Y Treasuries remained relatively flat, which provided some market confidence that the Fed is finished with further increases of interest rates. It is also worth mentioning that the US 30-year bond auction was held during the previous week with the lowest demand within the last two years.
The 10Y Treasury yields were moving relatively flat during the previous week, ranging from 4.6% down to 4.48%. Still, they are finishing the week at 4.65%. Charts are pointing to a probability for 4.8% to be tested for one more time. However, a move back toward the 5% yield, is highly unlikely at this moment. On the opposite side, the next support line stands at 4.4%, which is also pending testing in the weeks to come.

Another Inverted Yield Curve with Even More Predictive PowerThe Federal Reserve Chair Jerome Powell spoke again today at a Brookings Institution event. His comments sparked a rally in markets (likely including short covering) that pushed the S&P 500 SP:SPX up about 122 points, or 3.10%, to close at 4080. The Nasdaq 100 NASDAQ:NDX rose 4.58% on the day, closing at 12,030.
But the bond market is sending less sanguine signals. The 10Y/3M yield curve inverted further today. Its inversion is currently the deepest since the slightly deeper inversion of this segment of the yield curve in 2000-2001 inversion, which had presaged the 2-year bear market from 2000-2002.
The 10Y/3M curve has been researched more than the more widely known 10Y/2Y curve (also known as the 10s/2s). Experts say inversions of the 10Y/3M serve as better predictors of recession than the 10Y/2Y curve.
The yield curve has remained inverted for over a month now. This qualifies as a "persistent inversion" that creates a recession signal. But the recession does not always follow immediately. According to Jim Bianco of Bianco Research LLC, "The average lead time" until the recession arises "is 311 days, or about 10 months."
What does this offer for traders then? On days when equity markets are rallying like there is no tomorrow, it tells us that markets are not out of the woods despite the buying frenzy. It means that a recession is more probable than not in the next year. But it doesn't tell us much about where prices are headed in the near term (technical analysis of price itself works better for this purpose). Just because a recession will likely begin in the coming weeks or months does not necessitate that equity markets plummet in a straight line to the ideal target. Many, including this author, wishes it could be as straightforward and predictable.
So traders should also keep in mind that inverted curves are not a trading signal. They are part of the broader economic and rate-policy context within which equity markets operate. It helps me to know that markets are not likely to resume a long-term uptrend until the recession has ended.
The bond market tends to sniff out the problems in the economy long before other markets. And equity markets can ride on hope and desperation for much longer than anyone expects—just as this unexpected bear rally carried SPX price from the October 13, 2022 low all the way back above the 200-day MA today and higher to close at 4080.11.
Below is a chart of the 10Y/2Y yield curve, which is also inverted.
Supplementary Chart A:
To compare the current 10Y/2Y inversion with some historic inversions, consider reading this prior post from July 2022 on the 2s / 10s yield curve inversion, and be sure to hit the refresh button to see the most recent months of data. The Wall Street Journal Confirmed in recent days, by the way, that the 2s / 10s curve
Supplementary Chart B:
Finally, on a monthly chart, one can easily see that the 2s / 10s curve inversion is the deepest one on record—at least as far back as the chart allows. Hat tip to @SPY_Master for pointing this record-breaking inversion recently.
Supplementary Chart C:


USBONDYIED FALLING
Volatility is high in US Treasury bond markets, but yields fell this week. n our view, the tide is turning in favour of sovereign bonds.
GOLD IS RISING

US10Y ~ Intraday Analysis (2H Chart)TVC:US10Y intraday mapping/analysis.
US yields dip while bonds & stocks rip.
US10Y in clear downtrend with potential bearish H&S pattern developing, TBC.
H&S development would correlate with bonds/stocks pullback before further bullish momentum into EOY.
Left shoulder, head & neckline outlined. Right shoulder parameters:
Rally above ascending 1st trend-line (green dashed)
Resistance at 200SMA, gap fill, 2nd ascending trend-line (green dashed) + upper range of descending parallel channel (white)
Price action rolls over to re-test/break neckline & validate pattern
Prelim target = lower range of ascending parallel channel (light blue) + 50% Fib confluence zone.
Note: break of "neckline" before right should formation negates H&S = express trip to prelim target.

10-year US Treasury bond : Black Swan and WOLFE Wave detected10-year US Treasury bond
Black Swan and WOLFE detected
EMA.50 and EMA.200 are possible targets
Look :
PRZ
Levels: Fibonacci / Bollinger / ICHIMOKU

US10Y Extremely overbought on Bearish Divergence. Sell longterm?The U.S. Government Bonds 10YR Yield (US10Y) is having the first red month (1M) after rising non-stop since May. It has been on extremely overbought levels for the last 12 months as the price established itself above the multi-decade Bearish Megaphone pattern, the same way it was oversold below it following the March 2020 COVID crash. As you know the price quickly corrected back inside the Bearish Megaphone in a pure technical harmonization process of the extreme levels.
Technically it should follow a similar reversal now again, as the most important technical development of the year is October's Lower Highs formation on the 1M RSI. This is a huge Bearish Divergence as the price during the same period is trading on Higher Highs. The same kind of Bearish Divergence has only been spotted another two times in the last +40 years. On both occasions, an aggressive decline started. As a result it is only natural to expect a 1M MA50 (blue trend-line) test before 2024 is over, which right now is a huge early sell signal.
-------------------------------------------------------------------------------
** Please LIKE 👍, FOLLOW ✅, SHARE 🙌 and COMMENT ✍ if you enjoy this idea! Also share your ideas and charts in the comments section below! This is best way to keep it relevant, support us, keep the content here free and allow the idea to reach as many people as possible. **
-------------------------------------------------------------------------------
💸💸💸💸💸💸
👇 👇 👇 👇 👇 👇

Relationship between US 10yr yield & the DXYAs traders look for signals on potential moves in the FX market, a frequent question I receive is regarding the relationship between the 10yr yield and the DXY.
US 10-Year Treasury Yield:
The US 10-year Treasury yield represents the interest rate on the 10-year government bonds issued by the United States.
It is considered a benchmark for long-term interest rates and is often used as a reference for borrowing costs across the economy.
This yield is influenced by various factors, including inflation expectations, economic growth, and monetary policy.
US Dollar Index (DXY):
The US Dollar Index, or DXY, measures the value of the US dollar against a basket of major foreign currencies, including the euro, Japanese yen, British pound, Canadian dollar, Swedish krona, and Swiss franc.
It provides a snapshot of the US dollar's strength or weakness relative to these currencies.
Relationship of US 10yr yield & DXY
The US 10-year yield and the DXY have a relatively strong positive relationship.
Increases in the yield on 10-year Treasuries have the tendency to draw capital into the US bond market because investors find US government bonds more attractive with higher yields.
Because of the increasing demand for the US dollar to buy these bonds, the dollar gains strength leading to a rise in the DXY.
As with any relationship between financial instruments, it is seldom 100% positively correlated given that there are a variety of factors, including inflation expectations, economic growth conditions, market sentiment, and central bank monetary policy.

US 10Y TREASURY: yields have peakedThe final breakthrough for the US Treasury yields was the latest FOMC meeting where the Fed decided not to increase further interest rates. Although, they are leaving the possibility for further hikes in case that inflation remains persistent, still, the market perceived it as the end of the Fed's rate hikes.
At the beginning of the week, the 10Y US Treasuries tried for one more time to test the 5.0% level, reaching only 4.92%. There was clearly no market strength to push the yields further to the upside. After the Fed's meeting, yields dropped to the level of 4.6%, while after the Friday`s jobs data, yields ended the week at the level of 4.57%. There is still space for yields to relax and move to the downside. Actually the level which is currently pending testing is 4.4%, which might be tested during the week ahead. Further supporting level stands at 4.0%, but currently there is no clear indication on charts that it might be tested in the week ahead. Evidently, the yields started their reversal path, and they will certainly not return back to the previous levels around 5.0%.

US10Y - Is it a "sea change" or a strong buy for TLT and TMF ?In December 2022, Howard Marks told in an interview that a "sea change" is underway in markets.
When I have seen below charts of TVC:US10Y , I have remembered that interview:
(Unfortunately I needed to remove the graph due to lacking reputation points. Maybe you can view with //x/HZKlWa8U )
TVC:US10Y was in a downtrend in a channel since 1980 and this long lasting channel has been broken at April 2022, and upper line of the channel became support at July and August of 2022. So there are some signs that it's not a fake going out of channel like the one in 2020 March.
Does Howard Marks right by saying it's a "sea change" ?
And in this weekly chart of TVC:US10Y , we can see it has formed a new uptrend in a new channel:
(Maybe you can view the chart with /x/DHeM0t8W )
See how good it has used that upmoving support. Now, we are again hitting that support and if that support line is broken, it would be a "strong buy" for NASDAQ:TLT and AMEX:TMF .
Both graphs have given bullish divergence recently:
(Maybe you can view the charts with /x/2jGkJkCJ and /x/5NGqJ3Ze )
This week we will see if TVC:US10Y will break the channel and confirm the bullish divergence of TLT and TMF. If the support would been broken at TVC:US10Y , then 4.20 and 3.40 and 2.75 are the levels to watch for the bullish trend of NASDAQ:TLT and $AMEX:TMF.
In conclusion, if TVC:US10Y will break the channel this week, I'm long in NASDAQ:TLT and $AMEX:TMF.
If not, we will keep watching if Howard Marks was right and it's really a sea change.

US10Y ~ November TA Outlook (Weekly Chart)TVC:US10Y chart mapping/analysis.
US10Y getting dumped off combination FOMC decision, US economic data + US Treasuries update triggering institutional short covering.
Bond & equities market squeezed higher, in-line with seasonality.
Possible bearish H&S in development on lower timeframe, pending pattern confirmation.

10year and 2 year Yield Curve InversionThe 10-year and 2-year yields foreshadow a recession. However, the market top is indicated when the yield curve stops inverting around the green area.

$US10Y Negative Divergence Played Out"The TVC:US10Y Negative Divergence Played Out as we observed a scenario where the momentum indicator, such as the Relative Strength Index (RSI), had been showing bearish divergence with the U.S. 10-year Treasury yield. This indicated a potential weakening of the yield's upward momentum, despite higher prices initially. Subsequently, the divergence 'played out' as the 10-year Treasury yield indeed reversed its upward trend, aligning with the bearish divergence signal. This divergence resolution may have led to a shift in market sentiment or investment strategies, impacting various sectors and asset classes."
10 years US Yield UP to 1.3%10 years US Yield UP to 1.3%,that position 2016.7,or 2020.2.at that time in 2016,FED pause Hike Rate in whole year.at sametime China supply Money to property, property price fly high in China.

The Bond Market is Pricing in a Collapse of The Yen Carry TradeThe spread between the US10Y and JP10Y has historically been a great leading indicator of contraction within the Yen Carry Trade and likely will be into the future.
If we were to apply TA to it, we can see that the spread appears to be Double Topping and has formed a Bearish Shark at this top as the RSI breaks down and the MACD Diverges. If we are to take this as a warning, then we should expect this spread to go down significantly, and that would be accompanied by the contraction of the Carry Trade, leading to lower liquidity and signfiicantly tighter credit conditions and ultimately a depreciation in market pricing.
I think we could see JPY and USD strength during this time but would avoid other currencies.

10 & 30 have short term topped since call on Oct 23GOOD MORNING!
Didn't have time to post yesterday.
Busy the entire day until I got home @ 9pm!\
10 Yr #yield topped the day the original tweet was posted.
30 Yr yield topped the following day!
#stocks #bonds TVC:TNX (See profile for more info)

10 minus 2 year Yield SpreadTime bomb...
1990-91
recession
2001
recession
2008-09
recession
2020
recession
#recession #gold #spx #purchasingpower

US 10Y yield has topped short-termThe Fed left its policy rate unchanged at 5.25%-5.5% and the US 10Y yield sold off on the back of a less hawkish Fed.
The daily chart reveals a small top completed between 4.80-5.02 and this implies a short-term target of 4.58.
We are viewing this as a correction lower, rather than the end of the longer-term broader upward trend at this stage.
Disclaimer:
The information posted on Trading View is for informative purposes and is not intended to constitute advice in any form, including but not limited to investment, accounting, tax, legal or regulatory advice. The information therefore has no regard to the specific investment objectives, financial situation or particular needs of any specific recipient. Opinions expressed are our current opinions as of the date appearing on Trading View only. All illustrations, forecasts or hypothetical data are for illustrative purposes only. The Society of Technical Analysts Ltd does not make representation that the information provided is appropriate for use in all jurisdictions or by all Investors or other potential Investors. Parties are therefore responsible for compliance with applicable local laws and regulations. The Society of Technical Analysts will not be held liable for any loss or damage resulting directly or indirectly from the use of any information on this site.
