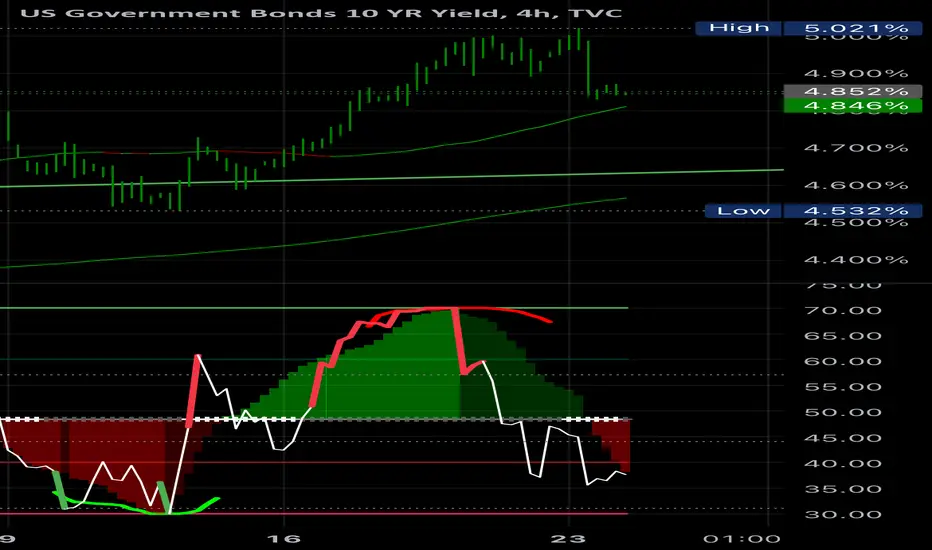
this chart signals equities have peakednow the price of this chart is rising.
This means the yield of 10Y bond is rising
harder then the 2 year. which means
debt is more expensive. which means less
cheap money. money is still cheap in real terms
but now less cheap than a year ago.
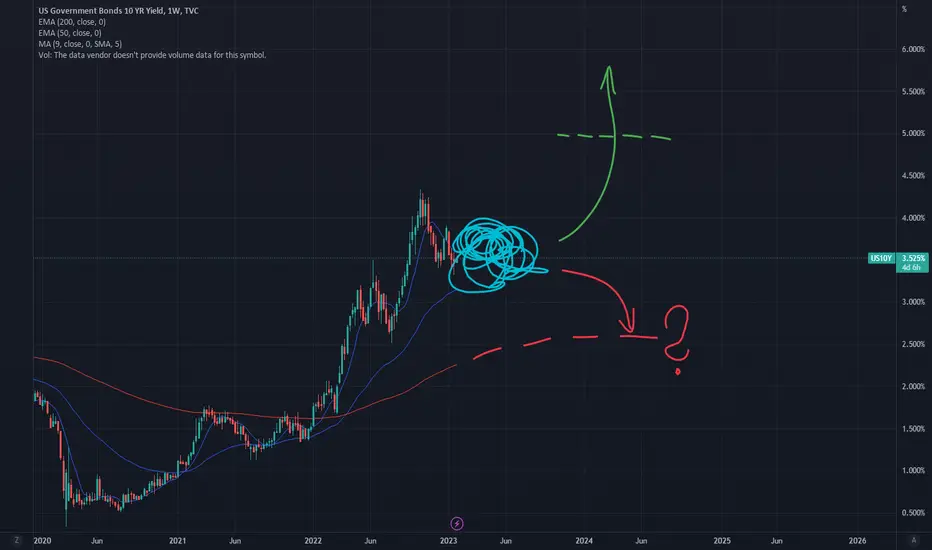
what will the central bankers do?
inflation is hidden but still high and if your smart
you know the govt numbers are understated.
inflation tax is gonna wreck you.
US10Y trade ideas

US 10 YEAR YIELDS (UPDATE)🚀Despite hitting our target, the US10Y has kept pushing much higher due to economic uncertainty. Biden has requested for an extra $100 billion in Congress to fund the Russia & Ukraine war, to give money to Taiwan & more money to Israel, to carry on their genocide against Palestine.
If this $100 billion is approved, then we can expect Bond prices to carry on crashing, while the US10Y keeps reaching new highs.

Bond yields crashing down from here. My TA shows that bond yields will crash down here with the dollar (dxy). BTC just launched up and I believe the stock market is next.
$US10Y Negative Divergence RSITVC:US10Y Negative Divergence RSI The TVC:US10Y showcases a negative divergence in the Relative Strength Index (RSI). This indicates that while the 10-year U.S. Treasury yield might be increasing, the momentum behind this rise is weakening. Historically, such divergences in the RSI can signal potential trend reversals or price corrections in the near future. Investors and traders should be cautious and closely monitor subsequent price actions and other technical indicators to validate this potential divergence.

How the Fed affects long Bond YieldsInverse chart of US10Y Yield to show changes in Bond prices.
Overlayed with the following:
Fed Funds Rate
US Treasury Deposits to Federal Reserve Banks
Increase/Decrease Rate of change to Fed Balance Sheet
Balance Sheet Total in separate pane below
The USCBBS Percentage Change shows the money raining down :-D
It's clear to see the relationship between the Fed buying Treasuries, i.e. Quantitative Easing (QE) and the increase in US10Y prices.
Quantitative Tightening (QT) is the name of the game now. There is A LOT of QT left to do, we're at most 25% into QT since the Fed has only rolled off roughly 1Trillion. They likely have 3+ Trillion to go. Expect US10Y to be under continued pressure as long as QT is in effect. Even when Fed Funds rates are lowered it will have little effect on US10Y while the biggest buyer of Treasuries is on hiatus.

US 10Y Yields First time US 10Y Yields have hit the 5% mark since July of 2007.
Interesting to note.
Concurrent to this China has recently turned on the money printers which has lead to more PBOC Liquidity etc.
With that being said it has partially driven crypto prices, albeit low sentiment.
Which is lovely to see :)
Before I get political, this may or may not get controlled soon. I'll let my political views be up for speculation.
They may though deploy the same as Japan some yield curve control.
Crypto is still long for me (ofc).
Although, stocks and other risk assets are becoming more uncorrelated.
So do with that what you may.
There is no current sign of exhaustion, for the 10Y in the short term.
Soon enough though there will be.

US 10Y TREASURY: has finally topped?It was a sort of game of nerves during the previous week, watching the US 10Y yields reach the level of 5%. This occurred for the first time after 2007, but the difference on charts was that no one was sure whether yields would stop at this level. It was such a strong push to the upside, after Fed Chair Powell's speech at the Economic Club of New York on Thursday. Although he said nothing new with respect to potential further rising of interest rates or inflation, still, the markets did not want to hear that jobs and economic growth need to suffer in order to bring the inflation down to 2%. Adding to it the developments within the Middle East crisis, the perfect storm occurred with US Treasuries.
Friday`s trading session brought some ease in 10Y Treasury yields, so they finished the week at the level of 4.91%. In case that they continue to ease in the week ahead, then the level of 4.80 might be the next stop for yields. However, in the case of any potential negative news which might bring yields to the higher grounds from 5%, it would certainly not be at all a good sign for the future prospectus for the US economy.

IS THIS STILL RELEVANT?This thread will be dedicated to my thoughts more about inflation and sharing my "monetary" non-political point of view.
uptrend till 5,25%I only see uptrend till 5,25% guys like rockie-feller, roths-child and the rest of scumbags elites just print money and buy bonds to hold its price...you must short the T-note future contracts ZN1 and fVck all them up!

US YIELD 10Y SELL FROM RESISTANCE ZONE HELLO TRADERS ,
As i can the chart is going to reach at a strong resistance zone and 10Y already our bought
so i am looking to let it complete this move and then we will get in trade with a very low risk and higher rewards ....
kindly share Ur trade ideas and stay tunes for new updates on these charts

US10Y Bearish Divergence tells us it may be time for correctionLast time we looked at the U.S. Government Bonds 10YR Yield (US10Y), it gave us a technical bounce and profitable buy signal (see chart below) as the Higher Lows trend-line held:
This time we get an opposite signal as the 1D RSI formed Lower Highs, while the price is on Higher Highs, which is a technical Bearish Divergence. The asset is still supported both by the 1D MA50 (blue trend-line) and the Higher Lows 3 trend-line since the May 04 Low.
Our strategy is to sell and target a price slightly above each Higher Lows trend-line, then re-sell if a 1D candle closes below that Higher Lows trend-line. Target 1 is 4.745, if a 1D candle closes below Higher Lows 1, we will re-sell and target 4.645 (expected contact with the 1D MA50). If Higher Lows 2 break, then re-sell and target 4.465 on Higher Lows 3 and a projected contact with the 1D MA100 (green trend-line).
-------------------------------------------------------------------------------
** Please LIKE 👍, FOLLOW ✅, SHARE 🙌 and COMMENT ✍ if you enjoy this idea! Also share your ideas and charts in the comments section below! This is best way to keep it relevant, support us, keep the content here free and allow the idea to reach as many people as possible. **
-------------------------------------------------------------------------------
💸💸💸💸💸💸
👇 👇 👇 👇 👇 👇

US BondsAfter true analysis on 30 Oct 22 that published on my Twitter account now see the Update.
I think the correction will continue to the first support zone of about 4.5%.

US10Y: IS THIS THE TOP FOR YIELDS?Using the fib retracement from our last previous cycle high, we can see yields have rallied to our 1.618 level, potentially signifying a top in yields may have been reached
We also have a triple bearish divergence on the monthly RSI almost creating this rounded top / head & shoulders pattern, signifying bonds could rally significantly with stocks if this is truly confirmed to be the top
shoutout to @JTheretohelp1 for mentioning this on X :)

10Y & 30Y Yield losing more steamGOOD MORNING!
#interestrates look like they want to slow down a bit, short term top.
We see the 10Y & 30Y pulling back a bit...
But this is better seen intraday.
We'll see how that unfolds...
IF IT DOES, it could cause a sharp rise in #Stocks.
Coincidentally, DJ:DJI @ support & TVC:NDQ is near a major support.
TVC:TNX AMEX:DIA NASDAQ:QQQ

US 10 Year Treasury Bonds - TOP Call Coming! (For now) $TNXWhat Major Event will occur to force thirst for US and G20 Treasury Bonds? It's happening soon. I wish I had a crystal ball to say what will cause it, but it'll happen. We're almost there IMO 5.19-5.25% topline target - then I hope in whatever this Market or world event will force yields to go back down to 3.19-3.25% Before eventually continuing back up in the next major World event to create Inflation AKA Wave 2 Inflation

An important chart you aren't aware ofThe calculation of the US10Y - US02Y has commonly been used to measure the yield curve inversion. Historically, when the curve inverts and then inverts back, it has led to a significant recessionary period globally.
And I know this information might be hard to understand for attention-deficient people like zoomers, so I included some helpful meme labels for them to understand.

10yr technical breakoutUS10yr is attempting a technical breakout. I never thought FedFunds would expand meaningfully beyond 3.5%, simply because the US Treasury could not handle rates that high. There is a major disconnect in IG/HY credit spreads. Duration is absolutely not reflecting the premium it should require. Everyone seems oblivious to the incoming pain, especially the US Treasury Secretary. See her on TV gushing over the “strong economy”. When asked about debt issuance she grins and says she isn’t worried at all. There will be buyers.. I would ask for how much longer at these rates. Price down yield up

WHY RISING YIELDS ARE PROBLEMATIC FOR SP500Have you ever wondered why on Earth equity traders cannot take their eyes off from US10Y chart?
The answer is the alternative trade. What does that mean?
When you invest in a company, such as buying its stock, you are taking risk. However, US10Y are riskless. This means every time you take a risk, you have to look at what the other less risky investments promise in returns.
This is why US10Y matters. As it rises, it puts lots of question and uncomfortable thoughts into investors mind. Should the investor take risk and buy the stock hopefully earning 10% or should just invest in US Treasury bonds and receive a yummy fat coupons?
That is why US10Y matters a lot and it is telling us that the 2024 holds volatile for assets.
-Signalwyse Team

US Treasury Yields Surge: Impact on Brazilian Markets📈🇺🇸 ON THE RISE! The 10-year Treasury bond yield surged by 15 basis points in a single day, reaching 4.85%, the highest level since 2007. The 2-year Treasury bond yields also climbed to 5.21% (+12 basis points), approaching levels not seen since 2006.
This increase followed a surprising boost in retail sales last month, raising speculation that the Federal Reserve (FED) might raise interest rates again. Despite the FED's expectation of another rate hike later this year, several policymakers have indicated in recent weeks that they do not believe further rate hikes are necessary.
This implies that Americans are likely to continue paying more for their mortgages, credit card balances, and bank loans, potentially curbing demand for goods and services as uncertainty grows.
The rise in interest rates in the United States has a significant impact on the Brazilian stock market, exerting negative pressure on the markets. The increase in U.S. rates can lead to a phenomenon known as "risk flight," where foreign investors seek refuge in U.S. Treasury bonds, considered a safe haven in times of financial turbulence.
This investor migration towards U.S. Treasury bonds may result in capital outflows from the Brazilian stock market, pushing down stock prices and generating volatility. "Brazilian risk" becomes a concern, as economic and political uncertainty in the country may prompt investors to reallocate their resources into safer assets, such as U.S. Treasury bonds.
Therefore, it is crucial to closely monitor the relationship between U.S. interest rates and the behavior of financial markets in Brazil, as these events have significant implications for our investments and the economy. #Finance #Economy #Markets #FinancialMarkets #BrazilianRisk #Investments 💹🇧🇷🇺🇸💼💰

possible cup and handle on 10 year things are getting fast, i think we consolidate shorterm in this bullish wedge then continue breaking on to new highs, the way the news has been its anyones guess what happens next

US 10Y TREASURY: weight interest rate outlookThe US Treasury yield eased a bit during the previous week, after a sharp move to the upside, during the past two weeks. This comes as a result of market expectations that the Fed might skip further rate increases during the course of this year. Latest published inflation figures are indicating that the inflation is clearly on its down-path, but still there are some uncertainties which might impact its short reversal, especially due to geopolitical tensions.
The 10Y Treasury yields started the previous week around 4.8% level, but soon eased and reached level of 4.5%. Still, yields are finishing the week around 4.6% level. As markets are now increasing probability for Fed to pause its further rate hikes during both November`s and December`s meetings, it could be expected for US Treasury yields to further ease. They will start the week ahead around 4.6%, with a high probability for 4.5% to be tested one more time, but there is no indication on charts that 4.4% might be reached in the week ahead.

US10Y Bullish as long as the 1day MA50 holds.The 10year Bond Yields / US10Y is trading inside a Channel Up since May 1st.
The last two weeks the price is pulling back after a Higher High rejection and Double Top on Resistance A (4.888), aiming at the bottom of the Channel Up.
That is a buy opportunity to target 4.888 again.
If on the other hand the 1day MA50 breaks (is untouched since July 20th), sell and target 4.222 (Support A).
Keep an eye on the Rising Support of the 1day RSI also for early bearish signals.
Follow us, like the idea and leave a comment below!!

Bearish Bat Pattern Startedthe detail is shown in the above Idea.
I made this Idea based on Candlestick Analysis and Harmonic patterns.
US10Y BAT has captured the area between the monthly Fibonacci level
