US 10 Year - When does Powell puke?Caption says enough, 4.8% incoming within a month or two. Powell my guy, you are stuck.
US10Y trade ideas

$DXY & $TNX & Rates show signs of exhaustionThe US #Dollar has pulled back a bit:
At MAJOR SUPPORT
At Green Moving Avg = Support
RSI is at 50 (neutral bullish unless crosses lower)
Weekly TVC:DXY is 50-50
The RSI is curling over but the MACD is now above 0 = down trend over
Hmmm, interesting scenario
Not sure what to make of it Monthly
#currency
-------------------------------
The 2Yr #Yield broke the recent up trend.
While it has performed better than shorter term #interestrates it's gotten weaker recently.
The RSI & MACD have been trending lower for some time and it's much easier to see on a weekly! Look @ that Severe Negative Divergence!
Could rates be DONE?
-------------------------------
The 10 Yr #Yield on the other hand has built good deal of steam lately.
Weekly it is overbought.
Monthly it's overbought as well. But what is interesting is that the MACD has only been higher 1x than current scenario.
MACD histogram lower (arrow) = future MACD neg crossover?
However, it's nowhere near as weak as short term #interestrates
TVC:TNX

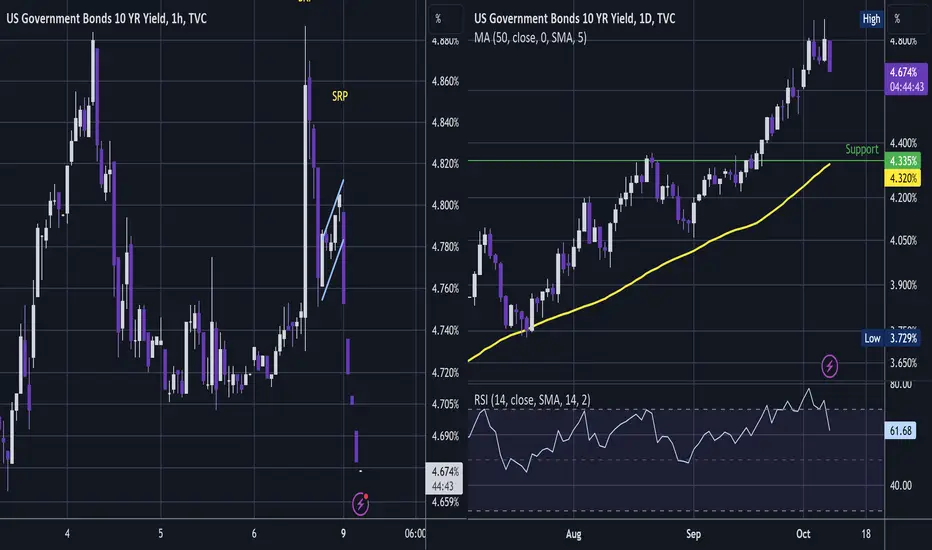
US10Y - Double Shakeout Back to 4.34% This shakeout pattern is one a a few permutations that my clients see a lot in my work.
Here it is in oil recently.
Its a fast up and down high volatility top the leads to a weak ascending channel then down and down.
20 year yields also doing similar and I am trading this by buying TLT.
Not advice.
Very tradable.
Will probably get back to the next support structure, probably support @ $4.34% or it could be the yellow 50 day MA.
US 10Y TREASURY: is it over?The US Treasuries were in the market spotlight during the previous week. Their sell-off continued also during the week, when yields reached their highest level at 4.88% for 10Y benchmark, which was its highest level for the last 16 years. The yields started to relax a bit on Thursday, however, Friday’s strong jobs report supported market sentiment on potential for another Fed's rate hike during this year, and yield slipped back toward the 4.80% where they are finishing the week.
As US inflation figures for September will be posted in the week ahead, the current question is whether the market has fully priced another rate hike by the Fed during the previous week or it will need some more time? Current yields are in a range of those from the 2008 financial crisis, and potential higher levels of 10Y Treasury bonds from those in 2008 would certainly send a negative sentiment to many holders of the US Treasury bonds all over the world, let aside consequences which many institutions could have due to negative valuations.
At this moment some precaution could be advisable for the US Treasuries. Charts are pointing for some time on potential for reversal and so is for the week ahead. The level of 4.6% is pointed on the charts as a potential next stop of 10Y yields, however, markets might easily decide to act in a different way in the week ahead.

US10Y Bond. Still in it's infant shoes.Just doing a fib retracement on the weekly showing that this is still early trend reversal days. This could easily extend to the 50%-60% retracement levels (8%-10%)
The US money printing, low interest and cheap credit days are counted.
The hangover after the party is the worst.

We've seen the top on yields in the US DollarENG:
Very basic and simple info: Bond yields go UP when no one is interested in buying bonds. It's a way to entice market participants to buy in.
- We saw yields on the 10 year paper go up in quite a quick move.
- No one was buying long term US treasuries.
- All of the sudden we saw an intervention by big money last week that went hand in hand with the Yen (I'll explain separately).
- There hasn't been any explanation by anyone about this mysterious opportunistic buyer that made yields cap at around 4.88%.
MY THEORY: The United States intervened and made these purchases themselves.
WHAT IT TELLS ME: They want to keep the rates/yields right there and not be forced into more rate hikes.
WHAT DO I EXPECT? I expect yields to start dropping and face value for the bonds to go up.
ESP:
Información muy básica y simple: Los rendimientos de los bonos suben cuando nadie está interesado en comprar bonos. Es una forma de atraer a los participantes del mercado para que compren.
Vimos que los rendimientos en los papeles a 10 años subieron rápidamente.
Nadie estaba comprando bonos del Tesoro a largo plazo de EE.UU.
De repente, vimos una intervención por parte de grandes sumas de dinero la semana pasada que fue de la mano con el Yen (lo explicaré por separado).
No ha habido ninguna explicación por parte de nadie sobre este misterioso comprador oportunista que hizo que los rendimientos se limitaran alrededor del 4.88%.
MI TEORÍA: Los Estados Unidos intervinieron y realizaron estas compras ellos mismos.
LO QUE ME DICE: Quieren mantener las tasas/rendimientos justo ahí y no verse forzados a incrementar más las tasas.
¿QUÉ ESPERO? Espero que los rendimientos comiencen a bajar y que el valor nominal de los bonos suba.

A Traders’ Playbook; The markets doing the work of central banksAfter a strong tightening of US financial conditions – primarily led by higher real rates and USD – we hear increasing acknowledgement that the markets are doing the heavy lifting of central banks and replacing the need for them to hike the Fed funds rate. That was the message we heard last week from Fed members Daly, Goolsbee and Bostic.
This suggests that if we get a hot US CPI print this week then market players will increase exposure to yield curve steepeners trades, with reduced interest to short US 2yr Treasuries - In turn, this should limit the upside in the USD, given the near-zero correlation between the USD and the 2s v 10s Treasury curve. With a focus on the US bond market, consider the US Treasury department will be issuing $101b in 3-, 10- and 30-year Treasuries this week and that could move markets around.
Technically, we are seeing that the USD appears to be consolidating, and while it comes with a hefty dose of risk, momentum accounts are again looking at the JPY shorts. NZDJPY longs look interesting for a potential breakout, especially with China coming back online, where we can see ‘green shoots’ appearing in economics. For those whose strategy thrives in higher vol regimes, then cast their eyes to LATAM FX, where outsized moves in the COP, CLP and MXN have come up on the day trader's radar.
US CPI aside, it will be a central banker fest this week, where an extensive list of Fed, BoE and ECB officials will be speaking at NABE (National Association of Business Economics) and IMF conferences. It feels like the market has made up its mind that the ECB and BoE hiking cycle is over, so Fed officials could move markets more intently.
We also get US Q3 earnings roll in, with the big money centres in play, and this puts the US30 index front and centre for index traders this week. For the political watchers, the process of finding a new House speaker will evolve and that could have big implications for the next shutdown negotiations from 17 November.
Amid rising geopolitical concerns crude remains front of mind, and we watch the reaction for the futures open, with S&P 500 and NAS100 futures skewed modestly lower on the re-open.
Marquee economic data to navigate:
US CPI (12 Oct 23:30 AEDT) – arguably the marquee event risk of the week. The economist’s consensus is we see both headline and core CPI increase 0.3% MoM. This should take the year-on-year clip on headline CPI to 3.6% headline (from 3.7%), and core CPI at 4.1% (4.3%). The market’s pricing of headline CPI (in CPI fixings) is 0.25% MoM and 3.54% YoY.
A 3-handle on core CPI would be welcomed news and see USD longs cover and see XAUUSD and NAS100 push higher. Above 4.3% could see pricing for the November FOMC increase to around 40% (currently 29%) and see bond yields rise, putting renewed upside into the USD.
US swaps pricing per FOMC meeting
US PPI inflation (11 Oct 23:30 AEDT) – final demand is expected at 0.3% MoM, with core PPI eyed at 2.3% yoy. The market is less sensitive to PPI than the CPI print, but a big beat/miss to consensus could hold implications for how economists estimate PCE inflation (due 27 Oct)
China new loans (no set day this week) – While incredibly hard to forecast, the market sees a rebound in credit with new yuan loans eyed at CNY2.5t (1.35t). Above consensus numbers could see China/HK equity build on Friday’s impressive rally and see AUD & NZD outperform.
China CPI/PPI inflation (13 Oct 12:30 AEDT) – The lowflation regime in China continues but should gently rise to 0.2% (from 0.1%) on consumer prices and -2.4% on producer prices. USDCNH has consolidated through China’s Golden Week holiday, but should we see a trend emerge, the direction of this cross could influence G10 pairs.
China trade data (13 October no set time) – The modest improvement seen in the China economic data flow should continue with exports expected at-7.3% (from -8.8%) and imports at -6% (from -7.3%). Better-than-feared numbers could see China equity push higher.
BoE credit conditions report (12 Oct 19:30 AEDT) – we get the UK monthly GDP and industrial production (both due at 17:00 AEDT) and both should remain weak. The BoE’s credit data should also be lowball, notably given what we’ve seen in recent mortgage approval numbers. Traders will be paying attention to BoE speeches this week with swaps pricing essentially pricing the BoE to have finished its hiking cycle.
Mexico CPI (9 Oct 23:00 AEDT) – the market eyes headline CPI at 4.5% (from 4.64%) & core CPI at 5.75% (6.08%). The MXN finds few friends – largely due to weaker crude prices – but local data could play a greater role this week. USDMXN has found supply into 18.40, but swing traders may look at the 17.90 area to buy pullbacks for another leg higher.
US Q2 earnings this week – Citi, JP Morgan (13 Oct), Bank of America, Wells Fargo, UnitedHealth
This week we get the US big money centres out with earnings. The focus falls on asset quality, loan demand, net interest margins (NIM) and any commentary on the recent tightening of broad financial conditions.
A focus on the US30 index
When we look at the companies included in the US30, there are only two banks (of the 30 constituents) - Goldman's and JP Morgan. However, the US30 holds an incredibly high relationship with the XLF ETF (S&P financial sector ETF), with a 10-day correlation of 93%. With so many of the major financial institutions reporting, assuming this relationship holds up, the US30 should mirror the movement in the US banks.
Another important risk for US30 traders this week is how the market reacts to earnings from United Health (UNH - report on 13 October). UNH commands a massive 10% weight on the US30, arguably the biggest weight on the index. UNH is not a stock that CFD traders look at as closely as a say Tesla or Nvidia, given its more defensive price action. It’s one for the range traders, where buying into $460 and shorting into $520 has worked well over the past 12 months. However, given the weighting, US30 traders should be aware of the influence the stock can offer.
The market prices an implied move of 2.6% move on the day of UNHs reporting, which is in fitting with the average price change over the past 8 quarterly reporting periods. UNH has seen some large percentage moves over earnings and recall in the last earnings report the stock rallied 7.2% - so a sizeable rally/decline would influence the US30 given the weight.
While macro factors such as moves in bond yields, the USD and oil prices will influence the US30, one can see that earnings this week could also play a major role – time to buy the dip, or are we about to see a leg lower in the index?
Central bank speakers
Fed speakers – on first blush Fed governor Christopher Waller may be the marquee speech to listen to
ECB speakers – A big week of ECB speakers to navigate – EUR traders, how do you like your noise? As said, the market is fairly sure that the ECB are on hold for a lengthy period.
BoE speakers – with the markets feeling the BoE wont hike further, comments from BoE officials Mann, Pill and Bailey will be closely watched to increase confidence on that pricing
RBA speakers – Assistant governor Christopher Kent (11 Oct 12:00 AEDT)

18% yields???I'm hearing some have 18% targets for 10 year #yields!
That would be an EPIC generational event, greater than 1981, where rates fell short of 16%.
First, we got a 100 year resistance line at 5.4%.
1970s bull era for #gold #silver started above that line!
#fintwit #inflation

$TNX $TLT 10YR About to test 40 year gann fan line since 1981This 2/1 Gann Fan line has been in existence since 1981 and is about to be tested. For those that don't use gann fans - the 2/1 line is typically associated with a large pop. The 10 yr is already on a tear and this could result in a very fast pop to 5% in the coming weeks.

$US10Y Reaches 16 Year High, Short-Term Forecast & DiscussionThe TVC:US10Y has been extremely bullish since May 2023, and has gained more strength after the Fed's hawkish announcement that led to a "higher for longer" interest rate environment. The TVC:US10Y has broke through numerous resistance levels to reach its 16-year high. From a technical analysis perspective, the TVC:US10Y has a tendency to have strong bullish rallies with breaks above the Bollinger Band (marked by yellow lines). We are observing that scenario in the current bonds market. There is a likelihood that the rally continues for a few more weeks (approximately 1-4 weeks). However, I think the TVC:US10Y and bonds market are due for a correction back down to the EMA ribbon. A strong bond market hurts equities because investors perceive TVC:US10Y as a less riskier investment alternative. This is hurting SP:SPX in the short term, but a peaking TVC:US10Y could also signal the bottom of the SP:SPX correction at current levels. For now investors are waiting for Friday's jobs data after the Tuesday JOLTS job openings data came in worse than expected.

🔥 Bonds Are Predicting A MASSIVE Crash 🚨The Bond Yield Curve, which can be calculated by substracting the US 2 Year bond yield from the US 10 Year bond yield, has been inversed for quite some time.
An inversion of the bond yield basically means that bond traders require higher returns on short-term bonds than on long-term bonds, which translates to short-term bonds being more risky than long-term ones. This only occurs when bond traders anticipate an upcoming crisis.
The inversion on itself is not necessarily bearish, but the "un-inversion" is very bearish. As seen on the white chart, once the line crosses the zero line from below, it has always predicted an upcoming crash.
With the Bond Yield Curve recently seeing a strong "bullish" move, it's likely that we're going to hit 0% in the near future. Consequently, this signals that a market crash is on the horizon.
Whether history will repeat remains to be seen. However, we had one of the strongest yield inversions in history, which doesn't bode well.
Do you think that a crash is coming? Share your thoughts and charts.

Yield curve inversionAnother historical macro chart you should pin.
Key observations:
1) 1970s had severe episodes of very steep yield curve inversion.
2) Reversions do not always imply a recession, or even an imminent one.
#gold #silver #inflation #yields #recession #spx

US10Y Possibly Bullish Break Out 5-7.5% Target Bullish flag with easy 5% Target if monthy breaks above the resistance line forming a pole of bullish flag...
The information and publications are not meant to be, and do not constitute, financial, investment, trading, or other types of advice or recommendations.

$US10Y Ouch, 7 rates coming.
TVC:US10Y Ouch, 7 rates coming.
12-month chart and next level is 7% give or take, not good.

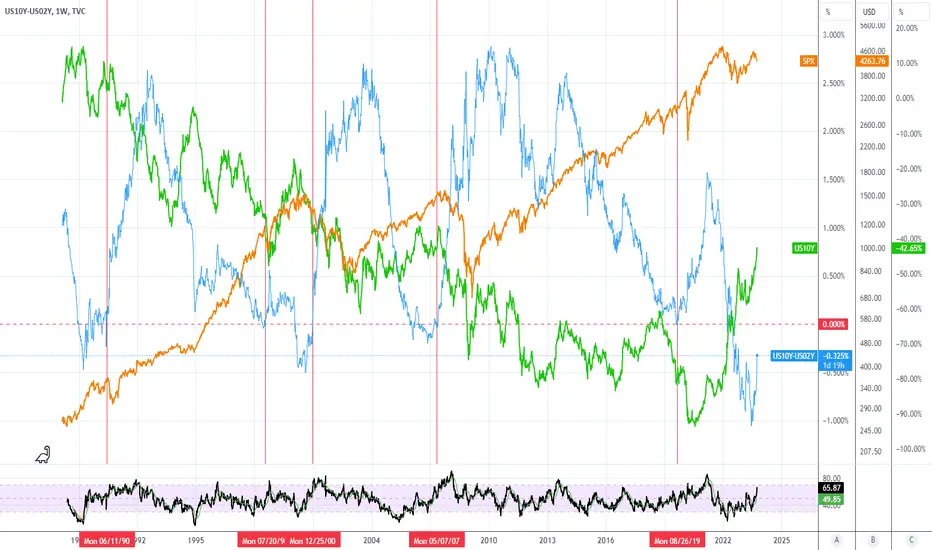
Yield to SPX ComparisonLong-term view of rates compared to SPX. Orange line is SPX, green line is 10 year yield, blue line is 10 year yield minus 2 year yield. Red vertical line indicates when the spread (10yr - 2yr) crossed back above 0 after dropping below. Historically, the curve has uninverted when yields dropped. I'm curious to see what happens if the curve uninverts with rates still rising.
US10Y: Soaring Bond Yields as Federal Reserve Maintains Hawkish The Fed Hawkish Stance
During Wednesday's address, Federal Reserve Chair Jerome Powell reinforced his stance on tackling inflation with a more cautious approach. He emphasized that the central bank is not yet finished with its efforts to curb inflation and hinted at the possibility of implementing multiple interest rate increases during future monetary policy meetings.
Powell's statement comes as a response to the ongoing challenge of bringing down inflation, which has consistently remained above the central bank's target of 2%. Notably, some Fed officials have emphasized in recent speeches that inflationary pressures persist. They specifically highlight core inflation, which excludes the volatile prices of food and gas, as not decelerating as rapidly as overall inflation.
The aforementioned statement supports the potential scenario of higher Government Bond Yields in the future, as an increase in interest rates typically correlates with elevated yields.
Technical Analsyis
The U.S. government's 10-Year Bond Yield has undergone a retracement, precisely at the 0.5 Fibonacci ratio, establishing a support area. Notably, the yield currently exhibits a bullish trend as it remains above the EMA 200 line, indicating positive market sentiment. Furthermore, the Falling wedge pattern suggests a continuation of the prevailing trend. Complementing this observation, the stochastic line crosses within the neutral area, further bolstering the case for a possible upward movement toward the target area.
It is important to keep in mind that once the target/support area is reached, the roadmap provided may no longer be valid.
If you find this analysis helpful, I encourage you to show your support by clicking the rocket button and sharing your opinions in the comments section below.
"Disclaimer: This analysis is intended solely for educational purposes and should not be considered as a recommendation to take a long or short position on the TVC:US10Y ."

yield inversion triggerSPX may see a push if we get a pull back in the yield inversion...but longer term, notice that anytime the yield inversion unwinds...what follows is a dump in SPX...

Yields are pivoting....massive stock and metals rally to followI think most are leaning the wrong direction...I think yields and the DXY are pivoting and we will see a massive rally into year end for stocks and metals...

Yield Curve Bottom (10s minus 2s) This is called the "Steepener" trade and refers to a mean reversion in the yield curve. From current level of (-38 basis points, or -0.38%), I'm targeting a move back to 1.00%, or ~70bp, risking down to about (-45bp), or about (-13bp) downside.
Yield curve steepeners seek to gain from a greater spread between short- and long-term yields-to-maturity by combining a “long” short-dated bond position with a “short” long-dated bond position, while a flattener involves sale of short-term bonds and purchase of long-term bonds.
- CFA Institute

TNote (US10Y) entering target area, expecting a pullbackThe TNote (US 10 year yield) has entered its target area for this up movement from the bottom.
Resistance area is between 4.65% to 5%.
We are expecting a pullback below 4% for the next months.
Then the uptrend should resume towards 7%, possibly higher.
A break above 5% would invalidate this view.

Bonds go down Stocks go up. The US Government Bonds 10-Year Yield goes down after each blue pivot point signal. At the same time, the SPX moves up 6 out of 7 times.
The US Government Bonds should come down a bit to the middle line of the bollinger bands and the SPX might move higher a bit.


US 10Y : "FED vs MARKETS" |...who will win? | (Part.II)The market is waiting for one of the most important events that could give a clear direction for the coming months. Today FOMC will release interest rate decision and the main players ( TVC:DXY , TVC:GOLD , VANTAGE:SP500 and FX:EURUSD ) will suffer the consequences. Even if we cannot rule out a 25bp increase, most analysts believe that a pause may be the right choice, also because the usual press conference is not scheduled for the next FOMC meeting, so the board could take advantage of this opportunity, to explain this "temporary change in direction" to the market.
So, what will happen today? No I have an objective answer to this question, unfortunately I am not a guru but a simple Trader, so today we will limit ourselves to following events.
Having said that, from a technical point of view, we were lucky in March because we widely predicted this increase in yield rates from 3.30% area to a new high (wave 5 for Elliottians) in Part. I of this Analysis. On weekly chart the trend is bullish and the next technical levels are around 4.46%, 4.61% and 4.7%, but today TVC:US10Y could take any direction.
US 10Y : "FED vs MARKETS" |...who will win? | (Part.I)
(Click on chart below)
Trade with care
Like | Share | Comment
