The Bear Steepener Analysis US10Y/US01YLooking ahead to the upcoming week and my market outlook:
Let's begin by examining the yield curve spread, which consistently correlates with the bear steepener. This spread provides us with a valuable timetable or countdown, usually spanning 1-3 months before a breakout occurs. When this breakout happens, it typically signifies that the market has already shifted towards a risk-off sentiment.
Similar pattern consolidations/breakouts occurred during most recent systemic risk offs, below is the one we've had during Covid:
Dot Com
s3.tradingview.com
2008
With the only exception, a major fakeout being the 1995-1998 period.
Now, when we consider the VVIX/VIX ratio, it offers a noteworthy perspective on the potential alignment of this bear steepener breakout with the possibility of breaching the bottom support. Barring any unforeseen developments that could disrupt this pattern, it appears that we are receiving indications or early warnings of an impending risk-off event.
Additionally, when we look at stocks above the 50-day moving average (MA), it confirms our decision to shift towards the long side just over a week ago. Moreover, there's a chance that this move could trigger a final squeeze. How long might this squeeze persist? My assessment suggests that it still has some room to run, and I would only recommend exercising caution once we start approaching the 60's in this particular indicator.
US10Y trade ideas

US 10 YEAR TREASURY NOTES ANALYSISThere is a strong relationship between bonds and equities. Recently, specific stocks such as APPLE and MICROSOFT have been retracing from their all time highs. There is a continual flow of money between the equities and the bonds ( like two poles on the opposite of each other ). If the bearish momentum in the equities continues in the coming weeks/months, the money will flow into the bonds, and the bond yields will fall as a result !
US 10Y Treasury yields looking vulnerableUS 10Y Treasury yields look to have completed an ending diagonal. Price has broken out of the pattern and looks under pressure.
Momentum and RSI indicators are weakening.
short to medium term bearish outlook as a result.
A move above the red line would invalidate the outlook.

US10YHi, every body listen to me please you can use Technical analysis everywhere no matter in which market you are trading just you need price and time and volume and liquidity.......
see the price action in us10y that is interesting big spike up in commodities .....if you are using my prediction please share them to your friends and family members.....
MY LAST ANALYSIS LINK :https://www.tradingview.com/chart/US10Y/HLTFy1xJ-US10Y/
ENJOY HERE WITH ME.
GOOOOOOOD LUCKKKKKK

📈📊 #ChartPattern Alert! 📈📊 📈 Rising Wedge 📈📈📊 #ChartPattern Alert! 📈📊
📈 Rising Wedge 📈
📈 What is a Rising Wedge? The Rising Wedge is a bearish chart pattern characterized by two converging trendlines, with the lower trendline sloping upward more than the upper trendline. It typically signals a potential bearish reversal, with the price likely to break downward after the wedge pattern.
📈 How to Identify:
Draw a trendline connecting at least two lower highs (upper trendline).
Draw another trendline connecting at least two lower lows (lower trendline).
📈 What it Signals: The Rising Wedge suggests a potential bearish reversal, with sellers prevailing at lower highs within the wedge. It often forms during uptrends and can precede a significant price move to the downside.
📈 Trade Strategy:
Consider short-selling or setting stop-loss levels if the price breaks below the lower trendline of the Rising Wedge.
Set profit targets based on the pattern's height subtracted from the breakdown point.
Implement a stop-loss to manage risk in case of a false breakdown.
Remember to use other technical indicators and conduct thorough research to support your analysis before making any trading decisions. Happy charting and trading! 📉💹

US10Y - Toppy CluesIn tandem with dollar, 10 year yields are giving toppy clues.
Last weeks candle printed a shakeout through the 2022 top.
And this could be the deeper perspective of the textbook "double top."
And now this week's candle is printing bearish so far.
Its actually picking up pace as I write and I have just entered a TLT Bonds long.
So I did say this could be climbing into the next wave up but the mid trend shakeout I have highlighted (notice on the 2 week chart there is the blended shakeout with large upper wick) does not support this and it look like it may be ready to collapse.
We'll see but if it does then it could be the explosive moment we've been waiting for in asset markets 🤨.

Macro short ideaWhen the 10y-03m has bottomed, people will seek the 10y security, selling their assets and locking in the highest rate.
This should be on the retest just as in 2000 and 2007 and 2019, also be confirmed closer to 0% difference.
SPX should be able to SFP ATH or just slouch from around these levels.

EURUSD Technical AnalysisUS:
The Fed hiked by 25 bps as expected and kept everything unchanged.
Fed Chair Powell reaffirmed their data dependency and kept all the options on the table.
The US economic data keeps on surprising to the upside, but inflation expectations and CPI readings continue to show disinflation with the last two Core CPI M/M figures coming in at 0.16%.
The US PMIs missed expectations across the board last week, while the US Jobless Claims remained solid.
Fed Chair Powell’s speech at the Jackson Hole Symposium was mostly in line with what he said previously but he stressed on the need to be careful going forward and that continued strength in the labour market may require further rate hikes.
At the moment, the market doesn’t expect another hike from the Fed, but the next NFP and CPI data will be crucial to confirm or change this view.

US 10Y TREASURY: relaxation ahead?During the speech at the Jackson Hole conference in Wyoming on Friday, Fed Chair Powell only confirmed what markets already saw in FOMC meeting minutes – which is that the interest rates might go higher from current levels if the inflation remains persistent. Prior to his speech, the 10Y Treasury yields reached the highest weekly level at 4.358% and remained elevated during the rest of the week. However, some relaxation came as of the weekend, so yields finished the week at level of 4.239%. But the question remains whether this was only a short correction to the downside and if the markets finished with testing of $4.3% level?
Current charts are pointing to the possibility for the 4.3% level to be tested for one more time. This might be supported by the fundamentals which will be released during the week ahead – the PCE Price Index for July and Non-Farm Payrolls for August. Still, there is no indication that yields might go higher from this level. At the same time a short reversal might bring yields back to 4.2% eventually 4.1% levels.

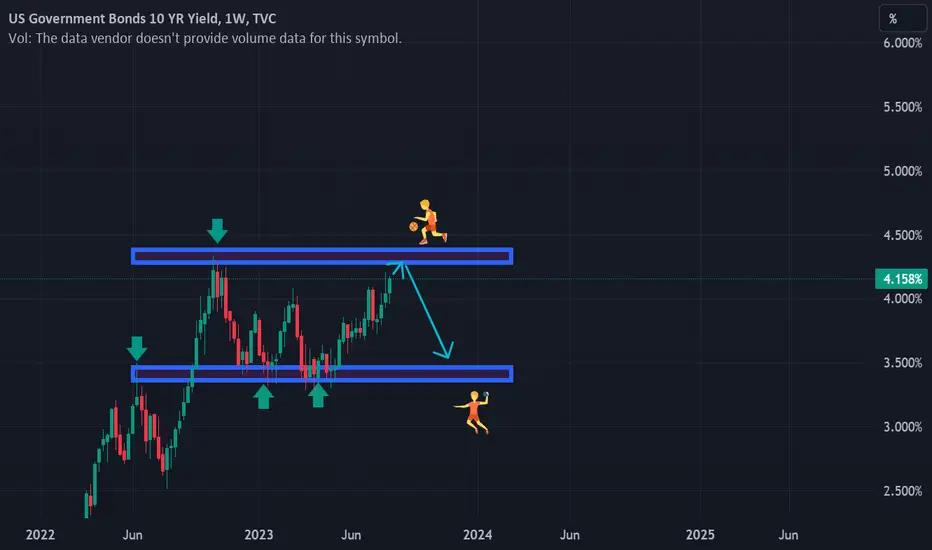
US10YHi ....watch this pretty retrace in US10Y ......i think that is really hard stone above us10y and strong resistance ....
Gooood LucK

us10y yields are ready us10year yields are ready structly to go down wait for the confirmation and go for it

US10Y downtrend correction As my view the US10Y inside ABC correction. wave C end at price range 3.714%
The correction will be invalid if price close below 3.615 %.
we use US10Y as additional tools to analysis the gold.
The relation between gold and US10Y is Inverse relationship.

US 10 Year Treasury vs USD/JPYTLDR:
The US 10-Year Treasury Yield and the closely correlated USD/JPY pair can be determinants or signals of market risk. With both breaking their three decade long trends, you have to wonder is a major secular shift upon us.
The USD/JPY currency pair has traditionally had a close correlation with U.S. Treasuries.
The pair shows how many yen are required to buy one U.S. dollar
The pair's exchange rate is one of the most liquid, not to mention one of the most traded, pairs in the world. That's because the yen, just like the U.S. dollar, is used as a reserve currency.
When yields on Treasury bonds, notes, and bills rise, the Yen tends to weaken relative to the dollar. When interest rates head higher, Treasury bond prices go down, which lifts the U.S. dollar, strengthening USD/JPY prices
The US 10-Year Treasury Yield and the closely correlated USD/JPY pair can be a determinants or signals of market risk. With both breaking their three decade long trends, you have to wonder is a major secular shift upon us.

Just Take Attention 1day basis followupWhen US 2Y passes over 10Y, that might sign something is wrong. Not calling recession however it says something might be wrong. Take attention while FED continues to US dollar burning and interest rate hiking.

Just Take AttentionWhen US 2Y passes over 10Y, that might sign something is wrong. Not calling recession however it says something might be wrong. Take attention while FED continues to US dollar burning and interest rate hiking.

Reversal Bars Part 4-1: Springs and UpthrustSpring and Upthrust:
In the first three parts of this series (linked) we covered the basics of reversal bar patterns including hooks, pipes, key reversals, and climaxes. In this piece we focus on springs and upthrusts. Historically these patterns were associated with trading ranges, but I find the concepts useful anytime a market tests significant support or resistance. This is particularly true in the modern environment in which price indecision resolves itself more quickly and trading ranges are less frequent. A spring or upthrust bar often signals a significant reversal and makes it clear that a change in the supply demand imbalance has developed.
The patterns covered in the first three parts mostly occur near the end of uptrends and downtrends. In this part we cover patterns that often mark the end of lateral trading ranges or tests of already defined lateral support and resistance zones. We will focus mostly on tests of defined support and resistance, spend a bit of time on trading ranges and take a quick look at the technical position of the 10-year Treasury in its trend to illustrate some of the concepts.
Definitions:
Spring: Price thrusts sharply below a trading range/prior low support level (often in reaction to bearish news) before quickly reversing and closing back above the violated support. The quick reversal traps bears who entered fresh shorts in the belief that the prior downtrend was resuming. Volume on the spring is typically quite high (the higher the better) and the price spread should be reasonably wide. To qualify as a spring, the reversal must occur quickly. Slower violations that fail can be thought of as washouts or bear traps.
Upthrust: Price thrusts sharply above the trading range/prior resistance level (often in reaction to bullish news) before quickly reversing and closing below the violated resistance. The quick reversal traps bulls who entered fresh longs in the belief that the prior uptrend was resuming. The volume on the upthrust is typically quite high (the higher the better) and the price spread should be reasonably wide. To qualify as an upthrust, the reversal must occur quickly. Slower violations that fail can be thought of as washouts or bull traps.
For simplicity we will focus on springs rather than upthrusts, but functionally there is little difference, other than the fact that springs, which occur at bottoms, are often more violent than upthrusts, which occur at tops. These behaviors often develop as the market tests a strong support or resistance. As in prior reversal bar examples, the structure often marks a meaningful change in the supply demand balance.
Spring patterns typically develop in reaction to news or fresh bearish information that pushes the market sharply below support. But after the initial reaction below the range/pivot lows, fresh selling fails to materialize. The lack of new supply signals that the immediately available supply is exhausted. The quick rally back inside the range traps new shorts and generates significant covering. Typically, the time spent below support is very brief.
Springs reveal the nature of the supply waiting below the trading range or pivot. If a market springs a range, finds no new supply and rallies back inside the range or above the pivot, it can be assumed that the range has cleared out the supply leaving the market is now free to rally. Generally speaking, springs should reverse at a reasonable level and do so quickly as new sellers fail to emerge.
The structure is often tested. If a test occurs, it should be on lower volume and will generally be at a shallower angle than the initial decline. In my view, the spring low should not be violated by any significant degree or the structure is invalidated. Initial stops placed just beyond the extreme of the reversal bar should be secure but they are often too far away from the entry to represent a reasonable risk reward and typically are moved aggressively higher.
The depth of the thrust below the support, the volume it occurs on, the chart perspective it occurs in and the aggressiveness of the rebound are all factors when assessing the importance of the spring.
In part 2, we will cover trading springs and upthrusts and spend some time illustrating the concepts with the current 10 year Treasury chart.
And finally, many of the topics and techniques discussed in this post are part of the CMT Associations Chartered Market Technician’s curriculum.
Good Trading:
Stewart Taylor, CMT
Chartered Market Technician
Taylor Financial Communications

US 10Y TREASURY: 4.3% overreacted or not? Previous week was one of the rare ones on the market, where some news hit the market totally unexpectedly. Such news was revealed from FOMC meeting minutes, where it has been noted high concern of several FOMC members that inflation might be persistent due to tight job market, which could imply more rate hikes from currently estimated. Fed pivoting seems far away now than ever in the last less than two years. Market reaction was pretty negative, while US Treasury yields surged to the higher levels. 10Y benchmark rates reached level of 4.3%, still, ending the week at level of 4.25%.
The week ahead should bring some market consolidation. After testing 4.3% level, yields should revert a bit to the downside. In this sense 4.10% might be an easy target, while it is still under question whether yields might return to the previous 4.0%. Still, it should be taken into account that the Jackson Hole Symposium will be held in the week ahead, as well as Fed Chair Powell's speech, which might bring some volatility back to the markets.

End of the 40 year Bond Bull Market?Everyone and their dog is looking for the Fed Pivot and rate cuts. I think if they do this and return to QE - they will lose the bond market. Then it won't matter for anyone on anything. This is the massive tail that I think nobody is looking for, but check the WEEKLY chart of the 10yr note.
Head & Shoulders (or their inverse) are typically formed at the end of a major trend. What I don't understand is why people think we are just doomed into a forever bond bull market...because the interest of our debt?
Global currencies are blowing up, I'm not that worried about some default on TSY - but that is all narrative and I make my living on trading charts - not farts (opinions/narratives).
FWIW - We have a giant inverse head and shoulders, and a breakout/backtest of a 40 year long trendline in the bond market on WEEKLY CHARTS. Everyone and their dog is waiting for a Powell pivot and a bond bull market to resume as nobody around has really ever known anything different. WEEKLY CHARTS are super powerful.
The monthly is even more bullish for rates/bearish for bonds....just follow the charts not the farts!

A Traders’ Week Ahead Playbook; destination Jackson Hole The big market themes last week were trading increased China risk and a resilient US economy with higher US ‘real’ yields (TradingView - TVC:US10Y-FRED:T10YIE ) – the result was broad USD strength and global equity weakness. GBP longs also saw tailwinds from the UK data flow, with GBPNOK the best performing major currency pair on the week – Services PMI could test GBP longs this week, although pullbacks should be shallow.
US equity and index options expiry may have played a part in the equity drawdown, with dealer’s net short gamma and delta hedging through shorting S&P500 futures and single stock names. Let’s see how options dealers/market makers deal with this inventory of short positioning/hedges this week, as it may be unwanted - suggesting risk that they buy-back short S&P500 futures hedges (to close), which could cause an early relief rally in equity.
Positioning will play a huge part this week and it wouldn’t take much to see US real rates a touch lower, with the USD following in its wake.
As the new trading week cranks up, news flow on China will drive and should the HK50 and CNH find further selling interest, then I’d be aligned, with a bias to look at short GER40 trades. The China property sector remains the elephant in the room, with the market finding little tangible fiscal support to reprice risk higher – the price action in the HK50 reflects that, with rallies quickly sold into. It’s time for Chinese authorities to step it up.
We get PMI data out throughout the week, but as the week rolls on the attention should turn to Jackson Hole, where Jay Powell takes centre stage. While this forum has been the setting for some bold changes to monetary policy in years gone by, it doesn’t feel like this time around we’ll be treated to such action. The USD remains front and centre this week – biased long, I acknowledge positioning is rich and could easily be vulnerable to profit taking into Powell’s speech.
The marquee data to navigate:
• China loan prime rate decision (21 Aug 11:15 AEST) – after the PBoC surprised the market and eased the Medium-Lending Facility last week, we should see the PBoC ease the 1- and 5-year Prime lending rate by 15bp respectively. Unless we see the Prime Rate left unchanged, Chinese equity markets will likely overlook any policy easing here and funds should continue to shy away from HK50, CHINAH, and CN50 longs. USDCNH finds support below 7.3000, but few are buying yuan with conviction other than to cover yuan shorts.
• Eurozone manufacturing and services PMI (23 Aug 1800 AEST) – the market eyes the manufacturing index at 42.6 (from 42.7) and services at 50.5 (50.9). A weaker services PMI, especially if the data prints below 50 (the expansion/contraction line) and we could see better EUR sellers, with the GER40 eyeing a break of the July lows of 15,500. Tactically warming to EURCAD shorts.
• UK manufacturing and services PMI (23 Aug 18:30 AEST) – the market looks for manufacturing to come in at 45 (45.3) and services at 50.8 (51.5). GBP – the best performing major currency last week - could be sensitive to the services print.
• US S&P Global manufacturing and services PMI (23 Aug 2345 AEST) – with much focus on China’s markets, US real rates and Jackson Hole, there is less concern about US growth metrics. As a result, the outcome of this may have a limited impact on the USD – it is still a risk to have on the radar.
Jackson Hole Symposium – Fed chair Jay Powell will be the highlight of the conference (speaks Sat 00:05 AEST) – again, it’s still premature for Powell to declare victory in the Fed’s inflation fight and will likely emphasise there is still more work to be done. He may also spend time exploring a higher for longer mantra (for interest rates), with a focus on where they are modelling the neutral fed funds rate; possibly one for the PhDs and academics. Powell should re-affirm his view that rate cuts are not in their immediate thinking.
From a risk management perspective, I am sensing Jackson Hole/Powell’s speech to be tilted on the hawkish side, and therefore modestly USD positive. Although given the bull run in the USD one could argue a hawkish Powell is largely priced.
Other Jackson Hole speakers:
• Fed members Goolsbee and Bowman (23 Aug 05:30 AEST)
• Fed member Harker (25 Aug 23:00 AEST)
• ECB president Lagarde (26 Aug 05:00 AEST)
BRICS Summit in South Africa (Tuesday and Wednesday) – It’s hard to see this as market moving and a risk event for broad markets. However, with BRICS countries (Brazil, Russia, India, China, and South Africa) accounting for 32% of global GDP and some 23 countries wanting to join the union, there will be increased focus on their expansion plans. Some have linked the BRICS to an acceleration of global de-dollarization, and while a global reliance on the USD will likely fall over time, the movement is glacial. A common currency for this union – while possibly getting headlines at this summit - is not something that seems viable anytime soon.
Key corporate earnings:
US - Nvidia report earnings (aftermarket) – many will recall the 24% rally in the share price in Q1 earnings (in May) and hope for something similar. Given the incredible run and heavy positioning, it may need something truly inspiring to blow the lights out. The market prices an implied move on earnings is 10.2%, so one for those who like a bit of movement in their trading.
Australia – 68 ASX200 co’s report, including – BHP, Woodside Petroleum, Qantas, Northern Star and Wesfarmers

A Generational Mean Reversion is now UnderwayLast week I posted my long-term perspective of the SPX cash market from inception .
This is the reverse of that.
I am not an economist. I'm a pattern analyst and trader. Nonetheless, as a student of the economy, I find that rarely do fundamentals align with a technical forecast. I try to encourage my members to abstain from applying linear thinking to trading the markets. Case in point was the recent release of the CPI report. Prior to the release of that report CNBC contributor, Fundstrat Partner and America's favorite perma bull, Tom Lee, was quoted as saying...
"Investors should expect a "sizable rally" in the stock market following the Thursday release of the July CPI report", according to Fundstrat's Tom lee.
Post CPI release, the report was fairly in line with expectations, but the market sold off, and continued to sell off. There was no massive stock market rally post CPI release. How did that make sense? It's easy to proclaim bullish calls since the last 90 years in the stock market has been pretty much a 45-degree angle up from left to right on a chart. Statically, being bullish was good for business, attracts new clients, and no one likes a pessimist.
The time horizons of the two financial disciplines (Fundamental vs. Technical) are typically not aligned... unless those time horizons are long... very long . A long time horizon doesn't suit traders, they suit investors. But the more I delve into long term charts, the more I reflect on how this affects me, my family, and the generations to come.
I have shared my longer term perspective on the SP500 with my followers many times. I rarely, if ever, look at bonds. I don't trade them, and in terms of making a paycheck, my time is better spent elsewhere. Except this morning I decided to look at the 10-year bond yield. To me it's just another data point supporting my overall thesis that the markets are beginning a super cycle event that will play out over the course of the next couple decades.
On a recent conference call with members, I remarked that I received a direct message from a member who complained I was too bearish. I then apologized to attendees on the call because it is not within my nature to be pessimistic, or someone mired in doom and gloom. Shout out to Nouriel Roubini . But I concluded by showing my 150-year analysis of the SPX cash market on my screen via Zoom and concluded, "Unfortunately for the duration of the time you will ever know me, I will be bearish".
The above chart is a typical pattern that will play out. I cannot over emphasize that the pathway outlined above is run of the mill. Nothing about the above should shock any technician. This would be the same pattern outcome on any financial instrument given the above price action...it just happens to be the 10y bond yield. But my foray into the 10y bond yield chart has me thinking the following answers apply to the below questions.
Will mortgage rates come down in the short term so I can buy a house?
The chart above suggests in the intermediate term, yields will continue to rise into early to mid-2024 before retreating somewhat. However, if my analysis is correct...the areas of where they are now are going to be areas of short term mean reversion back up. It is from our current rate, that all subsequent yield rises will draw support from. So, my response to that question is, the time to buy a home will not be much better than right now in my life-time...it will only get incrementally less efficient to hold such a long-term loan.
With $5-6 trillion in money market funds (so called on the "Sidelines") how could the stock market decline by much with so much money available to potentially prop it up?
The above chart tells me the competition for cash and cash equivalents on a risk adjusted basis has not been this disadvantaged towards the stock market since the financial crisis of 2008. In my opinion, that disadvantage will only incrementally get worst. Cash will not be deployed into stocks like generations before based on competition and the risk associated. P/E ratios, book value...none of that is front and center as it pertains to those trillions of dollars. Cash being deployed now will always be gauging the associated risk/reward. That factor makes this different from all other equity market downturns.
Although so much of what I am uncovering manifests itself into our daily lives over the course of years and decades, and not weeks and months...therefore, we’re more likely to embrace apathy vs panic.
Nonetheless, I do view many markets through the lenses of long term mean reversion. I am still evaluating how that perspective can best be converted into action for long term benefit. I’m optimistic I have some time…(see I’m not entirely negative).
Best to all,
Chris

Powerful Sell Alerts on BTC/ETH/SPY ! Buy alerts on USD and % !Have to be extremely careful of alt bags if BTC and Eth are as bearish as they are
BTC is the sun to the space and when it falls hard the rest will follow harder. This means that we can lose 20% - 50% - 80% value in alts fast esp the low cap high risk alts.
These alerts can quickly change and new data needs to be reacted upon so have to stay up to date
This can mean that current candle printing may print and unprint esp on timeframes such as the monthly when its only half way thru the month.. all we have to go off is the current data and currently that is looking bearish for btc/eth/spy and bullish for usd/yields.'
If btc is the sun of the crypto space then US gov yields are the sun to the finance space
With the USD and Yields close to breaking out then this is another sign of weariness to risk positions esp low cap altcoins as a the height of risky positions.
Admiral Ackbar told me its a trap look
These breakouts in DXY and Yields can be a trap in which price goes just above piercing resistance only to fail.. and failed moves move fast. That would be a trap but it is speculation until more confirmed data comes in.
Follow and click the link in tradingview to keep up to date with the data
Cheers !

Most important chart there is right now. The bear steepener.Those who are not skeptical about pattern breakouts will take this chart seriously.

Looong-term US10year yieldTick tick...
Historic break out of the downward channel. Only yield curve control will get yields back into the channel. Is the next phase of QE going to be yield curve control...
