US10 YEAR REVISITING 4.00 AREA?Looking at US10Y Bond
Technical analysis suggests that the bond market will revisit 4.00 area in a completion of Bearish Bat Pattern.
#Following Market closely
US10Y trade ideas

US10Y: Last dip before a medium term reboundThe US10Y is trading inside a Channel Down ever since its market peak on October 21st. The 1D technicals are neutral (RSI = 54.601, MACD = 0.300, ADX = 17.030) giving a mixed tone to the price action but based on the December-January Lows we can see the the Channel Down has one last dip to make before it bottoms and rebounds on the medium term. We will wait for that pullback around 3.250 and buy targeting the 0.618 Fibonacci (TP = 3.750).
## If you like our free content follow our profile to get more daily ideas. ##
## Comments and likes are greatly appreciated. ##

Will the US 10-year Treasury yield move towards the 3.9% level?This is my view of the next US 10-year Treasury yield movement. Of course, the Fed's decision at the early meeting next month will have a big impact on the US 10-year Treasury yield movement. But for now, I still see potential for an increase to the 3.9%-4.0% level.

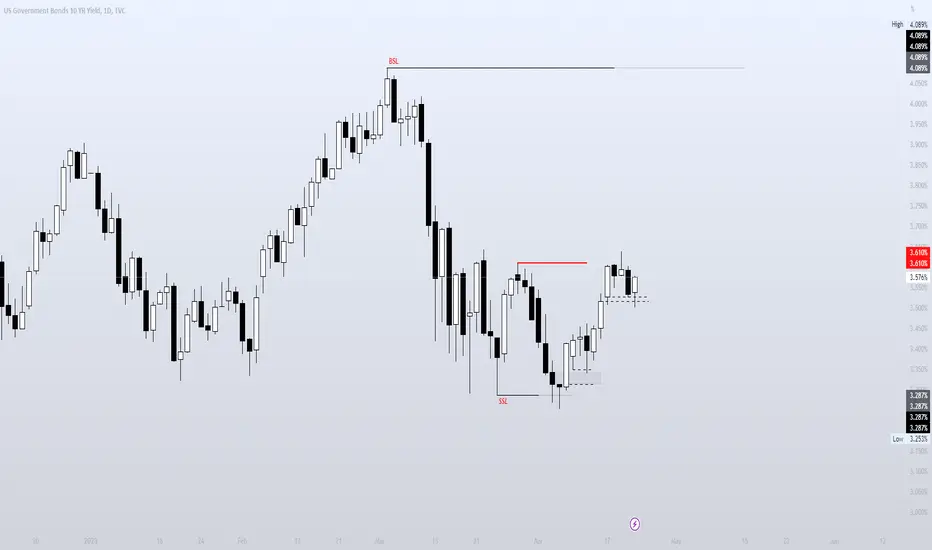
INCREASE IN INTEREST REATES VERY SOONFrom my previous analysis about Bonds market that is extremely bearish. The opposite should occur in the Interest rates.
From Pure Technical Analysis, Price takes out March 23rd lows and then broke to the upside
I expect price to continue on the Bullish path from the volume Imbalance and then proper to the upside
I expect 4% interest rates soom, that is the Buyside Liquidity above the market place
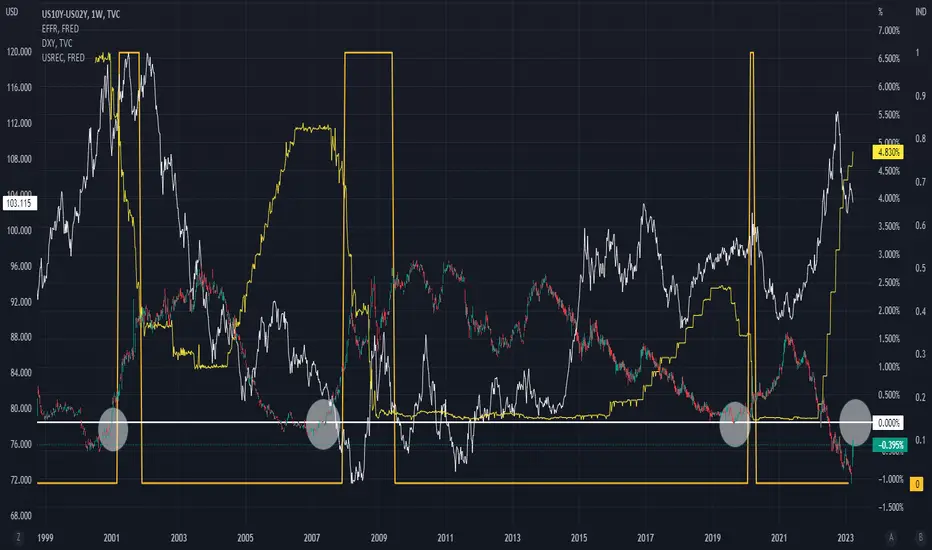
US10Y - US02Y : Lesson from 2008Not long ago, it was inverted by more than 100bps. Today, the inversion is about 40bps. As we all know, once it emerges from inversion, i.e. un-inverted, that is when we start counting to the next RECESSION. On average, it is 4 months. You can see it in the above chart. FED will soon cut rates.
Once un-inversion occurs, market will again do an adjustment/re-pricing exercise to all assets.
As you may already know now, the FED says there is NO RATE CUT this year. In fact, there is a possibility that there is one more +25bps to go. But you should know the market reaction by NOW. The market is signaling that the FED is done with rate hikes. You can see it in the Fed Fund Futures. In fact, market is now expecting a rate CUT in the next FOMC!!! and with more to come.
So now we wait for the un-inversion to occur. I think it is coming soon.
Also note that DXY is much higher than compared to 2008, meaning there is a BIG possibility that there is much more to FALL???
And possibility that DXY will continue to FALL until when the market sense that the FED is done with rate hikes. Once the EFFR touches 0.00%, that is when the DXY will start rising again.
Good luck.
P/S : Do not just believe what I say. Use your common sense.
4-19-23 [us10y]good eve'
---
decided to update my primary today, to further align with the current states of the market.
my upside target remains the same, at 5.9%--6% into 2024, but i think we go slightly lower locally, into june before it pops.
summer time is historically quite bullish in the market, so a slight pause on rates to align with seasonality makes sense.
thanks JP,
your service is appreciated ♥.
---
i got you an update if the structure changes.
✌

US10Y - US03M vs SPXThe yield curve is the most inverted it's ever been!
Does this mean MEGA crash is coming? Not sure...
And when will the crash come?
I believe after a new ATH and melt up in risk assets.
Yield curve will flatten and start rising.
The market top will happen as yield curve starts going back up.

us10y treasury bonds as you see treasury bond main trend line break. now price in a range channel. i think us10y traders predict interest rate will be reduce. what you think?

Market correlationI'm testing this correlation and looking at the bounce-up for the 10-year yields
To buy indices and sell gold, let's see :)
Let me hear from you..

us10y 4-14-23gm,
called the top on the us10y last year as well.
(view post at the bottom of this thread).
swinging by to actually adjust my public bias, after a few recent discoveries.
---
jerome powell explicitly mentioned in a few of the recent talks that the fed is going to raise the interest rates above 5%, and keep them there for some time.
what this tells me, is they're expecting inflation to tick back up - or they're taking the extra precautions to ensure that this indeed doesn't take place.
---
what i am implying here in my count - is an extension to 5.9% (at the bare minimum).
this could mark a top, unless we pull back in three waves (the same we did from the recent top).
👇

Rethinking Fed Intervention: Wages, Inflation, and AIIn light of the precarious global economy and numerous contributing factors, such as deglobalization, the inflationary impact of the war in Ukraine, an aging population, and an overwhelming amount of debt, the Federal Reserve's role and efficacy in the current economic climate have come into question. Drawing on Jeff Snider's work, it is increasingly evident that the Federal Reserve has not completely controlled the financial system. Despite their efforts to manipulate interest rates, external factors and market forces continuously challenge the Fed's authority. The market's current outlook suggests that the Fed may be forced to cut rates soon, indicating that its strategy of hiking rates may not have been the best approach.
The central premise that the Fed should intervene to suppress inflation by keeping wages low is fundamentally flawed. Higher wages can lead to increased productivity investments, reducing the need for labor and raising living standards over time. However, hiking interest rates can stifle investment, hindering economic growth and exacerbating inequality.
In recent months, inflation has decreased independently, without the direct influence of the Fed's actions, suggesting that the economy may be self-correcting. However, this natural deflationary pressure could be disrupted by external factors, such as the tightening of lending standards brought on by the mini-banking crisis. The ongoing threat of AI-driven job losses and an impending recession further complicates the situation for American workers.
Jeff Snider's research at Eurodollar University offers valuable insights into the complex relationship between the Fed and inflation. Snider argues that the Fed's actions may not be the primary cause of inflation, as it has limited control over the money supply. Instead, he posits that the global financial system, specifically the eurodollar market, plays a more significant role in influencing inflation rates.
As we progress into the exponential age, the rapid advancement of technology and artificial intelligence (AI) will lead to significant disruptions. However, there are potentially positive aspects to these developments. AI could revolutionize industries, streamline processes, and create new opportunities. The widespread adoption of AI can lead to increased efficiency, improved decision-making, and the automation of repetitive tasks, ultimately driving economic growth. The productivity gains associated with AI could offset some of the negative impacts of the current economic climate, such as job losses and wage stagnation.
In summary, the belief that the Fed should intervene to suppress wages to tackle inflation is fundamentally misguided. Such intervention can have numerous negative consequences, including hindering investment and stifling economic growth. In contrast, allowing wages to rise can lead to increased productivity investments and improved living standards. To effectively address inflation, it is essential to consider a more comprehensive range of factors beyond the Fed's actions and recognize the importance of encouraging sustainable economic growth through policies promoting higher wages and productivity investments. Policymakers and financial analysts must carefully consider the consequences of their actions and their impact on the broader economy and society.
Thanks to Michael Green, aka @profplum99, for inspiring me to write this analysis :) twitter.com


US 10-Yr Govt Bond Yield | Has the rate ripe for a decline?US10YR has been rising after the completion of what looks to be an expanding leading diagonal wave A and currently now may be in terminal level for the corrective wave B which could possibly reach at or below 4%.
The yield is often related to the USDJPY pair and it is noticeably mimicing the pairs growth since its last drop from 129 level to current's 134.
The precious metal Gold (XAUUSD) too was hurt because of this rising yield from 1959 last high to as low as 1818 as of this posting.
We may possibly expect a shift in this market direction once the yield starts to cool down from its rise and can therefore be use as an added conviction for the Gold's bullish reversal.
@marketpainterph
#elliottwave
#marketpainterph
#XAUUSD
#GOLD
#US10YR

Long from wave (4) to 6% zoneUS10Y yield is in completion of C of wave (4), expect to see a strong run up to 6% zone in wave (5) of circle 3 by end of this year.

Fed Fund Bond Futures CyclesChart shows the credit cycles of fed fund rates and bond futures ranging from short term expiring bonds up to 30 year bonds. S&P Nasdaq and Bitcoin are compared to historical changes in fed fund rate and bond futures. As the chart indicates when fed fund rates reach their lowest point we call this "easy street" all markets seem to steadily rise in this part of the cycle. As futures start contracting and rising off the low rates markets typically see a choppy/semi bullish price action. As the fed reaches the top of the hiking cycle markets tend to break higher highs and a melt up stage occurs. The last part of the cycle is the fed pivots rates start dropping and futures expand we have a market drop. Then we start the cycle all over again.
It seems as though markets are now in the hiking cycle with futures contracting. Although markets did not see a semi/bullish choppy stage as of yet but I think that we are entering that stage now. This would be a stock pickers market with choppy bullish price action. We should have a blow off top once rates reach their highest point and of course another drop once the fed pivots. This is the historical cycle and although history does not repeat it does tend to rhyme. Past performance of course is no indication of futures results. Take this with a grain of salt because things could shift but my belief is that we will still have the blow off top once the fed stops hiking rates. Any comments are welcome but if this holds true. It is your cheat code for future cycles. Happy and safe trading. "There are many roads to success but one must be chosen"

04/04 Journal:
As far as I can see, yield curve continues to trend down(LLs/LHs). New range established. Will treat PA accordingly.
when trend reverses may be a bullish sign. should occur before market turn bullish.

US Bonds (10Y, 02Y, 01Y, 06Months) all indicating lower yields!The US Federal Reserve officials, including Fed President Bullard recently spoke about the economy is still strong and the interest rates need to go higher. US Bonds (10Y, 02Y, 01Y, 06 months) are rejecting the narrative indicating lower yields going forward. Who's right? Normally, the bond prices (and hence the corresponding yields) are right!

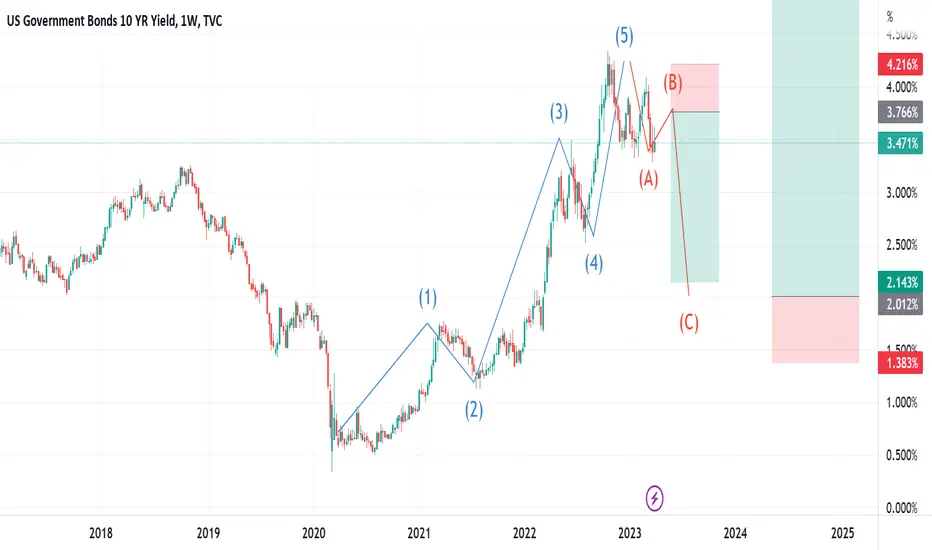
10 Year Yields Topping Out5 wave high completed at 4.25% and now showing potential to see 2.75% on wave C lower in Q2

That may have been the first break.Update to:
All lines original. No update the analysis/charting, just a follow up to say if this thesis was in play we'd now have held the wave "B" retrace/failed new high and be heading into the corrective C leg. Which would present itself as a capitulation in bonds yields over following big price swings.
US10Y: Rising short term inside its Channel DownThe US10Y is trading inside a Channel Down on the 1D timeframe with the 1D technicals neutral (RSI = 46.172, MACD = -0.046, ADX = 31.478). With the 1D RSI coming off an accumulation that we've seen on the December and January bottoms, we expect the price to rise and approach at least the 0.618 Fibonacci. Our TP = 3.750.
## If you like our free content follow our profile to get more daily ideas. ##
## Comments and likes are greatly appreciated. ##

BlackRock says the market is WRONG ....The World’s Biggest Asset Manager With $9 Trillion AUM, BlackRock are saying that the markets Are WRONG By Pricing In Interest Rate Cuts. There is a divergence between what the Fed is saying that they are going to do and what the markets are pricing in terms of interest rate bets. The Fed is saying “We aren’t going to cut rates”, but the market is focusing on the banking crises and thinks that will force their hand.
BlackRock says the market is WRONG and they don’t see any rate cuts this year.
I think the US 10Y Yield bounced off some key support last week down to 3.25 and currently the market is side lined. There are some very clear levels to watch on the US 10Y yield. But while above 3.25 the longer term up move for the US 10Y Yield is intact and only a close below this level would trigger a correction lower toward 3.00 and 2.80.
#banking #banks #economy #invest #investing #finance #trading #economics #markets

US10Y has not broken the support yet, all eyes on monthly close.It might appear on daily and shorter time frames that US10Y has broken the trend, dating back to 2020.
Weekly at key support level.
it will save the regionals (yield dives due to massive QE, HTM portfolio's MTM improves) or will destroy them (KRE).

