Bond Bulls Smell Blood: 20-Year Yields Likely to Fall🧩 Fundamental Bear Case for 20-Year Yields
1. Recession Risk and Slowing Growth
Leading economic indicators (e.g., ISM Manufacturing, Conference Board LEI) continue to suggest softening demand across key sectors.
A recession or significant slowdown would drive capital into long-duration Treasuries, causing yields to fall as bond prices rise.
Historically, 20-year yields fall 200–300bps from cycle peaks during recessions. With yields near 5%, there is ample downside room.
2. Federal Reserve Policy Pivot
The Fed’s hiking cycle appears to be at or near its terminal point. Rate cuts in 2025 are increasingly priced in, especially as inflation moderates.
If inflation continues to decelerate toward the Fed’s 2% target while growth slows, the Fed may be forced to ease sooner or more aggressively than expected.
Long-duration bonds, including the 20Y, are highly sensitive to forward rate expectations and would benefit from a dovish pivot.
3. Disinflationary Trends
Core inflation metrics (e.g., Core PCE, Core CPI) are in year-over-year decline.
Key disinflationary forces:
Wage pressures have eased as labor markets normalize.
Housing costs, which lag in CPI data, are projected to fall further.
Supply chain normalization continues post-COVID.
These factors reduce the need for elevated long-term yields, especially with inflation expectations anchored.
4. Supply-Demand Dynamics Favor Treasuries
Despite large Treasury issuance, global demand remains strong:
Foreign buyers (e.g., Japan, EU) seek higher yields as their home rates remain low or negative.
U.S. institutions (pensions, insurance funds) are rebalancing into risk-free long bonds amid equity volatility.
A risk-off rotation or broader de-leveraging cycle would only accelerate this demand.
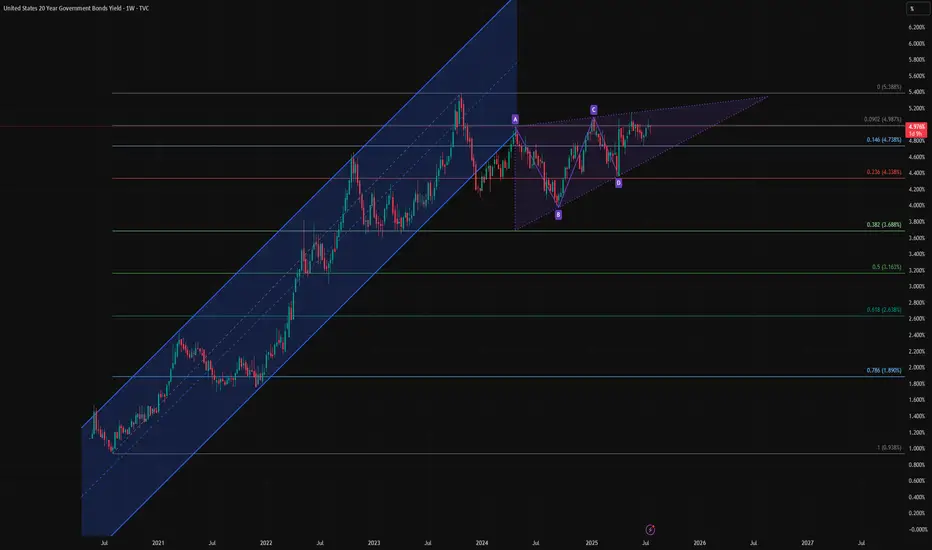
🔍 Technical Summary
Rising wedge pattern is nearing a potential breakdown — a bearish structure signaling exhaustion.
Price is failing to reclaim the previous uptrend channel, now acting as resistance.
A completed harmonic AB=CD pattern near recent highs suggests a mean-reverting move could be imminent.
Closest technical targets include:
4.33% (23.6% Fib)
3.68% (38.2% Fib)
Possibly even 3.16% (50% retracement) over the next 6–12 months if macro weakness persists.
📌 Bottom Line
The combination of:
Cooling inflation
A Fed pivot on the horizon
Rising recession risk
And technical exhaustion signals
Supports a bearish outlook for 20-year yields, meaning bond prices (especially long-duration instruments like TMF or TLT) could appreciate meaningfully from here.
US20Y trade ideas
Rates Poised For Another Leg UpRates pattern forming a reverse head and shoulders formation. Look for the 20 year at 5.25%


U.S. 20-Year Bond Yields and TLT at INFLECTION POINTDo with this information as you will, but yields are either near a breakout point or a rejection point. Overshoot possible before finding out.
Good-luck to you!
TVC:US20Y NASDAQ:TLT

Yields to go down IMMINENTLYDo you see it?
Inverse HnS forming with a down channel.
This formation will be confirmed with a failure at the 9 EMA.
Loaded TLT Calls for this move.

Bond Yield Short (a.k.a Long Bonds): End of Corrective A-B-CThis is a call for Bonds yields to stop rising and to start falling. What this means is that treasuries will go up. I expect this fall in yield to be strong and accompanied by a fall in stock market.
Stop is shown on the chart. This is a rather aggressive stop.

Another great opportunity to work with U.S. T-BondsAnother great opportunity to work with U.S. government debt in the short term.
We have all noticed that after the 50 basis point rate cut by the Federal Reserve, the reaction of the fixed income markets was mixed. Geopolitical and domestic issues did not allow institutional investors to act freely, leading to a reverse effect.
Currently, another 50 basis point cut is expected, and the treasury curve is in a flattening phase. Yields have risen again.
This is exactly what we call a great opportunity to re-enter the markets with 6-12 month expectations.
#UBT #TLT #UST #US20Y #US30Y

20yr yield breakout from C waveCurrently monitoring the 20yr bond yield. On this Chart. I've found a desc. Triangle breakout set up with a bullish wave count. Also notice the yield is at an oversold level for this time frame and below the cloud. I'm looking for the yield to retrace back up above the 5th elliot wave and close above 4.367at minimum before going higher.
Disclosure: I have puts on NASDAQ:TLT

Bear flag on 20yr treasure bondBear flag showing with overbought stoch rsi. Looking for a possible bearish continuation to higher time frames. Target 97 on NASDAQ:TLT

US20Y short: scaling inUS 20Y yield had hit my previously projected target (idea on 3rd May). Now I expect a corrective wave up in A-B-C and then a wave 1 = wave 3 move down (minimally).

Short 20Y Yield, long 20Y futures: Bias viewDisclaimer 1: This is a bias view. I think that 20Y yield (as well as 10Y) will be going down.
Disclaimer 2: Note that this is the 2nd time this year I am calling for longer duration yields to go down (linked in this analysis).
Analysis portion:
1. H&S formation.
2. Completion of double combination of zig-zag.

Golden Cross approaching for US 20 Year Bond YieldsGolden Cross approaching for US 20 Year Bond Yields in advance of the Federal Reserve's Wednesday Meeting and Friday's Unemployment and ISM PMI Reports. TLT to low 80's over next few weeks?

20 year bond yields entering Rotation DownwardAnother TLT play is about to start. The 20 year bond yields are rejecting off the channels resistance and will likely move back down to the 200 mda and maybe the bottom of the 4 months upward channel. TLT will respond inversely to this. I have been playing TMV and TMF back and forth since November. I'm up 70% over that time. I'll will likely buy into TMF tomorrow if the machines drop the 20 year off of the resistance. If so, then I'll be ready to dump at the 200mda if we look like we will reject off of it.
If the 20 year keeps bumping sideways off the top of the 4 month channel - then I'll be ready to buy into TMV once it breaks out above it.

20 year Bond Yield in 3 month Rising Channel to 4.77%20 year Bond Yield reversed in its' 3 month Rising Channel and is now rising to 4.77% due to inflation data in the manufacturing report. Will it break out this time? If so its' going above 5% again.

Bond yields recent uptick is crashing marketsBond yields recent uptick is crashing markets and also causing the TLT to drop. Bonds holders have sent their message to the Fed. Ball 🏀 now is the the FED's court

20 year Bond Yield and TLT Bear Flag vs Bull Flag on WeeklyThe 20 year bond yield is finishing up a 5 month Bear Flag Pattern and on the inverse TLT is finishing up a 5 month Bull Flag Pattern. The Bond Market smells a Fed Pivot in the works. I bought TLT on 3/21/24 and will hold until we reverse at resistance at $96.50. If we break through resistance at $96.50 then momma gets a new card baby because we are going above $100 and up.

Understanding Treasury Yields And Govt BondsUnderstanding yield curve correlations is essential for traders and investors seeking diversification and hedging opportunities across forex, indices, and commodity markets. The yield curve, a graphical representation of bond yields across different maturities, provides valuable insights into interest rate expectations, economic conditions, and market sentiment.
1️⃣ Understanding Treasury Yields and Bonds: Treasury yields represent the interest rates on government-issued bonds with varying maturities, ranging from short-term Treasury bills to long-term Treasury bonds. Bond prices and yields have an inverse relationship: as bond prices rise, yields fall, and vice versa. The yield curve plots these yields against bond maturities, typically ranging from one month to 30 years. Understanding the shape and dynamics of the yield curve is crucial for assessing the market's expectations for future interest rates and economic growth.
2️⃣ Interpreting the Yield Curve: The yield curve can take various shapes, including normal, inverted, and flat. A normal yield curve slopes upward, indicating higher yields for longer-maturity bonds, which is typically associated with expectations of economic expansion. An inverted yield curve, on the other hand, slopes downward, indicating lower yields for longer-maturity bonds, which may signal expectations of economic recession. A flat yield curve suggests little difference in yields across different maturities and may indicate uncertainty or impending market changes.
3️⃣ Yield Curve Correlations Across Markets: Yield curve correlations can offer valuable insights into market relationships and potential diversification opportunities. For example, correlations between the yield curve and forex markets may indicate the impact of interest rate differentials on currency valuations. Similarly, correlations between the yield curve and commodity prices may reflect expectations for inflation and economic growth. By analyzing these correlations, you can identify hedging opportunities and mitigate risks across different asset classes.
4️⃣ Identifying Diversification Opportunities: Diversification involves spreading investments across different asset classes to reduce overall portfolio risk. Yield curve correlations can help identify assets with low or negative correlations, offering diversification benefits. For example, if the yield curve is positively correlated with stock market indices, you may seek to diversify your portfolios by allocating funds to assets with negative or uncorrelated returns, such as gold or government bonds.
5️⃣ Utilizing Hedging Strategies: Hedging involves taking positions to offset potential losses in existing investments. Yield curve correlations can inform hedging strategies by identifying assets that move in opposite directions under certain market conditions. For instance, if the yield curve is inversely correlated with commodity prices, traders may hedge their commodity positions by taking long positions in treasury bonds or short positions in currency pairs correlated with the yield curve.
6️⃣ Yield Curve and Forex Markets: For example, consider a scenario where the yield curve steepens, indicating expectations of rising interest rates and economic growth. In this case, currency pairs with higher interest rate differentials may appreciate relative to those with lower differentials. Traders may capitalize on this by buying currencies with higher yields and selling currencies with lower yields, taking advantage of yield curve correlations to profit from interest rate differentials.
7️⃣ Yield Curve and Commodity Markets: Alternatively, suppose the yield curve flattens, signaling uncertainty or expectations of economic slowdown. In this scenario, commodities sensitive to economic growth, such as industrial metals or crude oil, may experience downward pressure on prices. Traders may hedge their commodity exposure by taking long positions in treasury bonds, which tend to benefit from safe-haven demand during periods of economic uncertainty.
Yield curve correlations provide valuable insights into diversification and hedging opportunities across forex, indices, and commodity markets. By understanding the dynamics of the yield curve and its correlations with different asset classes, traders and investors can optimize their trading and investment strategies to manage risk and capitalize on market trends.

20 Year Bond Yields - Breaking through Resistance to 6%?The 20 year Bond Yields has been in a channel since 12/2023. On the weekly, it has hit resistance twice and bounced off. We are approaching a third attempt to break through. Iff it does, whhen it does, its' going to 6%.

20 yr Bond Yield to 4.7% by March 22nd, 2024The 20 Yr Bond Yield will likely move to 4.7% by March 22nd, 2024 based on its' 12/2023 and 04/2020 Channels. Bought into TMV on 3/11/24 based on this reversal on Friday. Looks like this will be a 15% gain once TMV hits resistance next week.

US 20 Year Yield: Bearish Harami at Bearish Bat PCZThere is a Bearish Harami at the HOP level of a Bearish Bat with Impulsive RSI BAMM Confirmation. Alongside that, we also have 2 Major Squareups significantly below the current level and also an unfilled gap. If these Bearish Signals at the highs are to play along, this should be the start of an even greater retrace to fill the downside gap and to complete the square ups. This would likely come with some Bearishness in DXY and upside in the TLT which may also spillover into the IEF.

US20Y Analysis. I am bearish...Hello Everyone i want share my idea about US economic indicator.
US economic is very strong what we hear but when i am looking that that price action tell me they are falling.
This picture is simple, if my technical analysis will work here we have some strong RSI divergence, if indicator will drop below 50 LVL we will see some little trend change at lower timeframe but, if it will continue fall then we will see dollar fall too. Price were 3 times in overbuy, first and second time it fall but not too much and third time we have more clear divergences.
For my prediction i need close this month below of last month low and give me new low-high. then i will try short Dollar index. for that it need few weeks to see we are right or not but at the moment i think i am right.
BE PATIENT!!!

Observing Bearish Divergence in the 20-Year Bond MarketIn the world of finance and investing, keeping a watchful eye on market trends and indicators is essential for making informed decisions. Lately, I've been closely monitoring the 20-year bond market, and I've noticed some intriguing signals that could have far-reaching implications for the financial landscape.
What caught my attention is the presence of a significant bearish divergence pattern on the daily chart. This divergence suggests a potential shift in market dynamics, which could have ripple effects throughout the financial sector.
Bearish divergence occurs when an asset's price makes higher highs, while a key technical indicator, such as the Relative Strength Index (RSI), makes lower highs. In the case of the 20-year bond market, this divergence is becoming increasingly evident. This pattern typically suggests a weakening bullish trend and a potential reversal in the making.
One of the intriguing aspects of this bearish divergence is its potential to put pressure on overleveraged banks. When the bond market shows signs of weakness, banks holding substantial positions in bonds can face increased risks. Overleveraging has been a concern in the financial industry, and a downturn in the bond market could be a catalyst for addressing this issue.
However, here's where things get even more interesting. While the bearish divergence might suggest a market correction or even a bear market, I have a hunch that central banks might have a different playbook in mind. Instead of allowing a sharp market downturn, they could intervene with massive Quantitative Easing (QE) programs.
Quantitative Easing is a monetary policy tool used by central banks to stimulate the economy by purchasing financial assets, typically government bonds. By injecting liquidity into the market, central banks aim to lower interest rates, encourage borrowing and spending, and provide support to the financial system during challenging times.
In this scenario, central banks might use the bearish divergence as an opportunity to step in with substantial QE measures. By doing so, they could provide a safety net for the bond market, stabilize financial institutions, and prevent a market crash.
However, there's another twist to consider. Before initiating massive QE, central banks might strategically "flush out" leverage from the market. This could involve allowing a controlled market decline to clear out excessive leverage and speculative positions. Once the market has undergone this cleansing process, central banks could then step in with their QE measures to support a healthier financial environment.
In conclusion, the bearish divergence in the 20-year bond market is a noteworthy development that has the potential to impact various aspects of the financial sector. While it may indicate a weakening trend, it's essential to keep in mind that central banks often have tools at their disposal to mitigate the effects of market turbulence. Their actions in response to this divergence could be crucial in determining the market's direction in the coming months.
As an investor, it's essential to stay informed, closely monitor market trends, and be prepared for various potential outcomes. The financial world is dynamic and ever-changing, and being adaptable to different scenarios is key to successful investment strategies.

US20YR - The end is in sightBonds have been selling off at unprecedented rates for unprecedented lengths. The yield curve as started the un-invert indicating the recession is less than a year out.
The question remains if rates will remain "higher for longer" or if the flattening will include a swift fall in rates due to recessionary pressures, possibly leading to deflation.
If Steven Van Meters and Harry Dent 's predictions are (eventually) true then a play in TLT or TMF is warranted and would lead to gains in the multiples.
