US30Y trade ideas

US30- Something to Think AboutThe US30USD is reaching the end of a triangle, just a triangle. It is not certain if it is an ascending or descending triangle, so be very careful on the breakout and the direction it goes to. Wait for a retrace for entry and use proper risk management to be able to have an opportunity to gain many pips or lose little to none.


US30THERE WAS A CLOSE ABOVE A TRENDLINE, TIGHTER STOPS MIGHT DO WELL FOR THIS ASSET FOR NOW, BUT 109.22'S ARE POSSIBLE TARGETS


US30 Inverted Head&ShouldersReally simple set up, training your eye to spot these patterns in my opinion is essential for developing consistency with your trades. After seeing the reversal, which using the 1H and especially 4H makes these easier to spot. You can see where the left shoulder has formed, aligning with the right shoulder on the 61.8 level. Other than that, we notice the area was not only previous support, but resistance. This liquidity indicates an interest for movement around this level. The rest is all price action and patience.

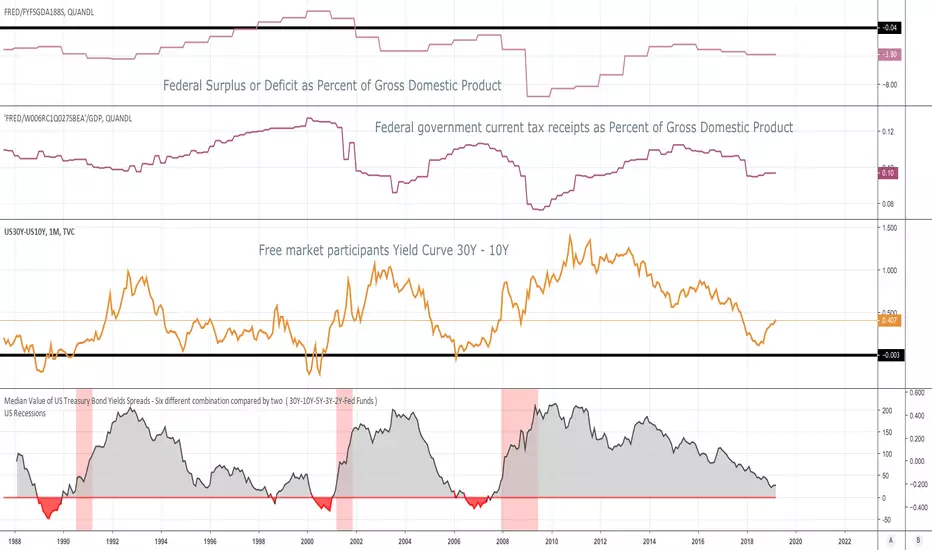
Will Trump tax cut be a short term impediment to end this cycle?Will the Trump tax cut be a short term impediment for the yield curve to invert? Based on this chart and some logic... Yes, it will. The previous Fed rate hikes and quantitative tightening has made some pressures to short maturity bond yield go up almost as long maturity bond yields but on the other hand, the US state deficit has increased because of the less current tax receipts based on the Trump tax cut.
In other to sustain the US state level, the US government must borrow more money and this ultimately IMHO will lead to a more flexible duration of different spread bonds, increasing, therefore, the duration of the current economic cycle. This process is notorious in the combination based only on free market participants of the 10-30Y Yield Curve as the current state is steepening.


Divergence between yield and index price actionAs it is known that bond prices are inversely proportional to their respective yield, a decrease in yield means an increase in the price of the bond. Right now we are seeing a continuous decrease in the 30-year bond yield (same goes for the 10-year bond yield_) even the indexes and the global markets as a whole have been going up. This means that bond prices are rising to show an increase in the demand for bonds. This is divergent because usually, the opposite happens. The markets doing well is usually shown by money moving out of low-risk long term bonds and into stocks.
The opposite can also be said. When the markets go down or economic uncertainty and risk is on the table, money flows out of stocks (and short term bonds) and into more secure long term bonds, increasing their price and decreasing the yield. The fact that indexes seem to be recovering but long term yields have continued to trend down is a big red flag and should risk should be considered before going long here.


US Bond Yields At Median lineLooking at the 30 years. There seems to be a lot of movement on the bond market that the financial media has been totally ignoring!
The bond yields reached a high of 3.46 November 2 2018!
These heights were broken when the price broke and Closed below the 3.4 level
The current yield is showing an uptrend. The uptrend is an extension of the Fibonacci area.


US30 (BOND) BUYSo looks like US30 will rally up towards the weekly retest region. Should be able to move upwards further due to the face that the 21 SMA has crossed over the 50 SMA suggesting a reversal in the pattern and now will create new HH AND LH.

THe most extreme yield curve tail ... better accuracy then 10-2Y03months to 30 years US treasury bond yields...


USD SHOULD FALL IN LINE WITH 30YR GOVERNMENT BONDSThe bond market is a place where traders can gauge the strength or weakness of a currency. Typically when looking at the US 30YR Government Bonds, if the price of the bonds increases it tells us that traders are willing to invest into the US economy for the long term. This then should show that the USD is likely to increase in price.
If the price of the bonds decrease it tells us that traders are unwilling to invest in the US economy for the long-term and that we should expect the price of the USD to fall.
Currently, the 30YR Bonds are struggling to increase any higher and we could likely see a fall in price back to the highs in May.
This tells us that the USD could fall lower in the coming weeks. Keep an eye out for this correlation and try looking at the past history using the compare tool here on TradingView.
