The Big Hedging is Coming; Bonds and VIX looking BullishThe market lately has been very unstable to say the least and has been willing to jump onto any boat it can in order to avoid inflation, However the price action we are seeing on the 30 YR seems to indicate that Inflation fears are overblown and that the Value if the Dollar index will likely remain stable.
While looking through the charts i noticed that there was an unusually high correlation between the 30YR Bonds and the VIX: Starting March 3rd 2014 as marked by the green vertical line on both charts. You can see that most Green Months in the 30 YR results in a Green Month in The VIX. I assume this is because many investors buy bonds in times of market uncertainty as a hedge against potential downturns in the value of equities and securities.
Todays Surge in Treasury Bonds could signal: A rise in Volatility to come, A downturn in the Stock market, and a Rise in both the Value and Confidence in the US Dollar.
US30Y trade ideas

BONDS Yields: Potential trouble ahead. Get ready! This is not a prediction. It's meant to be educational but it's an analysis.
Loads of traders are unaware of what the Bond markets mean. This post can't be a full exploration as it's a massive topic. Some self-driven independent study is required. I'll give a few snippets of what I understand in the form of a story.
The Bond Market (aka Treasuries) is the truly big one. It dwarfs the stock markets. The Bond Markets have reliably heralded what's likely to happen in the economy. This where the really big money is, and people put their money for very short periods, long periods or 30 or more years. A Bond is a loan. You lend your money. Somebody owes you money and interest. But you can sell a Bond, which the debt owed to you. Someone can buy off the debt owed to you if they think it's a good deal that you're offering. That depends on a whole load of things.
Now the Bond market is important because the big one is US Govt Treasuries. You lend money to the Govt over various periods and you expect a 'Yield' which is similar to interest. At the end of the term - unless you sell the Bond on - you expect to get your money back in full from thuh Govt (plus the 'interest' over the years of the term).
The trouble at the moment in the Bond Market is that the 30Y and 10Y bond yields are definitely rising. Last year, people were worried about Yield curve inversion, where long term bond yields fell low and followed short term yields bonds. Between about Aug 2019 and Feb 2020 long term yields were below the 2Y yield. That was crazy cuz it meant that putting your money with the Govt for longer was not much better than with a short term loan to the Govt. That happened when 'everything' went south and people thought the economy was gonna go bust.
Now something different is happening. Look at it. 30Y and 10Y yields have rocked north leaving behind the 2Y. What does that mean? The Yields on the 30Y and 10Y are important because it means that the US Govt have to offer a higher interest rate to attract the big money.
When good times are expected, bond prices fall as demand falls because people want to put their money in shorter term investments, where they think they can make more money, more quickly. Fewer people want to lend to the govt i.e. no pressing need for the best secure investments. They wanna take risks to make more! This is how it works - right? Well, this is probably not you - but the big money can take on risks better than you can. As a result the government has to pay a higher yield (interest rate) to attract investors, cuz they wanna go elsewhere. Higher yields therefore signify that sentiment in economic outlook is better. You should be punching the air - but not so fast.
Here's the problem. Bond yields set the stage for higher interest rates on loans elsewhere (- needs reading up). This is very simplified so may not be 100%, but it's broadly true. There are all sorts of issues like short-term interest rates and long term rates (they don't go hand in hand). But overall the Bond Market is the one to signal what's coming, in broad brush.
Who likes higher interest rates? Well, those with cash, in the minority- who want to lend to the have-nots, and squeeze the juice out of them. 😮😂 Who doesn't like higher interest rates? The people who have borrowed or will borrow money and have to pay back; in a majority. 😨😢
I've left out rates of rises of various Yield curves and an essay on Yield-curve inversions of different types. The important thing is to get more educated about all stuff related to Bonds.
Is hyper-inflation coming? I don't know. If you believe the FED, the answer might be 'no'. It's a big separate topic.
Okay- this is complicated stuff. I've left out about 20 things related to Bonds and Interest rates. What does it mean for you as a trader? Well you won't really get the full big picture if you just read this post. But the big picture is your business if you're trading on a 4H to 1D time frame in any market. If you're a short term trader in stocks or forex the tension is mounting in the backdrop with rising volatility which can take you out in the 5 min to 1h time frames when you least expect it.
If you think my broad understanding is incorrect. Do let me know and share with others so we can all learn. I always dare to be wrong. Let's have that discussion.
Stay safe. Mind your stop-losses. Don't burn good cash. Okayyy? 😉👍

US 30y yield meltupusing 30-days chart, the yield never surpassed EMA144, This time is different and will be END GAME for a fake economy based on house market loans


US 30-years yield melting upThe US 30-yrs yield formed a positive rainbow that will surpass 5% this year

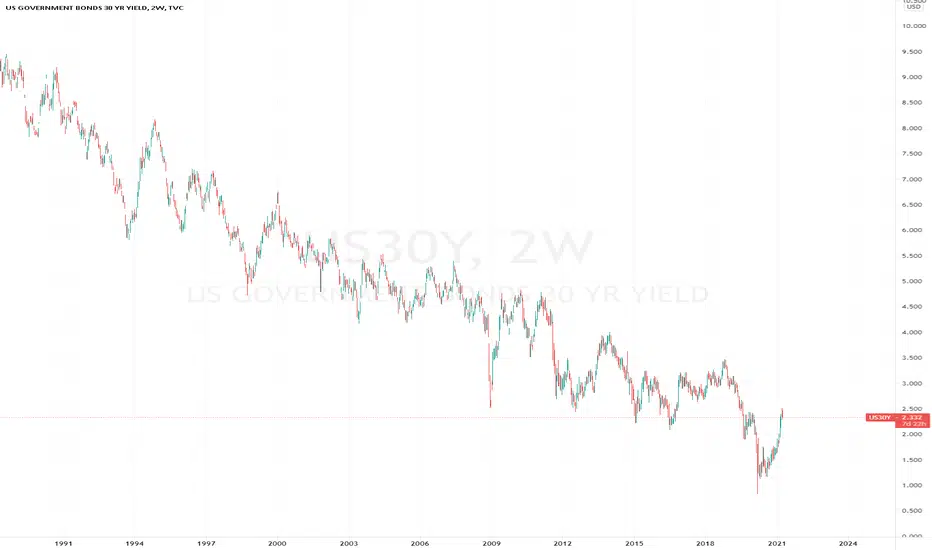
US30Y Time for bond yields to reverseThis is the U.S. Government Bond 30Y Yield from 1988 until today. I chose this hyper long-term chart on the 1M (monthly) time-frame as with bonds being the talk of the month as for reasons that may move stocks, Gold etc lower, I wanted to get a good understanding of what the real long-term picture is.
This illustrates a clear and standard Channel Down. I have applied the Fibonacci levels on it. As you see the price is now testing the 0.618 retracement level, which is exactly on the 1M MA50 (blue trend-line). The chart clearly shows that the MA50 and the MA100 (green trend-line have been acting as a Sell Zone since at least 1995 (where we can measure). We can see that only once over these decades did the price (marginally) break the 0.786 Fib (October/ November 2018). On all rejections within the MA50/100 Sell Zone, the price always pulled back to at least the 0.236 Fibonacci level.
That means that the upside is limited on the US30Y and we will most likely start seeing a bearish reversal soon.
** Please support this idea with your likes and comments, it is the best way to keep it relevant and support me. **
--------------------------------------------------------------------------------------------------------
!! Donations via TradingView coins also help me a great deal at posting more free trading content and signals here !!
🎉 👍 Shout-out to TradingShot's 💰 top TradingView Coin donor 💰 this week ==> xBTala
--------------------------------------------------------------------------------------------------------

Yield Curve Hoping for 10y yield to retreat relative to 30y yield, which would usher more strength and stability. Seems contingent on a sub 1.5 10y yield. The falling wedge gives me a lot of hope despite a false breakout near the end of January.

Is inflation coming? In short, we don't think so.
In the chart above, you're seeing the 10y30y spread and the 10y yield.
The 10s30s is a barometer of the inflation risk premium.
And quite frankly, the market isn't buying that inflation will be sustained.
Yes, the 10y yield is indicating perhaps to many that there is some kind of inflation risk, but from the Macrodesiac view, all that is being exhibited here are base effects.
Take a look at the US 10 year yield (the risk free rate of return) over the last 20 years, and come to a conclusion as to whether we are in an abnormal market or not.
The upper bound is likely capped at 2-2.5% at the max.
This would not inspire the extent of inflation that many are warning about, and the Fed is consistent with this view as well.
An excerpt taken from the Macrodesiac note yesterday...
'Back in late August last year, Powell stepped up to the podium at Jackson Hole (well, it was online), where he outlined a different policy path of Average Inflation Targeting.
Here's where an understanding of that above paper comes into play.
" f inflation runs below 2 percent following economic downturns but never moves above 2 percent even when the economy is strong, then, over time, inflation will average less than 2 percent.
Households and businesses will come to expect this result, meaning that inflation expectations would tend to move below our inflation goal and pull realized inflation down.
To prevent this outcome and the adverse dynamics that could ensue, our new statement indicates that we will seek to achieve inflation that averages 2 percent over time.
Therefore, following periods when inflation has been running below 2 percent, appropriate monetary policy will likely aim to achieve inflation moderately above 2 percent for some time."
It's all about signalling.
The central bank can't automatically push prices up.
They can only provide behavioural signals to the market to either consume or save.
That is it.
The problem comes when there are broader issues at hand that might make the actual mechanism of achieving policy goals, defunct.
The main one that I have been focusing on of late is of course demographics, and the labour market, which are intertwined.'
Now, let's talk about those demographic issues.
Below is the labour force participation rate for the US.
What I would like to know is how inflation is to be sustained when we have 2% of the available workforce that have taken themselves out of even looking for work on a year on year basis?
You can provide all the stimulus checks you like, but all that is doing is providing a push back to a prior baseline - if fewer people have incomes, there is less consumption, so one of the primary drivers of inflation is dampened.
And with regards to the recent NFP figure of +376,000 new jobs being created in a month, we would have to see that figure be printed month on month until April 2023.
Not so inspiring, is it?
Your eyes may now switch to the savings rate as a critique of what I am suggesting.
The problem here is that this is a ridiculously skewed measure too.
For retirees and the highest income earners, they have captured most of this increase in savings.
But for the poorer income quartiles, they have experienced a broader deterioration in their household savings rate.
When you look at data on consumption broken down by income, you find that the highest marginal propensity to consume segment is the richest households with low liquid savings and high illiquid savings...
But right now, they have both.
The next highest (and is generally consistent through time) is the lowest and middle households.
However, they do not have spare cash to spend!
The pent up demand argument is failing, and I'd argue is more a bubble in financial media and commentators where they are on higher salaries, their family members are too and they (me too) have largely been shielded from the economic fallout of the past year.
Now, I've also got into debates around something a little more concerning too, and that is to do with TIPS (Treasury Inflation-Protected Securities).
You might not have heard of this, but it's effectively a way to protect yourself against the rise of inflation.
I'll take another excerpt from the note written yesterday...
'There's a big problem with this measure.
The Fed has been buying Treasury Inflation-Protected Securities!
The Fed’s buying of TIPS could drive down TIPS yields and drive up the breakeven measure of inflation expectations.
So what we are perhaps seeing here is the market using a key measure of inflation expectations to gauge the macro picture moving forwards, without actually realising that it's distorted.
'But breakevens are high!' is probably the reply that you might get back if you mention a number of factors that contend with the longer term inflation view.
My question then would be to ask whether this would have some effect across the nominal yield curve, causing yields to spike higher and with greater speed, than they should?
This paper might prove key to answering what's going on here.
"Such expectations proxy a situation in which the public does not understand the full structure of the economy and, hence, cannot anticipate the implications of policymakers’ intention to make up for past deviations of inflation from its objective.
By varying the number of economic agents (and, hence, components or blocks) in the FRB/US model who use VAR-based rather than model-consistent expectations, we can adjust the extent to which the public understands policymakers’ commitment to a makeup strategy and the degree to which aggregate economic variables react to news about the future."
The paper concludes with...
Makeup strategies work best when the public understands, believes, and reacts to policymakers’ commitment to offset misses in inflation from the 2 percent objective in the future.'
What we are currently seeing in the market, from my point of view, is merely the Fed signalling that they want to make up for missed inflation goals over the past year and probably before as well.
Now they have the fiscal support, it sounds to them like it might be the right time to do so.
This is most notably seen through Powell's speech at Jackson Hole back in August where he introduced the Fed's new mandate of 'Average Inflation Targeting'.
What I would wonder, specifically to do with TIPS, is whether traders know that the Fed has distorted the TIPS market, since 5y5y inflation swaps have followed it, and have almost gone in lockstep with the Fed's holdings of TIPS.
This would be cause for concern, and if it is understood, alongside the waning macroeconomic indicators, then this would provide a strong basis for the current differentials in rates pricing, and for the inflation narrative to subside.
Welcome normality.

Bonds and the troubles of economically advanced societiesBefore I begin, bonds are warning of something monstrous, they are signaling inflation and freezes everywhere. With that said, I'm glad to see some buying has happened over the last week or so. Look, liquidity is dead, the FED is our new liquidity. Inter and intra bank lending is also dead. so who is buying bonds? I'm not holding bonds, are you? I want to know, I think the FED is the majority buyer and seller of last resort, including bonds. Now this TGA account 1.1T drain is something interesting the bond market reacted to. There has been a lot of speculation as to what moves the market. This is where my re evaluation was needed. I dont think that FED brrrrrrrrr printer matters AT ALL. I think this market is so in need of money after a full year of rona, that EVERYONE is hoarding cash. This means brrrrrr does not matter because it is leaving the market too quickly, but stimulus.... Stimulus just moved the market today after 2 generally bad weeks on the market (for bulls). Some spending happens before people save their stimmy. THIS IS BAD, and I think the bonds know it BIG TIME. To hedge i would recommend you understand the asset pie and be diversely invested. I do think silver will be the poor mans saving grace, just like every time before in history.

US30Y Yield @ 0.06%? Be ready to be the long the long bond.The US30Y yield has only gone in one direction for the last 30+ years, down.
Using the TradingView monthly price history, the US30Y yield peaked in Oct 1987 at 10.234%.
Every successive period has seen lower highs on the US30Y yield. The most recent peak in Oct 2018 was at 3.466%.
Using Fibonacci analysis, the successively lower highs from the Oct'87 peak have all respected key Fibonacci levels on the way down.
The falling trend line from Oct'87 to Oct'18 would imply that the next high will be at or below the next key 0.236 Fibonacci level.
You will notice on my chart that I have placed the bottom of the Fibonacci sequence analysis at a level that has never been reached before.
I chose this 0.059% level based on the 0.618 retracement of the Oct'18 peak (3.466%) to the Mar'20 low (0.812%) is 2.452%. This would align the long-term 0.236 level with the Golden Ratio at 0.618 for the most recent retracement from the Oct'18 peak (3.466%) to the Mar'20 low (0.812%).
You could call this 'fun with Fibonacci numbers' but when I look at the 30+ year trend, it is hard to foresee a scenario where we don't continue to see lower highs on the US30Y yield, and this long-term trend remaining in place.
I am happy to hear any feedback.

COLLAPSE in long bond YIELD and MAJOR liquidation in stocks!!!The charts are clearly telling you we are heading for major deflationary event despite what the media keeps pumping and yelling inflation is coming. They don't want you to hold cash when the biggest opportunity comes. They want you to stay broke through the opportunity. DXY and bonds are going to do very well. So I will be converting them back to stocks when stocks go into undervalue territory.

The US bond market is selling off and rates are going upThis pattern has strength and indicates that higher rates will be here to stay for quite a while. This could cause issues in other markets and the dollar strength.

Yield Curve and Precious MetalsAdditional comparison with the MOVE index, a sister to the VIX which measures volatility in bonds (as opposed to the S&P500). The fed may be forced to control the yield curve, a move that many see as inevitable and generally, positively correlated with the precious metals' performance. I'll add to this thread as I learn more, interview with danielle dimartino booth on palisades is inspiring and eye-opening!

30 YR BONDS ANALYSYou can see bonds are in overbought. But if it wants to test main trend(blue line) which is coming from 1995 we can see more bear trends in assets. (Except bitcoin =))

30 yr yieldYields increasing in 5, 10, 20, and 30 yr. 30 yr yield is already above pre-COVID levels.


US30YPrice is at important resistance level if it breaks it short USD for a long time.
Note that price didn't break of a long term downtrend back in late 2018 when economic conditions were much better than they are currently.
But maybe this time is a charm.

30 Year Rates climb higherDespite Stocks heading higher, 30 Year Yields are also climbing about to hit 2% - a level they were last at in Feb 2020.
US CPI prints this week will be very interesting to see if the momentum continues

TLT BULL CASE THESISUS30Y rates forms rising wedges throughout its history before falling.
Short Term rates always dictate the Long Term rates

US Government Bonds 30YR Yeld (US30Y)Record treasury auctions and yields falling again, which brings us back to the legendary October of 2018. But bond yields have been rising for the past several months and perhaps investors should pay attention, especially as we grapple with questions about inflation and the broader economy.So is inflation and economic growth back in play? Powell said an interest rate hike "is not in the short term," pointing out that there may be upward pressure on prices in the short term, but a one-off hike does not mean "persistent inflation."

