Consolidating the UFT trendApril is the month of the strongest seasonal growth in the first half of the year. In the first half of the month, the probability of purchase disruptions prevails against the background of the negative closing of the last quarter, however, as we approach the middle of the month, the probability of a stable bullish trend with a sharp reversal for individual coins will begin to increase.
Today I want to once again draw your attention to uft, which gave you two waves of 40-50% each and good opportunities to slip up. Unfortunately, we did not see a stable reversal on the quarterly candle due to the negative overall market dynamics and the falling altcoin index. However, the new quarter opened above the strong 0.075 support, which provides an opportunity for a hike to 0.15 and a stable trend. Purchases from the current 0.05 level can bring up to 3-5X in the absence of delisting and the beginning of a trend.Also, in the second wave, a breakout signal is left, and in the case of an exit above 0.11 from the third wave, there is a high probability of a trend to retest 0.21-25 with intermediate resistance at 0.150-175. A similar pattern has already worked out last week on a smaller timeframe.
Vib troy pda alpaca voxel cream can also show powerful growth impulses among coins with the monitoring tag and fio pivx bifi among coins without the tag. Coins with the monitoring tag often show good dynamics in the second half of the week due to the low probability of delisting. In the first half, it is worth keeping a stop loss close to the price in case of delisting until noon.
UFTUSDT trade ideas

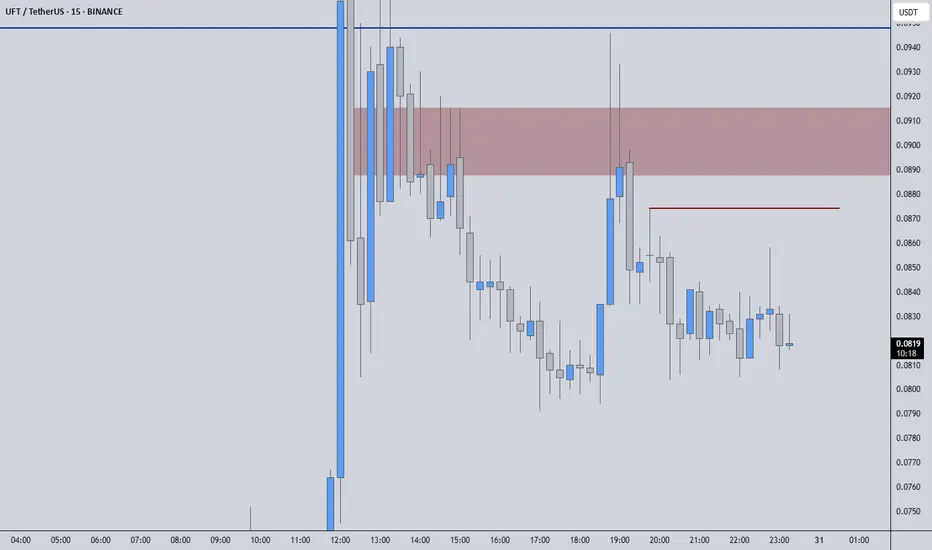
UFTUSDT – High-Precision Short Opportunities!UFTUSDT has faced a sharp decline, confirming the accuracy of our pre-identified key levels. Now, we focus on the red box and red line as prime shorting zones. This is not guesswork—these levels are carefully selected using Volume Footprint & Time Price Opportunities, tools that most traders don’t even understand.
🔥 Key Trading Strategy:
✅ Red Box & Above Red Line = Short Opportunities
These areas have historically acted as strong resistance, and without a breakout with volume, they are ideal for potential reversals.
✅ Risk Tolerance Matters
For a more conservative approach, wait for a rejection at resistance. If you prefer more aggressive entries, every downward breakout from key levels could be an additional opportunity.
✅ Confirmation is Everything
Blind entries are amateur moves. Every position should be backed by CDV analysis, volume profile validation, and LTF breakdowns. That’s how professionals trade.
📌 Why My Analysis Stands Out
This is not just charting, it’s high-level trading backed by data and years of expertise. My levels are not random lines; they are calculated, tested, and used with high precision. You can check my high success rate from my profile. Most traders don’t have access to these techniques, and that’s why they struggle.
Don’t trade like the crowd, trade with an edge. Follow the plan, follow the data, and dominate the market.
📌I keep my charts clean and simple because I believe clarity leads to better decisions.
📌My approach is built on years of experience and a solid track record. I don’t claim to know it all but I’m confident in my ability to spot high-probability setups.
📌If you would like to learn how to use the heatmap, cumulative volume delta and volume footprint techniques that I use below to determine very accurate demand regions, you can send me a private message. I help anyone who wants it completely free of charge.
🔑I have a long list of my proven technique below:
🎯 ZENUSDT.P: Patience & Profitability | %230 Reaction from the Sniper Entry
🐶 DOGEUSDT.P: Next Move
🎨 RENDERUSDT.P: Opportunity of the Month
💎 ETHUSDT.P: Where to Retrace
🟢 BNBUSDT.P: Potential Surge
📊 BTC Dominance: Reaction Zone
🌊 WAVESUSDT.P: Demand Zone Potential
🟣 UNIUSDT.P: Long-Term Trade
🔵 XRPUSDT.P: Entry Zones
🔗 LINKUSDT.P: Follow The River
📈 BTCUSDT.P: Two Key Demand Zones
🟩 POLUSDT: Bullish Momentum
🌟 PENDLEUSDT.P: Where Opportunity Meets Precision
🔥 BTCUSDT.P: Liquidation of Highly Leveraged Longs
🌊 SOLUSDT.P: SOL's Dip - Your Opportunity
🐸 1000PEPEUSDT.P: Prime Bounce Zone Unlocked
🚀 ETHUSDT.P: Set to Explode - Don't Miss This Game Changer
🤖 IQUSDT: Smart Plan
⚡️ PONDUSDT: A Trade Not Taken Is Better Than a Losing One
💼 STMXUSDT: 2 Buying Areas
🐢 TURBOUSDT: Buy Zones and Buyer Presence
🌍 ICPUSDT.P: Massive Upside Potential | Check the Trade Update For Seeing Results
🟠 IDEXUSDT: Spot Buy Area | %26 Profit if You Trade with MSB
📌 USUALUSDT: Buyers Are Active + %70 Profit in Total
🌟 FORTHUSDT: Sniper Entry +%26 Reaction
🐳 QKCUSDT: Sniper Entry +%57 Reaction
📊 BTC.D: Retest of Key Area Highly Likely
📊 XNOUSDT %80 Reaction with a Simple Blue Box!
📊 BELUSDT Amazing %120 Reaction!
I stopped adding to the list because it's kinda tiring to add 5-10 charts in every move but you can check my profile and see that it goes on..
UFT are preparing for a trend reversalFollowing the alpaca testing, OG is ready to give a similar picture with an attempt to overtake the previous impulse. The previous impulse has already rechecked the opening level of the year with a local overlap, which opens the way for a test of levels 6 and 7.5. With the current market and the continuing likelihood of a new general drawdown, we are unlikely to see a hike above 6 on the first attempt. On the eve of passing through the middle of the quarter in the next two or three days, there is a high probability of a breakdown attempt of 5 with a stable continuation of the trend until the end of the month. With a more negative market, the volatility of the token may not be sufficient for a breakdown, in which case the probability of smooth growth prevails until the end of the month with a chance to open a new monthly candle above 5.
In the medium term, the token remains a reliable tool for storing funds, as the year opened above the 4.75 support near the key level for volatility growth of 5. Such an opening gives a flat signal for a retest of loyals due to an opening below 5, but also an exit to the 5-7.5 range in the medium term due to an opening above 4.75. Full-time support for a reversal With the current market, it is 3.5, from which there is a probability of a trend up to 7.5+ before the summer. There is a possibility of a test of a lower level of 2.5, but this will happen only in an extremely negative market with a drawdown of bitcoin by 75k or ether by 1500-1750. In this scenario, the token is likely to remain fairly stable and will give a smaller drawdown relative to the rest of the altcoin market, providing an excellent opportunity for topping up.
Along with og, vidt vib PDAs occupy an interesting position, which I primarily consider for storing funds in the mid-range due to the opening of the annual candle above key levels, which gives a signal for its bullish reversal in the future. The main goal for them, similar to alpaca and og, is so far a retest of the opening of the year followed by a rollback.
I am also considering uft wing slf burger ast quick pivx for scalping with a continuing growth potential of up to 30-50%.
Coins with the tag monitoring vite hard cream amb troy with a growth potential of up to 100%+ also retain a high potential for breakouts. Let me remind you that when working with these assets, I recommend keeping a short stop under the price in the first half of the week until noon to insure against delisting, or to hire them from the middle of the week.

UFTUSDTWe can attempt to buy UFTUSDT from specified level as it makes HL , also 0.786 FIB level intact indicate that it moves upward.
SL , TP mention in chart.

UFTUSDT: 126% VOLUME SPIKE DAILY | DONT SLEEP!UFTUSDT has witnessed a 126% increase in volume within 24 hours.
While buyers appear to be active, it is important to note that this is a low market cap coin, meaning the price may continue to decline despite buyer activity.
For potential trades:
Monitor upward breakouts from the blue boxes on the chart.
Pay attention to stable 1-hour breakouts from each region, as these may indicate stronger movements.
Since buyers are already showing interest, the price has the potential to react positively. However, always manage your risk and approach with caution.
Let me know if you’d like any edits!
I keep my charts clean and simple because I believe clarity leads to better decisions.
My approach is built on years of experience and a solid track record. I don’t claim to know it all, but I’m confident in my ability to spot high-probability setups.
My Previous Analysis
🐶 DOGEUSDT.P: Next Move
🎨 RENDERUSDT.P: Opportunity of the Month
💎 ETHUSDT.P: Where to Retrace
🟢 BNBUSDT.P: Potential Surge
📊 BTC Dominance: Reaction Zone
🌊 WAVESUSDT.P: Demand Zone Potential
🟣 UNIUSDT.P: Long-Term Trade
🔵 XRPUSDT.P: Entry Zones
🔗 LINKUSDT.P: Follow The River
📈 BTCUSDT.P: Two Key Demand Zones
🟩 POLUSDT: Bullish Momentum
🌟 PENDLEUSDT.P: Where Opportunity Meets Precision
🔥 BTCUSDT.P: Liquidation of Highly Leveraged Longs
🌊 SOLUSDT.P: SOL's Dip - Your Opportunity
🐸 1000PEPEUSDT.P: Prime Bounce Zone Unlocked
🚀 ETHUSDT.P: Set to Explode - Don't Miss This Game Changer
🤖 IQUSDT: Smart Plan
⚡️ PONDUSDT: A Trade Not Taken Is Better Than a Losing One
💼 STMXUSDT: 2 Buying Areas
🐢 TURBOUSDT: Buy Zones and Buyer Presence
🌍 ICPUSDT.P: Massive Upside Potential | Check the Trade Update For Seeing Results
🟠 IDEXUSDT: Spot Buy Area | %26 Profit if You Trade with MSB

UFT ANALYSIS (1D)You can see the chart based on liquidity pools. On the left side, a large pool has been hunted and the reaction was a long shadow.
The price is creating a pool on the right side of the chart to hunt this pool and reach the origin of the previous hunt.
In this range (green range) we are looking for buy/long positions.
Closing a daily candle below the invalidation level will violate the analysis
invalidation level:0.1627
For risk management, please don't forget stop loss and capital management
Comment if you have any questions
Thank You

Trading Signal: UFTUSDT MovementPair: UFTUSDT
Direction: Sell
Enter Price: 0.2464
Take Profit: 0.24336667
Stop Loss: 0.25226667
We have detected a potential short-selling opportunity for the UFTUSDT trading pair using the EASY Quantum Ai strategy. This strategy analyzes several factors that contribute to this forecast.
Firstly, recent technical analysis has highlighted a downward trend momentum, supported by moving averages signaling a bearish crossover. Momentum indicators, such as the Relative Strength Index (RSI), are showing overbought conditions which often precede downward corrections.
Secondly, macroeconomic factors are influencing market sentiment. There are ongoing concerns about economic instability, which could impact riskier assets like cryptocurrencies. Traders are shifting towards a risk-off approach, which typically leads to a sell-off scenario.
Therefore, based on the insights provided by the EASY Quantum Ai algorithm, we recommend entering a sell position at the price of 0.2464 with a take profit target at 0.24336667 and a stop loss at 0.25226667. This setup provides a favorable risk-to-reward ratio, allowing traders to capitalize on the anticipated downward movement.
Ensure to monitor the market closely for any changes that might warrant an adjustment of this strategy. Happy trading!

UFTUSDTWe can attempt to short UFTUSDT from specified level as it break HL , also there is bearish divergence occur indicate that it moves downward.
SL , TP mention in chart.

UFTUSDT.1DAs I analyze the daily chart of UFT/USDT, several key patterns and levels stand out to me.
Resistance and Support Levels
Resistance Levels:
R1: The first significant resistance level is around $0.2499. This level aligns with previous highs and acts as a potential target if the bullish momentum continues.
R2: The next major resistance is around $0.3567, which marks a higher resistance point observed on this chart. This level will likely serve as a strong barrier to further upward movement.
Support Levels:
S1: The initial support level is at $0.2499, where the price has shown a tendency to bounce back after recent declines.
S2: A more robust support level is at $0.2520. If the price falls below this, it might indicate a more prolonged bearish phase.
Technical Indicators
Relative Strength Index (RSI):
The RSI is currently at 42.46, which is relatively neutral but leaning towards the lower side. This indicates that the market is neither overbought nor oversold at the moment. A move above 70 would suggest overbought conditions, while a drop below 30 would indicate oversold conditions.
Moving Average Convergence Divergence (MACD):
The MACD line is slightly above the signal line, with values of 0.0007 and -0.0137, respectively. This suggests a potential bullish crossover, which could lead to upward price momentum if confirmed by further movement.
Trend and Pattern Analysis
I have observed a harmonic pattern forming, which suggests a potential reversal zone around the current price levels. The completion of this pattern indicates that the price might head towards the resistance levels mentioned above.
The price has recently broken above a downward trendline, which adds to the bullish sentiment. If this breakout holds, it could pave the way for a move towards R1 and possibly R2.
Market Sentiment and Predictions
Given the current setup, my expectation is for UFT/USDT to test the resistance at $0.2499 in the short term. A successful break above this level could see the price aiming for the $0.3567 resistance.
Conversely, if the price fails to maintain its current levels, it might retest the support at $0.2520. A break below this could drive the price down towards the lower support levels.
Conclusion
In conclusion, while the overall sentiment appears cautiously bullish, it is crucial to monitor the key support and resistance levels. The RSI and MACD indicators support a potential upward move, but confirmation from price action is essential. I will keep a close watch on these levels and adjust my strategy accordingly.

UFTUSDT.2HLet's conduct a technical analysis of the UFT/USDT chart you've provided:
Timeframe: The chart shows a 2-hour timeframe which is useful for short to medium-term trade analysis.
Ichimoku Cloud: The price action is below the Ichimoku Cloud, indicating a bearish sentiment. If the price remains below the cloud, it may continue to face resistance on upward movements.
Resistance Levels (R1, R2): There are two resistance levels identified on the chart. The R1 level is quite close to the current price, suggesting that the price might consolidate around this point before any potential upward or downward movement. The R2 level is significantly higher, which the price would need to break through for a confirmed bullish trend.
Support Level (S1): The S1 support level is substantially lower than the current price. If the price breaks this support, it could indicate a stronger bearish trend, potentially leading to further declines.
RSI (Relative Strength Index): The RSI is hovering around 41.26, which is just above the traditionally oversold boundary of 40. This could imply that the market is in a bearish phase, but nearing a point where we might expect buying interest to increase.
MACD (Moving Average Convergence Divergence): The MACD line is below the signal line, and the histogram bars are below the zero line, both indicating bearish momentum. Traders would look for a crossover above the signal line as a potential early indicator of changing sentiment.
Price Trend: The price has been making lower highs and lower lows, which is characteristic of a downtrend.
Volume: The volume isn't visible on the chart; volume data would help confirm the strength behind price movements.
Conclusion:
In summary, the UFT/USDT pair appears to be in a bearish phase, with the price below the Ichimoku Cloud, the RSI in the lower half of its range, and the MACD indicating downward momentum. The resistance levels above may cap upward movements unless a significant change in market sentiment occurs. The support level suggests a possible floor in price, where we might expect some buyers to enter the market. Traders should keep an eye on these technical indicators for signs of a reversal. It’s also important to consider broader market trends, news, and other fundamental factors when making trading decisions. As always, managing risks and using stop losses can help mitigate potential losses in volatile markets.

UFT - Unilend breaking stage 1!UFT broke an important level, which is confirmed today above 0.75$ level, that's great because Unilend is out from his stage 1, and it can lead far above if volumes start to come in.
We have several potential possible targets around this coin, but the best one is around 1.15$, which is a natural resistance barrier where the price can pause his bullish momentum.
Let's see if goes there!
Good trading!

UFT - Consolidation turns bullish?UniLend - we can see the full chart from MEXC - is easy to observe the long consolidated period
This slow accumulation period may come to an end.
My fib targets are on this chart as always.
This can pump without many signals beforehand
UniLend is a permission-less decentralized protocol that combines spot trading services and money markets with lending and borrowing services through smart contracts.

UFT about to explode! 10-30% profit in the short term!UFT is bouncing back from a strong support trendline!
A large ascending triangle pattern is forming!
Breakout and price increase expected soon!
10-30% profit in the short term is not out of reach!
⏰Don't miss out!
❗️Disclaimer: This is just a personal analysis and is not considered financial advice.
#UFTUSDT #Binance #analysis #crypto #profit #investment

UFTUSD 1WUFT ~ 1W 📈
#UFT Make purchases gradually from here, ATH will only be formed soon after this resistance is successfully penetrated. 🚀

uft can repeat the vib patternA large wave of growth took place on uft and the price consolidated on the support of purchases. At the moment, a bullish triangle has formed on the day and 4 hours, which gives the probability of a breakdown in the near future. On the weekly chart, a bottom has formed on the scale of the month and year, which gives ground for a stable reversal of the current annual candle and the five-year plan in the future. The intermediate range is 0.35-40, which I think you can skip quite confidently. After fixing above, we can expect a confident transition to the main target range of 0.50-75 with further attempts to break above 1.0. Similarly, vib has a probability of breaking 1.0 at once. Uft remains an option with top growth potential together with ooki vib pros perl pnt cvp dock wtc drep vite epx fio oax.


UFTUSDTUFTUSDT is in bearish trend.
Potentially printing LH and LL.
No sign of reversal here.
We buy at CMP.

trend reversal set up ufa usdt ufa usdt if the price go above 0.27 then i think all target will be done

