DeGRAM | UKOIL pullback tradeUKOIL reached resistance, and it created AB=CD pattern.
The market is trading in the ascending channel, indicating the bears are running out of steam and the bulls are in control.
Price broke and closed above the resistance at 84.00 which became the support level.
We expect a pullback, then a bullish move.
-------------------
Share your opinion in the comments and support the idea with like. Thanks for your support!
UKOIL trade ideas


UKOIL - H4 Short After a bearish leg yester and a 4 hour pullback, this might indicates a continuation to the downside. Lets see where it goes.

CRUDE OIL BRENT/WTI SELLINGHi Oil Traders,
This is our master plan to Rob Crude oil Barrels. Guys U can enter to Rob this oil at entry level i have mentioned or place your sell stop below my entry level this is our master plan. Our target is Trap area.

The correlation between oil and gasolineDear analysts and traders,
I hope you are doing well and are motivated for the week ahead. I wish you all the success in your business endeavors. Remember that success in trading lies in consistently defining and sticking to your rules.
As someone interested in the Elliott Wave Principle, I find it to be an invaluable tool for market analysis. I have developed my approach by combining this principle with my personal experience and by considering different scenarios that are likely to occur in the market. It should be noted that I do not like to be surprised in the market, and that's why I have different market prospects. I follow them to be sure and recognize the structure that is forming so that I can 100% recognize it.
I will share my analysis with you, but please note that I am not providing any buy or sell signals. My perspective on idea analysis is completely unbiased, so if the idea analysis meets your standards, you can use it as a guide to make an informed decision.
I have attached my previous analysis of the same market so that you can compare and see the differences. All the details of my analysis are clearly labeled, making it easy for you to understand. However, having a basic familiarity with the Elliott Wave Principle theory will help you understand the analytical idea more easily.
I have been studying the Elliott Wave Principle for almost three years now, and over time, my understanding of this knowledge and experience has grown. What I have achieved so far is the legacy of a genius called Ralph Nelson Eliot, and I am really happy with my progress. May peace be upon him.
Thank you for your support so far. I will always remember your kindness. Please share your comments and criticisms with me.
I hope my analysis will be useful to you in your business journey, and I wish you all the best.
Sincerely,
Mr. Nobody

#OIL Price at profit taking placeHello everyone,
I'm thrilled to share my 101st analysis here, marking a significant milestone in my journey. While there were certainly some analyses that didn't pan out as expected, I believe the ones with better results outweighed them in total. I'd like to express my gratitude to those who supported the ideas, left comments, or liked the analyses. Your engagement motivates me to continue improving the quality of my work.
Now, let's delve into the analysis of the Oil price, as it has reached a crucial price level where profit-taking activity may occur, potentially leading the price lower.
As shown in the chart, not only has the price reached a bearish trendline that previously held it at lower levels, but we are also currently at the one-to-one price target projection of an inverted head and shoulders pattern , a level where many pattern traders would consider taking profits.
It's worth to note that as soon as the price reached this area, it encountered some bearish pressure and failed to sustain its bullish momentum.
At present, based on my strategy, I don't have any bearish signals or triggers. However, with a bit more patience, I believe a good opportunity may present itself soon.
If you've found this analysis helpful, please take a moment to like, comment, or share your thoughts with me.

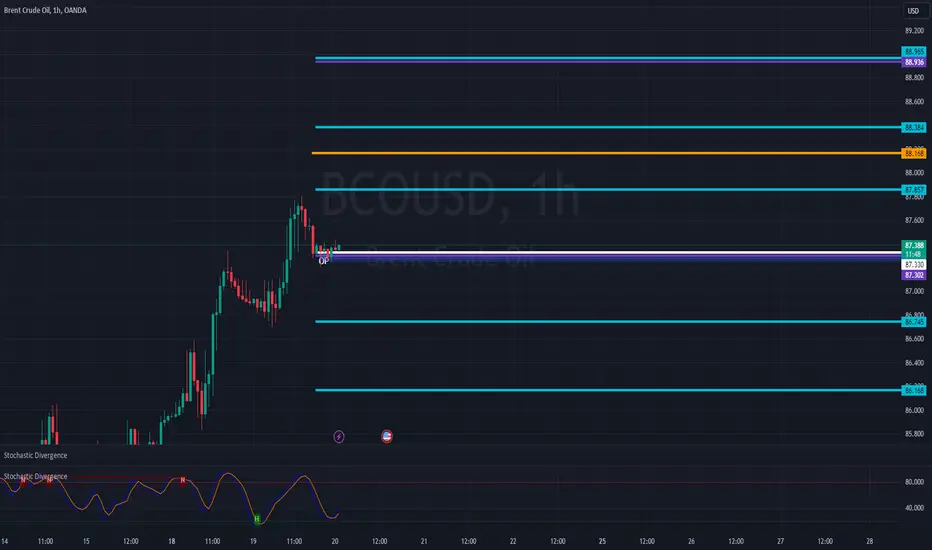
#Oil Algo LevelsSharing the algo levels for brent oil - cyan color is daily levels, purple levels are weekly levels and orange levels are monthly levels. The higher the timeframe, the stronger the levels. In general, above OP and PZ, bias is to the upside and vice versa.
Professional technical analysis and my own trading setup.After a long absence from TradingView, here is a new update, related to the type of analysis I do every day on US Oil and UK Oil (although this type of analysis could be done on any market available on TradingView).
In this video, I provide some basic explanations, mentioning the type of indicators used and how the information is put into context, in order to trade successfully.
I have now been trading US Oil for 25 years, a quarter of a century (!!), and I still love trading as much as I did on my very first day, 25 years ago.
Wishing you a great week.

BrentBrent has broken the strong resistance at 84.000 after few weeks of struggle which has formed head and shoulders pattern , and now heading to the next resistance level at 88.000 and based on my strategy I’m going to place sell order around 88.000
Chart explain better. This is not a signal it’s my opinion.

Strifor || BRENT-14/03/2024Preferred direction: BUY
Comment: After a very long accumulation in oil, most likely the buyer is ready for the long-awaited growth. According to the results of yesterday's trading, the price was fixed at the highs, which indicates the strength of the buyer against the backdrop of growing market sales.
In this regard, we maintain a strong buy priority towards levels 86 and 87 . Both scenarios are displayed on the chart, where scenario №1 is more likely.
Additional comments on this trade will be provided as situation changes. Follow us!
Thank you for boost and share your views!

Live Trading Session 256: Potential & open positions on BRT,etcIn this live trading session video,we look at current live open and closed positions on BRENT,GBPUSD and EURUSD and potential trades coming on Bitcoin,Etherum,US30, etc and the thinking behind them. We also look at how we are doing on our live 100k traders challenge account.

UKOILMid-term scenery. Hunting again. When you trade from the first principles, you will focus on logic not pattern; it's logic that yields pattern

Brent Crude Breaks to Four Month HighsWith Brent crude reaching four-month highs, let's delve into the factors propelling this surge and explore potential trading opportunities.
What’s Driving Oil Higher?
A key catalyst behind last week’s breakout in Brent crude was the release of a report from the International Energy Agency (IEA), which highlighted a tightening market outlook for 2024.
The IEA revised its projection for 2024 oil demand growth upwards for the fourth time since November, citing disruptions in Red Sea shipping due to Houthi attacks. However, it cautioned that the ongoing global economic slowdown presents an additional challenge to oil consumption.
The IEA anticipates a 1.3 million barrels per day increase in oil demand for 2024, reflecting a rise of 110,000 bpd compared to the previous month but remaining below the 2.3 million bpd growth seen last year.
Additionally, the IEA adjusted its 2024 supply forecast downward, now expecting oil supply to climb by 800,000 bpd to reach 102.9 million bpd this year.
The Breakout: Transition from Contraction to Expansion
Brent crude has been carving out a series of higher swing lows on the daily candle chart since the turn of the year, but the market had been contained beneath a key area of resistance created by the October 2023 swing low and November 2023 swing high (see daily candle chart below).
This series of higher swing lows into horizontal resistance created an ascending triangle pattern. As prices were funnelled into the apex of the pattern, a tight sideways range developed in late February early March.
The breakout last week relieved the market pressure, transitioning Brent crude from contraction to expansion.
Brent Crude Daily Candle Chart
Past performance is not a reliable indicator of future results
Hourly Candle Chart Analysis
Drilling down to the hourly candle chart reveals that Brent crude has broken above last week’s highs during early European trading. This is a bullish sign and underlines the current level of momentum in the market.
Using lower timeframes in conjunction with higher timeframe breakouts is an interesting approach to crafting potentially insightful trade setups.
Brent Crude Hourly Candle Chart
Past performance is not a reliable indicator of future results
Disclaimer: This is for information and learning purposes only. The information provided does not constitute investment advice nor take into account the individual financial circumstances or objectives of any investor. Any information that may be provided relating to past performance is not a reliable indicator of future results or performance. Social media channels are not relevant for UK residents.
Spread bets and CFDs are complex instruments and come with a high risk of losing money rapidly due to leverage. 84.01% of retail investor accounts lose money when trading spread bets and CFDs with this provider. You should consider whether you understand how spread bets and CFDs work and whether you can afford to take the high risk of losing your money.

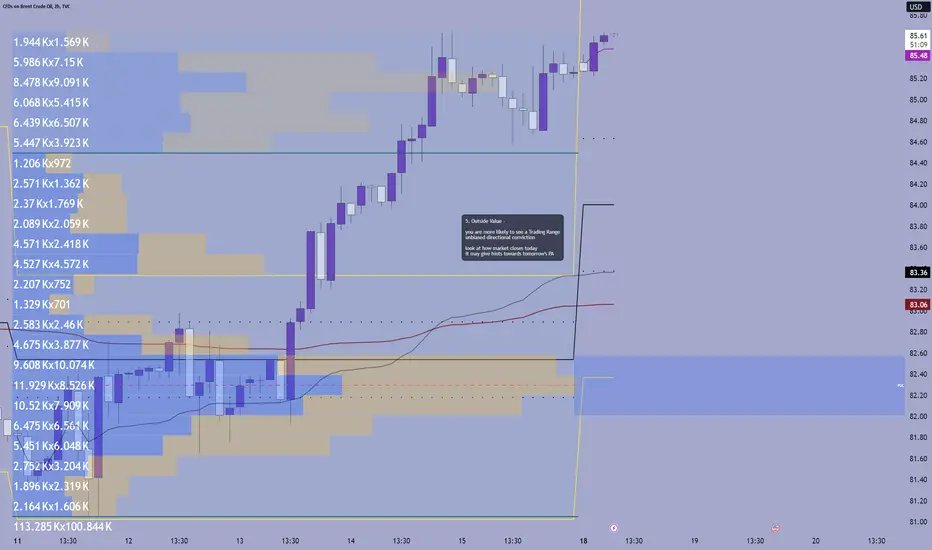
UKOIL MARCH WEEK 4 OUTLOOKDaily - looks super bullish but in need of pullback. a single bearish day will do. volume has been drying up as we move to the long side. so we need a pullback and volume to start flowing in.
Origin - outside value month means high probability of chop week. looks extended here too. ideally I would like price to pull to **84.63 - 83.36** or a deeper pullback to **83.36 - 82.01** will be even better. I will get involved in longs only once we observe a pullback and then see oil regaining strength on volume.
Brent crude heading up North The price heading straight up to $95 to $118 per barrel. After breaking and retest of the downward trend, a double bottom chart pattern was spotted and a break of the neckline gave the final confirmation of the above future price respectively.

UKOil Looks Bullish**Monthly Chart**
UKOIL last month's candle closed bullish after it tested the demand zone in Dec 2023 around 70 levels. This suggests a continuation of the bullish trend at least to test the MC around 95 level.
**Weekly Chart**
Last week's candle closed bullish after Breaking the recent weekly high at around 84 level. The price might continue moving higher to at least test the liquidity pool at around 88 levels. There is a high probability chance that UKOil will continue the up-move for this week.
**Daily Chart**
Last two weeks there were good buying opportunities and USOIL broke the high of the range. This week will continue to look for buying opportunities if the price moves below 84.00 level with next target around 88 level. If the price does not sustain the move and starts showing reversals then we will look to sell it instead.

Brent Oil trend upFor reasons not yet explained apart from supply and demand... OIL IS IN TREND UP NOW... REALLY BAD FOR INFLATION GLOBALLY!

OIL Bullish Heist Plan to make moneyAm going to heist the Crude Oil at bullish side. This is my plan to Loot the money in this method. I set my Buy Stop at Pivot line. when it trigger Golden cross my loot will start.

Oil trade missed - 3 lessons learntIn this live trading video,we explore the 3 lessons that we learnt on missing the Brent oil trade. You can cross transfer these principles on any strategy.

UKOIL Brent 14.03.2024Brent crude oil
The horizontal line can help oil rise as shown on the chart
After the recent oil data appeared, which confirmed a reduction in inventories, and with the continued Russian threats, oil will continue to rise

Brent Crude Oil. Short term prediction for 11-12th of March.Short term prediction for 11-12th of March.
Last Friday the 4hour candle closed
out of tunnel. I would expect that it goes down
towards 81.5(or around it.) It might do a
manipulation move towards back to the tunnel.
Or even it might do a hawkish move.

The idea of a bull market in oilGreetings
Dear analysts and traders,
I hope you are doing well and are motivated for the week ahead. I wish you all the success in your business endeavors. Remember that success in trading lies in consistently defining and sticking to your rules.
As someone interested in the Elliott Wave Principle, I find it to be an invaluable tool for market analysis. I have developed my approach by combining this principle with my personal experience and by considering different scenarios that are likely to occur in the market. It should be noted that I do not like to be surprised in the market, and that's why I have different market prospects. I follow them to be sure and recognize the structure that is forming so that I can 100% recognize it.
I will share my analysis with you, but please note that I am not providing any buy or sell signals. My perspective on idea analysis is completely unbiased, so if the idea analysis meets your standards, you can use it as a guide to make an informed decision.
I have attached my previous analysis of the same market so that you can compare and see the differences. All the details of my analysis are clearly labeled, making it easy for you to understand. However, having a basic familiarity with the Elliott Wave Principle theory will help you understand the analytical idea more easily.
I have been studying the Elliott Wave Principle for almost three years now, and over time, my understanding of this knowledge and experience has grown. What I have achieved so far is the legacy of a genius called Ralph Nelson Eliot, and I am really happy with my progress. May peace be upon him.
Thank you for your support so far. I will always remember your kindness. Please share your comments and criticisms with me.
I hope my analysis will be useful to you in your business journey, and I wish you all the best.
Sincerely,
Mr. Nobody
The idea of a bear market in oil

UKOil Brent 13.03.2024Brent oil is on a very strong horizontal line and we have very important data for oil, so we expect the data to appear negative for oil and begin to decline from 83.30 to 83.80, and the target will be at $81.
