Brent \ Oil - AnalysisOil Brent
MN - The price has broken through the trend line at 87.51, which may indicate the beginning of an upward movement.
W1 - We are observing a retest after the triangular formation and a breakout of the level of 87.51; for the price to move further upward, it is necessary to wait until the price consolidates at this level, which will open up the possibility of moving to the level of 108 - 125
If the price does not fix at the level of 87.51, we can expect a continuation of the downward movement with a target to the 71 price level
What can you expect now?
When moving up, the nearest target is 99.34
When moving down, the nearest target is 81.64
Long
Targets 99.34 - 108.94 - 125.09
Medium term - targets 92.34 - 94.87 - 99.34
Short
Targets 81.64 - 76.52 - 71.27
Medium term - targets 85.40 - 83.79 - 79.81
UKOIL trade ideas

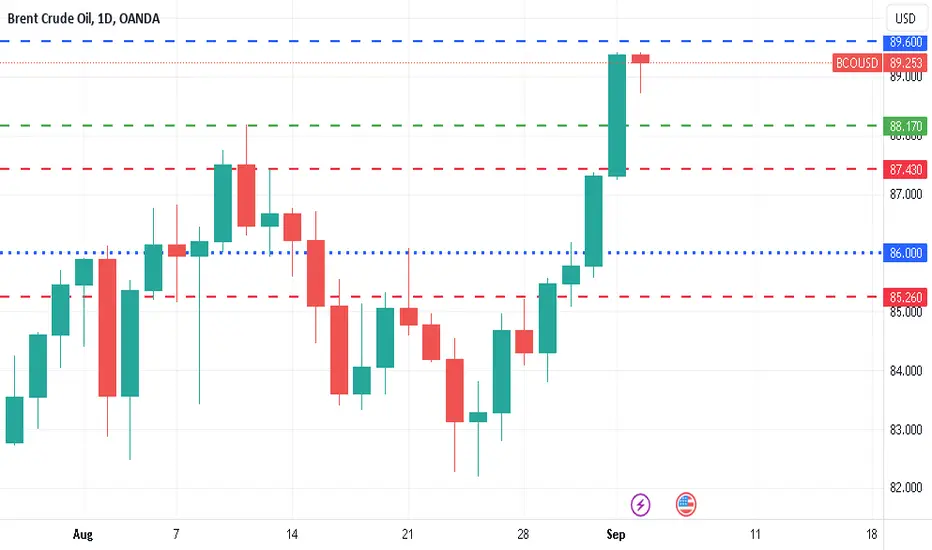
Brent - I expect quotes to decline in the short term.Based on the fact that over the past two days there have been two unsuccessful attempts to pass level 91 (it is quite possible now there will be a third attempt), I assume that brent oil will be under pressure in the near future. In all likelihood, at the level of 91, large players closed long positions, and in this case, they probably did not even think about overcoming it. As for the decrease, at first I think we will reach 88.17, and then quite likely to 86.

UK US OIL Did it see the upmove ?Recently posted here that oil is gonna have upmove the same had happened .
Now what is next
As you see this in the chart ,It is clearly in the consolidation
After the consolidation price must go up or down ,Looking at the chart i see this will go down rather up.

BRENT OIL ( UK OIL ) LONG term Trade AnalysisHello Traders
In This Chart UK OIL HOURLY Forex Forecast By Forex Planet
today UKOIL analysis 👆
🟢This Chart includes_ (UKOIL market update)
🟢What is The Next Opportunity on UKOIL Market
🟢how to Enter to the Valid Entry With Assurance Profit
This Video is For Trader's that Want to Improve Their Technical Analysis Skills and Their Trading By Understanding How To Analyze The Market Using Multiple Timeframes and Understanding The Bigger Picture on the Charts.

Oil may jumpThere uncertainty in Russia and relation between kremlin and Wagner is sour, this can results in high volatility and specially on energy sector and precious metals.
If the situation is not contained quickly, I believe that on Monday the price of the oil will jump due to uncertainty, it might reach 85-90.
Please be careful with volatility

Ukoil :)I entered a trade as the price retraced, and I noticed several factors confirming my decision. SMARMCDX suggests that institutional traders are in control, and the EMA 50 indicates a strong uptrend


Oil to see Up moveAs there is fresh long candle formed ,Oil will continue to have momentum in the long side.

Brent - dubious growth.Everything looks really as if the buyers were going to accelerate to 90, and maybe even higher. But I have some doubts and have not made any purchases yet. I prefer to focus on the classics. And I didn’t see the classic test of the recently completed level. Therefore, I doubted. Of course, it is possible that it will only be in the near future. The probability of a rollback is also indicated by the fact that the technical resistance levels drawn on the chart yesterday noticeably interfere with growth, and it may turn out that the next closing prices will be very close to the first resistance of 89.60 or even below it. Which will be the beginning of a rollback to support around 86.


UK Oil SelloffHere you can see on the daily TF. The sell has already started after hitting an orderblock, Also on the 4hour TF you can see that the trend is being respected. I see oil going back to highs but first we must "sweep the floor"


Buy BRENT#BRENT
Oil continues its steady growth on expectations of a reduction in supplies from the Russian Federation in September, as well as positive news from China. However, at the moment the price is starting to look a bit overheated and needs to be deflated.
Against this background, I am waiting for a suspension and correction in the coming days. Nevertheless, the uptrend is strong, so the plan is to open purchases near the levels of 87 and 86 dollars per barrel with a take profit of 88.50.

Brent - a brief overview.Today, I was already expecting some more tangible news on the oil chart. But for now, we can say they are not at all. In the current conditions, I suggest focusing on technical levels:
Resistance 3 - 91.77
Resistance 2 - 90.34
Resistance 1 - 89.60
Pivot point - 88.17 - the price is now just above it, and perhaps after its breakdown, we can expect a further decline to the level of 86.
Support 1 - 87.43
Support 2 is just at level 86. The test we expect.
Support 3 - 85.26.
DeGRAM | UKOIL structure based tradeUKOIL is moving to resistance at 90.00 and a fibo extension level.
The price is printing potential of the AB=CD pattern.
The oil market is approaching major resistance on the D chart.
We anticipate a reversal from the resistance level.
-------------------
Share your opinion in the comments and support the idea with a like. Thanks for your support!

long positionThe price of Brent oil will increase dangerously soon.
Follow me to be aware of the analysis.
Be happy and profitable
hassanbarati


Brent made an attempt to get out of the corridor.Well, it looks like they waited - yesterday the oil quotes passed the resistance level and today they continued their (possibly!) victorious march. But I ask you to be patient. The quotes have not yet left the sales area and making deals to buy is still very risky. According to the classics, now the support level should become the resistance level. When we see it with you - then it's time to buy.

Is Brent going to hit its daily target - Stretch principleThis trade we are looking at on Brent oil is based on the stretch principle. We have entered on the close of the confirmation bar(the one with the dot) according to our smart money framework indicator and our trend alignment with the the higher timeframes.
E - 1.2643
SL - 1.2547
T - To be confirmed(TBC)
So far,it is going in our favour as it has taken out the upper stretch line which gives the bigger range from open(BRO) a higher probability to form in that direction. We will be tracking this move and managing it as we go along. Keep a look out for it traders.
To understand our ideas and videos better,we highly recommend watching our following stream videos:
1. 7 steps to achieve consistent trading performance
www.tradingview.com
2.7 steps for strategy construction
www.tradingview.com
3.Stretch principle videos
Refer to related ideas links as below

Oil at the upper boundary of the corridor.Brent oil is the second time in five weeks to the upper limit of the global corridor. Of course, there are quite a number of buyers on the market. And it seems that there are more and more of them, because during these 5 weeks, the forces of buyers released the quotes down very close to the current levels. What can not be said about April 2023, when after the first touch of the level of 86.90, the price immediately went down to 71.50 with almost no tangible pullbacks. Perhaps this time the bulls will succeed. You just need to remember that buying now can carry a high risk. Buying risk content will decrease if the price consolidates above 86.90.

UKOIL Long Idea
Daily bias switched over to long today. no strong resistance till 85.77 visible.
2 potential entries marked on chart along with all relevant information needed to assess long idea.
additional potential entry can be expected at London open.
I usually trade just London session but this setup looks too good to pass on if it presents right away.
but I will wait till the POC is cleared. whether it does this in next 15 minutes or after London opens up, we will see.

selltp1:85.53
tp2: 82.44
tp3: 78.80
tp4: It is still possible to continue the downward trend
So manage in D1
*** After the price reaches the first target, risk free😎

Brent oil has a new target.In my opinion, Brent oil quotes are preparing to decline, and in all likelihood the first target is $80 per barrel. There is a slight complication, which consists in the fact that it will make sense to open a sale only below the level of 81.50. If it is a confident breakdown, then everything is in order, but it may turn out that the bars will reach 80 only with shadows, in which case it will not work.
