UKOUSD trade ideas

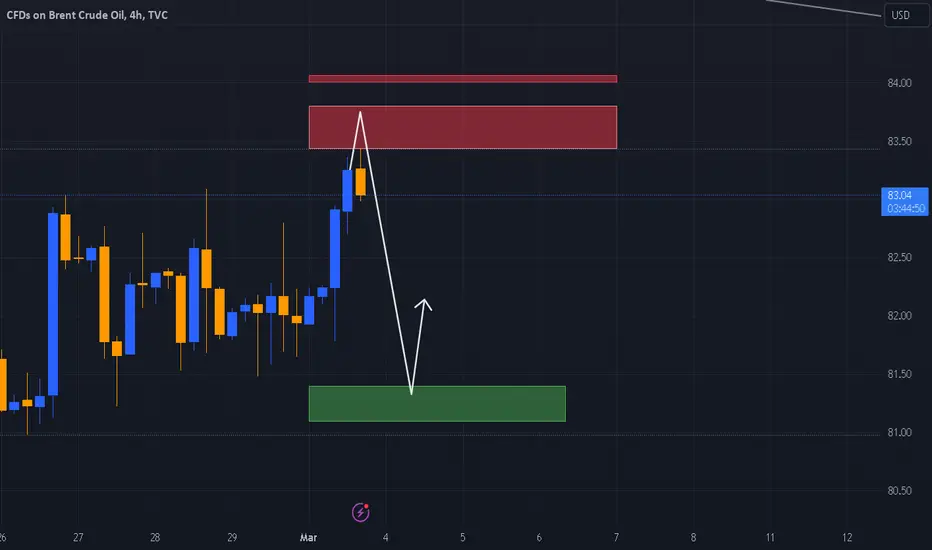
BRENT - Interesting buy zone!Hello everyone!
we're turning bullish on BRENT!
- Here's my view on BRENT :
- We have liquidity.
- We have an interesting zone.
- We have the optimal Fibonacci.
- We have accumulation before/on the zone.
- We are with the trend.ù
stay cautious.
That's why I see GOLD rebounding in the zone and dropping!
🚀 If you liked it and want more, don't hesitate to subscribe and boost the post!

UKOIL (Brent) Technical Analysis - VideoIn my previous post, I shared my analysis on Brent crude oil. Here's a video explaining the reasoning behind my trade idea:
Currently, Brent is trading within a daily range-bound channel. It's pushing against the upper boundary, which hints at a possible retracement to test previous lows. Interestingly, historical data over the past decade suggests that March tends to be a bearish period for Brent.
Disclaimer: Remember, this analysis is based on technical factors and should not be seen as direct financial advice. Trading commodities is inherently risky. Before making any trades, always consult with a qualified financial professional and carefully consider your own risk appetite.

UKOIL LONGSame thing as always. I am looking for a pullback all the way to 82.56 - 82.39 zone and looking for price to get absorbed there.
more than usual volume traded in oil yesterday which is repeat of similar pattern observed in Jan this year before first run up in oil.
for me to get an entry I am looking for almost 1% drop so let's see if I get it.

UKOIL (Brent) Technical AnalysisBrent crude oil is presently confined within a daily range-bound channel. The price is currently testing the upper bounds of the range, suggesting a potential retracement to retest previous lows. This analysis incorporates a seasonal perspective – historical data over the past decade indicates a tendency for Brent to experience declines during the month of March.
Disclaimer: This analysis offers a technical viewpoint and does not constitute direct financial advice. Trading commodities carries inherent risk. Always consult a qualified financial professional and carefully evaluate your individual risk tolerance before making investment decisions.

UKOil Bullish**Monthly Chart**
UKOIL last month candle closed bullish after it tested the demand zone in Dec 2023 around 70 levels. This suggests a continuation of the bullish trend at least to test the MC around 95 level.
**Weekly Chart**
UKOil weekly chart shows bullish momentum although it has been moving in consolidation mode for the past three weeks. Last week's candle closed bullish and it is currently moving towards balancing the IPA (FVG) and MC around 92 level.
**Daily Chart**
The first target as per the daily chart is at 85 level (imbalanced area), then will look for a trade setup to take it long in the next few weeks. However, it might be a risky entry around this level because of IPA which might create resistance.

UKOIL LongLooking to go long at the break and hold of 83.28.
better if price dips to the zone 82.80 - 82.60 and gets absorbed there

Oil BreakoutOil had an accumulation phase and now in consolidating at the edge of the box; i would wait for a nice bullish candle to enter but cannot deny the bullish dominance on this chart

Oil looking poised for a break outWait for the formation to break before making any trades. That said, it does look like Oil is setting up to trade higher. Maybe as high as the recent swing highs?

BRENT - Interesting buy zone!Hello everyone!
we're turning bullish on BRENT!
- Here's my view on BRENT :
- We have liquidity.
- We have an interesting zone.
- We have the optimal Fibonacci.
- We have accumulation before/on the zone.
- We are with the trend.ù
stay cautious.
That's why I see GOLD rebounding in the zone and dropping!
🚀 If you liked it and want more, don't hesitate to subscribe and boost the post!

UKOIL BRent GO TO 86.10 🎯After some OPEC Plus countries continued to extend the decline in oil production for an additional month, we expect Brent crude oil to continue the upward trend and begin to rebound from 82.40 all the way to 86.10.
Good luck

BRENT - Interesting buy zone!Hello everyone!
we're turning bullish on BRENT!
- Here's my view on BRENT :
- We have liquidity.
- We have an interesting zone.
- We have the optimal Fibonacci.
- We have accumulation before/on the zone.
- We are with the trend.ù
stay cautious.
That's why I see GOLD rebounding in the zone and dropping!
🚀 If you liked it and want more, don't hesitate to subscribe and boost the post!

Brent (ICE) may fall to 81.80 - 82.30Pivot
83.10
Our preference
Short positions below 83.10 with targets at 82.30 & 81.80 in extension.
Alternative scenario
Above 83.10 look for further upside with 83.60 & 84.00 as targets.
Comment
As long as the resistance at 83.10 is not surpassed, the risk of the break below 82.30 remains high.
Supports and resistances
84.00
83.60
83.10
82.74 Last
82.30
81.80
81.50
Number of asterisks represents the strength of support and resistance levels.


DeGRAM | UKOIL pullback tradeUKOIL reached resistance, and it pulled back from it.
The market is trading in the ascending channel, indicating the bears are running out of steam and the bulls are in control.
Price broke and closed above the resistance at 83.00.
We expect bullish move.
-------------------
Share your opinion in the comments and support the idea with like. Thanks for your support!

UKOIL 01.03.2024
UKOIL
Oil continues to fall amid concerns about demand and interest rates in America
The latest data confirms that US interest rates will not be reduced in March
This is negative for oil, with concerns about the demand for oil and also the cessation of the war
Between Israel and Hamas and entering into a truce at the beginning of March
Brent is on FIRE! New Bullish Momentum or Pullback?In this morning's Asian market hours, optimism about a possible interest rate cut by mid-year boosted the market sharply causing it to start unexpectedly strong, especially the oil market, including both West Texas and Brent crude oil in a tremendous price rally. Brent futures experienced a notable increase. At the start of the European session, an increase in expectations was also observed, resulting in a rise in European stocks. In a matter of hours, the price of a barrel of Brent rose from $81.64 to $82.91. The rise in Asian hours in Brent and West Texas futures contracts expiring in May was 0.4% and 0.3% respectively, being at the European opening of more than 1%.
German conflicts to receive supply with the active NordStream line may especially affect chemicals, gas derivatives and European oil prices added to the ukranian conflict. In addition, economic data from several Eurozone countries such as Italy, Spain, Portugal, Ireland, and later at the American opening, manufacturing PMIs from the United States and Canada, may have a significant impact on oil prices.
From a technical standpoint, it is unlikely that we will see the $135 per barrel seen in 2022 again in the near term. However, it is possible that the falling range has reached its low around the $71.47 seen in December, and could head towards $95.12 if the current uptrend continues. The RSI indicates an oversold level of 62.6%, which suggests that there is still room for the trend to continue, although the RSI average system marks us a value of 53.03% which is basically a strong irregularity in demand. If we look at the crosses of averages, they show us an opening that could lead to a strong move that is yet to develop.
Ion Jauregui - AT Analyst
The information provided does not constitute investment research. The material has not been prepared in accordance with the legal requirements designed to promote the independence of investment research and such should be considered a marketing communication.
All information has been prepared by ActivTrades ("AT"). The information does not contain a record of AT's prices, or an offer of or solicitation for a transaction in any financial instrument. No representation or warranty is given as to the accuracy or completeness of this information.
Any material provided does not have regard to the specific investment objective and financial situation of any person who may receive it. Past performance is not reliable indicator of future performance. AT provides an execution-only service. Consequently, any person acing on the information provided does so at their own risk.

BRENT - Interesting sell zone!Hello everyone!
The plan is still in effect; I've taken a second entry!
- Here's my view on BRENT:
- We have liquidity.
- We have an interesting zone.
- We have the optimal Fibonacci.
- We have accumulation before/on the zone.
- We are with the trend.
Fundamentally, we'll continue to monitor the evolution of conflicts in the Middle East because they can significantly impact the price of oil in case of escalating tensions! Given that we have the largest oil producers there, having conflicts nearby is concerning! So, stay cautious.
That's why I see BRENT drop in the zone and bumping!
🚀 If you liked it and want more, don't hesitate to subscribe and boost the post!

UKOIL BRENT DOWNUKOIL
Oil continues to fall amid concerns about demand and interest rates in America
The latest data confirms that US interest rates will not be reduced in March
This is negative for oil, with concerns about the demand for oil and also the cessation of the war
Between Israel and Hamas and entering into a truce at the beginning of March
We expect the downward trend for oil to continue
Selling will be in the 82.30 to 83.00 area
The targets are 80.80 and 79.80

UKOIL Brent 28.02.2024please make sure of them and do not risk, this is our analysis and ideas.
Please observe the capital carefully and do not risk more than 1% of your capital
Good luck to everyone

BRENT - Interesting sell zone!Hello everyone!
The plan is still in effect; I've taken a second entry!
- Here's my view on BRENT:
- We have liquidity.
- We have an interesting zone.
- We have the optimal Fibonacci.
- We have accumulation before/on the zone.
- We are with the trend.
Fundamentally, we'll continue to monitor the evolution of conflicts in the Middle East because they can significantly impact the price of oil in case of escalating tensions! Given that we have the largest oil producers there, having conflicts nearby is concerning! So, stay cautious.
That's why I see BRENT drop in the zone and bumping!
🚀 If you liked it and want more, don't hesitate to subscribe and boost the post!

UKOIL BRENT 27.02.2024please make sure of them and do not risk, this is our analysis and ideas.
Please observe the capital carefully and do not risk more than 1% of your capital
Good luck to everyone

BRENT - Interesting sell zone!Hello everyone!
The plan is still in effect; I've taken a second entry!
- Here's my view on BRENT:
- We have liquidity.
- We have an interesting zone.
- We have the optimal Fibonacci.
- We have accumulation before/on the zone.
- We are with the trend.
Fundamentally, we'll continue to monitor the evolution of conflicts in the Middle East because they can significantly impact the price of oil in case of escalating tensions! Given that we have the largest oil producers there, having conflicts nearby is concerning! So, stay cautious.
That's why I see BRENT drop in the zone and bumping!
🚀 If you liked it and want more, don't hesitate to subscribe and boost the post!
