UNI Bullish-trend expectation in mid or long termAs you can see we can expect the UNI can go to 78 dollars in mid or long time frame.
UNIUSD.P trade ideas


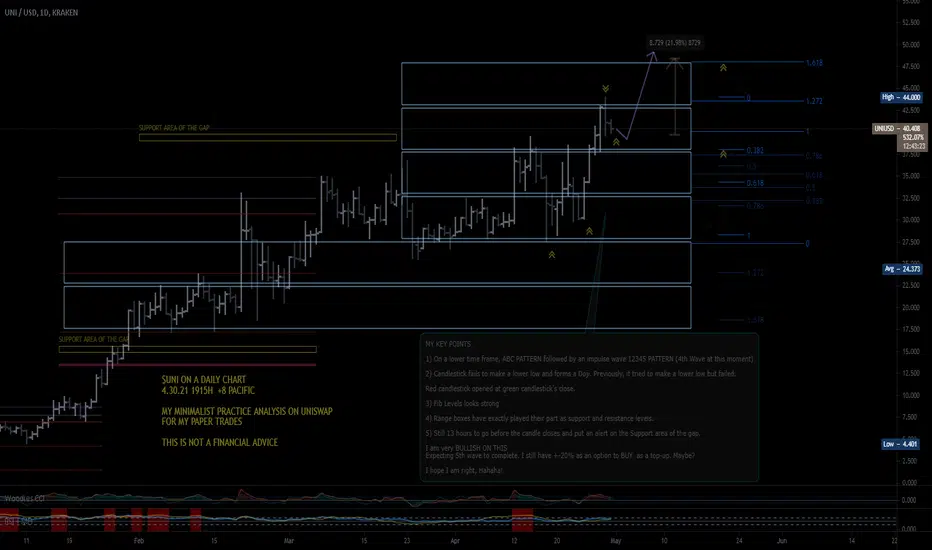
MY MINIMALIST CHART ANALYSIS PRACTICING MINIMALIST APPROACH TO ANALYZING CHARTS WITHOUT LAGGING INDICATORS
ON UNISWAP
I am here again practicing my MINIMALIST CHART ANALYSIS.
I made it without using indicators and I thank my oneway mentor for all the wisdom he has shared wholeheartedly.
I would love to mention his name but, I have not proven anything yet that I have learned something.
I analyze, apply to my paper trade and that is only how I would know if I learned. If I fail, I try to analyze what I did wrong and try it out again.
More on "charge to experience." kinda thing.
Oh well, here goes.


Uniswap rallies 42% in 4 daysUniswap aims to replace centralized exchanges, exchange market makers, and specialists with decentralized liquidity pool-providing individuals and bots for efficient trading of cryptocurrencies and tokens on the Ethereum blockchain.
Go to Uniswap to exchange ETH for AAVE, BAL, COMP, LINK. Create your own token pair for other users to trade, provide liquidity and earn trading fees.
After 4 strong up days, UNI/USD is up 42%. Previous rallies of such magnitude were followed by retracements.
I would wait for a 25% to 40% retracement of that rally before going in, but Uniswap will be added to our portfolio at the earliest opportunity. Did you know it is up 1,100% in 6 months?

Still some room for the bullish run to completeHere, I am using several retracements, trend lines, and extensions to build the case of a short-term buy position. First, the graph fits beautifully in the pitch fork trend, showing that we are currently at the median resistance of the bullish trend. To see whether we will go up or down from here, I used several Fibbonacci retracements at different time frames, most of which are showing that we are nearing, but not yet at the end of the trend. Taking into consider only that last bullish trend, we are at the 261.8% Fib extension, which would definitely the time for a take profit. However, taken into consideration longer trends, resistance seems to be a bit higher, around the 44.5 price range. Fib Speed Arcs even make me believe that the last ditch of the bull upwards will happen today or tomorrow, then a sell should be done.
Of course, if I had a buy position from a start, I would have taken the profit at this stage and play it safe. But since I am out of position, I am willing to take the risk for the last part in an incredible bullish run.

UNI to the Moon!UNI has blast off from last week lows and is up 46% and its searching for higher highs. The cripto keeps its bull trend following other alts. Looking for entry points when it goes back to the 41 region and maybe the 38 region


UNI: MOST Important Update - HASH RIBBONS CONFIRMED BUY! PT $387This is a significant day for UNI - UNI just posted a Hash Ribbons buy signal on April 25th and this is the most reliable buy signal in crypto.
The last time UNI posted this Hash Ribbons Buy signal was Dec. 21, 2020. Over the next 124 days, UNI returned 1000% or 11x to anyone who held over those 4 months.
Imho, this next 1000% return in UNI will take less than 124 days considering the bull market was just beginning in Q4 2020 and it takes time to start the compounding.
With V3 set to launch May 5th and EIP-1559 going into effect in July, you will want to be in for this ride... PT $387
Here is my last update on UNI prior to this:


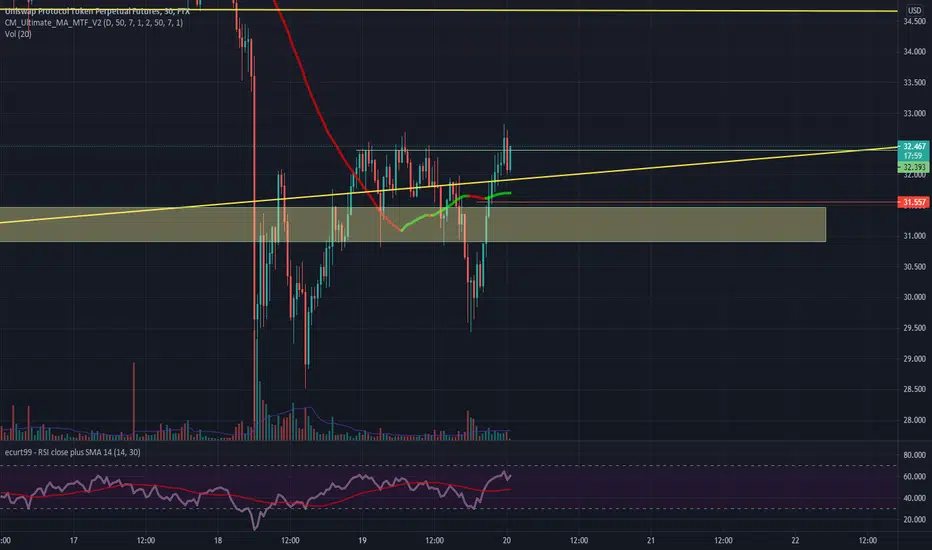
Scalp long on uniperp for $33.5Taking this long trade. Look like about to do one of those simpons chart.
Scalp long on uniperp for $33.5

UNISWAP #UNI $UNI #PERPETUAL UP, UP, & AWAY ... FLYING UNICORNSUNISWAP IS LITERALLY A #CRYPTO UNICORN
A huuuuge SUCCESS STORY
IT GOES WAAAY HIGHER.

UNIUSD trade ideaAPRIL 26:
- Double bottom
- Late 1 candle, still placed order based on multiple recent tests resistance

UNI Very Long Good Morning/Afternoon/Evening Friends!
All on the chart.
As far as I'm concerned UNI is an entirely undervalued asset.
Call me crazy - and I may very well be wrong - but we are due for another big 10x jump on our lovely unicorn.
Please remember we are very likely in the end stages of this bull run, so any 10x should be met with extreme profit taking and mindfulness of the bottom being pulled out.
UNI is here for the long run, however, so no fret on the token's overall longevity.
Trade safe, invest what you can afford to lose, and be happy :)
Love,
Jemkie 🦊
PS: Send ETH or Uni to my wallet if you so desire :)
0x9b143471BDa90f672f8DB6E0b837d2b7B5dc2484

Uniswap (UNI) - April 24Hello?
Dear traders, nice to meet you.
By "following" you can always get new information quickly.
Please also click "Like".
Have a good day.
----------------------------------
You should watch for any movement that deviates from 28.83657176-35.56287172.
In particular, it remains to be seen if it can rise along the uptrend line.
If you decline at the 30.64308018 point, you need a short stop loss.
However, you can touch 28.83657176 point and go up, so you need to trade carefully.
Therefore, you need to check the location of the closing price.
If it falls at 22.11036180, a Stop Loss is required to preserve profit and loss.
----------------------------------
(UNIBTC 1D chart)
61028 Satoshi-73062 Satoshi We must watch for any movement that deviates from the section.
In particular, you need to make sure you can get support at the 63445 Satoshi branch.
44983 Satoshi-48994 If you fall in the Satoshi section, you need Stop Loss to preserve profit and loss.
It remains to be seen if the bullish can continue within the bullish channel.
--------------------------------------
It is advisable to trade at your average unit price.
This is because if the price flows below your average unit price, which was on an uptrend or downtrend, there is a high possibility that you will not be able to earn a large profit due to the psychological burden.
The center of every trade starts with the average unit price you start trading.
If you ignore this, you may be trading in the wrong direction.
Therefore, it is important to find a way to lower the average unit price and adjust the proportion of the investment, so that the money that ultimately represents the profit can regenerate the profit.
-------------------------------------------------- -------------------------------------------
** All indicators are lagging indicators.
So, it's important to be aware that the indicator moves accordingly with the movement of price and volume.
Just for the sake of convenience, we are talking upside down for interpretation of the indicators.
** The wRSI_SR indicator is an indicator created by adding settings and options from the existing Stochastic RSI indicator.
Therefore, the interpretation is the same as the conventional stochastic RSI indicator. (K, D line -> R, S line)
** The OBV indicator was re-created by applying a formula to the DepthHouse Trading indicator, an indicator that oh92 disclosed. (Thank you for this.)
** Check support, resistance and abbreviation points.
** Support or resistance is based on the closing price of the 1D chart.
** All explanations are for reference only and do not guarantee profit or loss on investment.
Explanation of abbreviations displayed on the chart
R: A point or section of resistance that requires a response to preserve profits
S-L: Stop Loss point or section
S: A point or segment that can be bought for profit generation as a support point or segment
(Short-term Stop Loss can be said to be a point where profits and losses can be preserved or additionally entered through installment transactions. It is a short-term investment perspective.)
GAP refers to the difference in prices that occurred when the stock market, CME, and BAKKT exchanges were closed because they do not trade 24 hours a day.
G1: Closing price when closed
G2: Cigar at the time of opening
(Example) Gap (G1-G2)

Oh I want something just like this Terrible Coldplay song, but applicable.
Based off UNI's meteoric rise and extremely resistance support levels against BTC's dump leads me to believe we're going to see a $200+ UNI very soon.
The amazing thing is, a lot of the increase can be attributed to the technical fundamentals in UNI v3's launch.
Please, look it up. BNB? More like crapNB. Why use a Chinese centralised exchange with major vulnerabilities on its flagship chain when you can be on the ground floor of a decentralised Binance & its token?
Make your bets, I don't touch Binance related things. Crypto was meant to be decentralised, and so it will stay.
Love,
Jemkie 🦊
PS: Send UNI or ETH to my wallet xx :)
0x0008eb9764B45b7a7761eB747E1C6a5a55C9d6Ec

UNI closes the gap to $40 despite broad-based crypto retreats
Uniswap leads recovery in the market, posting incredible gains.
Breaking the resistance at $40 could bolster UNI to new record highs.
Uniswap has given a blind eye to the ongoing correction in the market to post double-digit gains over the last 24 hours. The decentralized finance (Defi) token is among the cryptocurrencies that managed to weather down the volatility in the market with ease since the beginning of the week. At the moment, Uniswap teeters at $36 while bulls focus on breaking above $40.
Before the breakout, Uniswap had settled on top of crucial support, highlighted at $30. A ranging channel controlled price action for a short period ahead of the ongoing bullish momentum. Several broken resistance levels set the precedence for the bulls to take control.
Meanwhile, all the short-term technical levels and indicate that bulls are comfortably in control. For example, the Moving Average Convergence Divergence (MACD) hints at the uptrend remaining intact in the short-term.
As the MACD crosses into the positive region, bulls are bound to tighten the grip on the trend. Moreover, the MACD line (blue) has crossed above the signal line, reinforcing the bullish outlook.
The Relative Strength Index (RSI) is leaning to the bullish camp after gradually recovering from the oversold area. Movement into the overbought region would encourage more buyers to join the market, pushing Uniswap beyond $40. Trading above $40 will also trigger the fear of missing out (FOMO), bolstering UNI toward $50.
Uniswap intraday levels
Spot rate: $36.8
Trend: Bullish
Volatility: Low
Support: 50 SMA, 100 SMA and $30
Resistance: $38 and $40

UNİ PERP Long PositionWe have a clear uptrend that comes from 22 january.
It bounces from there and I opened Long Position from the green line, and stop loss on red line.
Because market isn't much bullish.
ichimoku trade : long positionin pullback to the ceiling with broke in tenkansen and kijunnsen cross.
buy position at 34.34$
stop loss: breaking the kijunsen


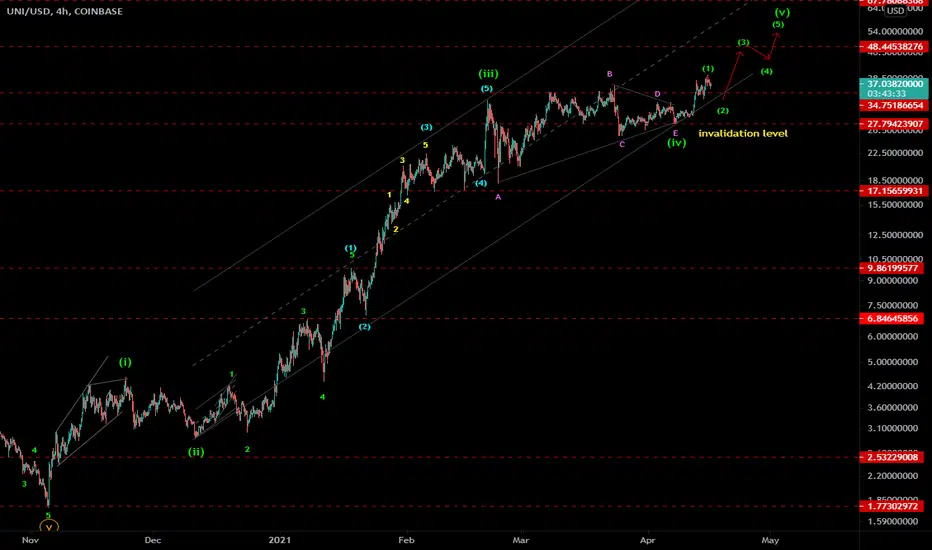
UNIUSD - EW analysis - 5th wave triangle breakout thrust UNIUSD - It already broken out the 4th wave triangle and now moving higher in 5th wave. currently expected correction before it resume the next move higher as the part of 5th wave cycle.
Give a thumbs up if you really like the Elliott wave analysis.