I think UNIUSD will bounce up for another transition phase.The RSI is probably about to change phase. BTC is going to decrease and has 50% chance of making UNI decrease greatly as well to $13. 50% chance of either staying where it is or decreasing a little bit more to 19.5.
I believe the fib time retracement combined with the price retracement for this last bounce predicts 50% chance of just having a bigger bounce, having a high of around 36, or going beyond that to max 61 for this next increase.
w/l=0/0
UNIUSD trade ideas

Another Fib Waves Testtesting my fib waves theory
2.618 should break out bullishly, continue upwards, a continuation of the previous 2.618 state
Idea also for UNIUSD
I am neutral on UNI, but still think it will play out bullishly throughout 2.618


UNI Here's what I'd be looking at if the market sh!ts any harder. A solid close below the 0.618 would see me play this short scalp. happy to flip bias, if! the 0.618 holds or wicks below, but closes above. therefore seeing us chop in this horizontal range


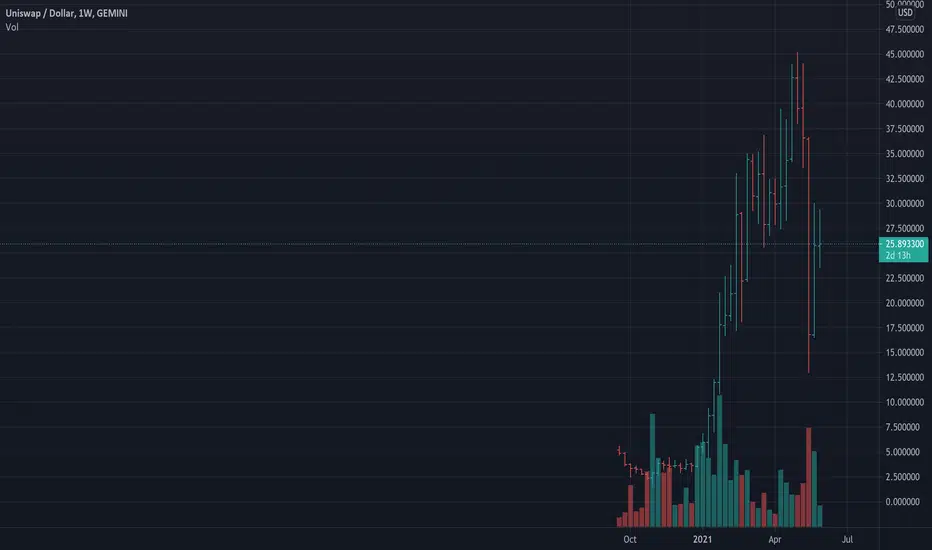
Weekly Swing Trade - Long UNIUSDLong UNIUSD -25.8933
Stop Loss - 21.078
Take Profit - 35.523
Hold for about a week, close out in 3-4 days if trade goes in your favour and price has started idling.
If price has moved against you, but has not hit SL, leave the trade open unless you need the cash for another trade.
$UNI LONGCup handle on UNI. Have starter position on now, will add to on break, retest of resistanct level. Stop/targets are marked on chart. Will take some profits off at target and let rest ride in case this is continuation of uptrend.

Uniswap looking to lose more ground UNIUSDWe are seeing a huge zigzag forming here. It's a beautiful sight and a sign of things to come.
Fibonacci goals are in green and invalidation is in red. Not financial advice - do your own research.

UNI/USDT LongAfter the recent correction, UNI looks prime for picking. After V3, the Uni fundamentals are really strong. You can do a $10M transaction for less than 1% slippage.

Uniswap getting killed out hereJust plotting a comparison candle chart of Uniswap vs Cake. So its a UNICAKE chart.
And would you look at that, it's dead! Some have been saying Uniswap is losing steam, but if you look here, it's been dead for a while now...

BUY signalUNI retested the horizontal resistance line as support now we expect a further rise. Also the confirmation with the bullish cross-over on the 1 hour chart.
First target 32


Uniswap (UNI) - May 21Hello?
Dear traders, nice to meet you.
By "following" you can always get new information quickly.
Please also click "Like".
Have a good day.
-------------------------------------
(UNIUSD 1D chart)
You should watch for any movement that deviates from the 22.11036180-28.836657176 section.
In order to turn to an uptrend, it must rise above the 35.56278172 point and gain support.
However, it remains to be seen if it can rise above the 28.83657176 point and move sideways.
-------------------------------------
(UNIBTC 1D chart)
We have to see if we can get support and ascend in the 61028 Satoshi-63445 Satoshi section.
If it falls at 61028 Satoshi branch, you can touch 48994 Satoshi branch or lower, so you need Stop Loss to preserve profit and loss.
However, you can hit the 53565 point and go up, so you need to trade carefully.
--------------------------------------
It is advisable to trade at your average unit price.
This is because if the price flows below your average unit price, which was on an uptrend or downtrend, there is a high possibility that you will not be able to earn a large profit due to the psychological burden.
The center of every trade starts with the average unit price you start trading.
If you ignore this, you may be trading in the wrong direction.
Therefore, it is important to find a way to lower the average unit price and adjust the proportion of the investment, so that the money that ultimately corresponds to the profit can regenerate the profit.
-------------------------------------------------- -------------------------------------------
** All indicators are lagging indicators.
So, it's important to be aware that the indicator moves accordingly with the movement of price and volume.
Just for the sake of convenience, we are talking upside down for interpretation of the indicators.
** The wRSI_SR indicator is an indicator created by adding settings and options from the existing Stochastic RSI indicator.
Therefore, the interpretation is the same as the conventional stochastic RSI indicator. (K, D line -> R, S line)
** The OBV indicator was re-created by applying a formula to the DepthHouse Trading indicator, an indicator that oh92 disclosed. (Thank you for this.)
** Check support, resistance, and abbreviation points.
** Support or resistance is based on the closing price of the 1D chart.
** All explanations are for reference only and do not guarantee profit or loss on investment.
Explanation of abbreviations displayed on the chart
R: A point or section of resistance that requires a response to preserve profits
S-L: Stop Loss point or section
S: A point or segment that can be bought for profit generation as a support point or segment
(Short-term Stop Loss can be said to be a point where profits and losses can be preserved or additionally entered through installment transactions. It is a short-term investment perspective.)
GAP refers to the difference in prices that occurred when the stock market, CME, and BAKKT exchanges were closed because they do not trade 24 hours a day.
G1: Closing price when closed
G2: Cigar at the time of opening
(Example) Gap (G1-G2)


UNI - $82.99UNI is currently trading close to the resistance zone at $36.40. It has a good support at $31.69. If UNI can break the resistance at $36.40 and flip it to support, we could start seeing a move towards $39.25, $41.56 and $44.44. The resistance at $44.44 is an important one. If UNI can break this resistance and flip it to support, we could start seeing a much higher move towards $47.16, $51.34, $63.43 and $82.99. Long at support of $31.69 or breakout of resistance of $36.40.
Stop loss should be kept below $31.69. If this support breaks, it could lead to a drop towards $27.76 and $24.85.

Good Buy opportunity here!As I mentioned in my previous uni post, if it drops to this level, it's a good buy. the only negative thing that I can see is that it's at the top of the channel in the BTC UNI trading pair this might indicate a breakout. Alts have become more and more disconnected from bitcoin over the past week so.

Long #UNIPERP for $60 to $64Long #UNIPERP for $60
* Super Algorithm Indicator has called bullish on this recently.
targetting $60


uni updateprevious post:
the 100% could have been the top, but due to this consolidatory period, i am confident we'll hit the original target.


Morning #crypto traders... I look at #BTC #ETH #LTC #DOGE + #YFI#YearnFinance just went NUTSO, didn't it.. HOLY MOLY

Newbie learning crypto! Unidays updateLooking like an upward parallel channel.(might be wrong)
RSI
MACD
Stochastic RSI
All confirming a bullish short and long.
Looking at 46$ very soon!
