UNI LONG after SHORTHello, friends, first we have a long trade, after reaching the area of 5.013, our long trade will be opened for 5.432 from that area, we will close our trade and open a short trade, and the targets are clear in the picture.
UNIUSDT trade ideas

UNI SHORT SETUPHello, dear traders. how are you ? Today we have a setup to SELL/SHORT the UNI symbol.
For risk management, please don't forget stop loss and capital management
When we reach the first target, save some profit and then change the stop to entry
Comment if you have any questions
Thank You

UNIUSDT 4H Interval- Targets and StoplossHello everyone, let's take a look at the 4H UNI to USDT chart as you can see that the price is moving below the uptrend line and we are still below trending as well.
Let's start by setting goals for the near future that we can take into account:
T1 = $5.53
T2 = $5.72
T3 = $5.89
T4 = $6.04
and
T5 = $6.26
Now let's move on to the stop loss in case the market goes down further:
support zone from $5.44 to $5.14
SL2 = $4.28
Looking at the CHOP indicator, we see that the energy is heavily depleted on the 4H interval, the MACD indicates a local downtrend, while the RSI is at the lower end, which could potentially indicate upcoming increases.

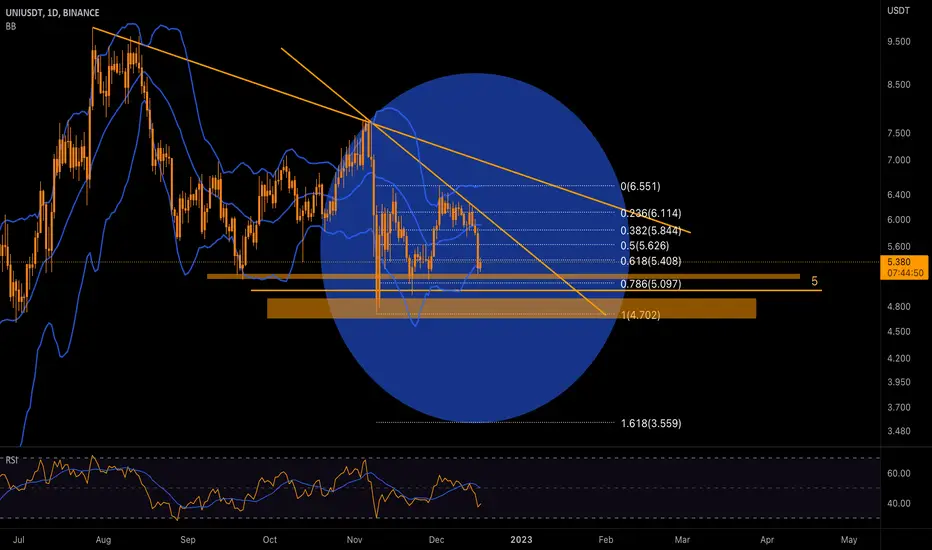
UNI - Technical review and analysisUNI had a completely downward trend during the last week. Its price, which was placed on a support in the $5.90, was not supported by buyers, and due to the negative market atmosphere and falling prices, this currency also fell like all altcoins. Heavy pressure and a high sales volume have caused a complete break of the specified support and hit support in the range of $5.15 to $5.22. But due to the high slope of the downward trend, there is a possibility of continuing the downward movement and encountering more important support in the range of $4.65 to $4.90. The number 5 dollars is placed between these two areas, and we can expect the UNI currency trading trend to continue at this price for some time. Some dynamic resistances must be broken upwards to return to the upward trend. Due to the greater strength of bearish candles, this mode needs a lot of time. If selling pressure decreases next week, we expect a range trend from UNI.
UNISWAP IDEA HELLO GUYS THIS MY IDEA 💡ABOUT UNIUSDT nice to see strong volume area....
Where is lot of contract accumulated..
I thing that the sellers from this area will be defend this SHORT position..
and when the price come back to this area, strong sellers will be push down the market again..
DOWNTREND + SUPPORT from the past + Strong volume area is my mainly reason for this short trade..
IF you like my work please like and follow Thanks

all downside targets hit, now time for a rally? 👀🚀on December 2nd I pointed out the clear resistance areas and said look for downside before next rip!
now that all 3 of my downside targets have been hit, I am watching for potential rally back to resistance zone 🎯
last chart from me today, hope you all have a lovely weekend. seen you soon with more.. please dont forget to boost and follow to show your support💙 thanks

UNI/USDT possible short positionHey colleagues
UNI/USDT is going to be first coin of the day. We see a nice triangle formation is forming on 2hr chart which is at the end phase currently. We also see that EMA100 is going for a crossover against EMA200 which is usually the sign of Bearish reversal.
So...Good possibility that the lower side of triangle formation is going to break and result a run towards our green zone
If you like ideas provided by our team you can show us your support by liking and commenting.
Yours Sincerely,
Swallow Team 🔱
Disclamer:
We are not financial advisors. The content that we share on this website are for educational purposes and are our own personal opinions.

UNI ANALYSIS#UNI UPDATE.
#UNI is currently trading in ascending triangle with blue box area as the resistance and the blue line as the support.We might see pullback in uni in next 1-2 days if uni loses the blue trend line support and test the red box support area .


UNIUSDT still legit?#UNIUSDT
the pair made the first FAKE BREAKOUT (as seen in the image below)
than managed to stay above the FIB_PARALLEL_CHANNEL ... a very good sign to be bullish
as for me, a ZILLIONAIRE , i'll wait for one more GREEN CANDLE to enter the trade.
it will reach the -100% FIb target and i will make a ZILLION dollar
#STOP_BEING_POOR

UNI. Crossroads.On the one hand, we have been testing the upper line of the descending channel since August and are preparing for breakdown with $19.7 target. On the other hand, the price has formed a descending triangle with $3 target. Which of the options will be valid will decide the global trend.

UNIUSDTHello Crypto Lovers,
Mars Signals team wishes you high profits.
This is a 4-hour-time frame analysis for UNIUSDT
Here we have R2 and R1 as the resistance areas that represent the unsuccessful attempts of price to rise. S2 used to be another resistance area and S1 is our support line with its well support of price at different points. At the present, we have the fluctuation of price at R1 and we predict two scenarios to happen. Either it will give us some rising sings and an increase is there for it to reach R2. Or it is probable that the price is not supported at R1 and would experience a decline down to lower amounts such as S2. Please follow our analyses and updates if you are looking for more profits.
Warning: This is just a suggestion and we do not guarantee profits. We advise you to analyze the chart before opening any positions.
Wish you luck

UNIIdea: The price has broken the upper limit of the bullish flag. The price must break through a large cluster of daily and weekly MAs to continue rising.

#Uniswap Solid in a Bullish Uptrend, UNI May Retest $7.8Past Performance of Uniswap
Uniswap is solid and bullish at spot rates. Although the crypto market is turning higher, UNI is mainly in a consolidation. The rejection of bears of early November and the steady higher highs relative to the lower BB is massive for optimistic buyers. In the short term, the primary support lies at H2 2022 lows at around $5. On the other end, resistance is at $7.8 and $9.6.
#Uniswap Technical Analysis
Despite the dump in crypto prices, Uniswap remains within a bullish formation, looking at the performance in the daily chart. UNI has support at around $5, flashing with the 78.6 percent Fibonacci retracement level of the June to August 2022 trade range. Presently, the revival of BTC could lift UNI from spot rates. Therefore, as long as UNI is above $5 and $5.78, traders can buy the dips targeting November high at $7.8. However, there can be a clearer entry above $6.5 or December high. A high volume close above the current consolidation and this liquidation level may fast-track the surge to November high and $9.5 or August high.
What to Expect from #UNI?
Uniswap prices may be turning the corner as market conditions improve. Traders expect more gains in the days ahead. This outlook will remain valid as long as UNI is above $5.7 and above the recent consolidation.
Resistance level to watch out for: $7.8
Support level to watch out for: $5.7
Disclaimer: Opinions expressed are not investment advice. Do your research.

uniusdt 2h 1hFive Elliott wave is forming...
The possible entry and exit point is clear in the picture
Be lucky and rich...

#UNIUSDT🚨Signal Type🚨: 🔴 SHORT #UNIUSDT
💫Leverage: Cross (5X - 20X)
🎪Entry Targets:- 5.970-6.000
🎯Profit Targets:
👑Tp1 :- 5.900
👑Tp2:- 5.840
👑Tp3:- 5.820
👑Tp4:- 5.,780
👑Tp5:- 5.700
❌Stop Targets: 6.020
Signal by : 🇱🇰 @EshangaThejanBandara☎️

#UNI/USDT - Long - Potential 33.26%#UNI/USDT - Long - Potential 33.26%
Strategy: Long
Exchange: Multi-Exchange
Account: Spot
Entry mode: DCA Limit
Invest: 5%
Exit:
Target 3 : 7.77 39.56%
Target 2 : 6.5 16.75%
Target 1 : 6.08 9.21%
DCA Entries
Entry 1: 5.85 - 25%
Entry 2: 5.64 - 25%
Entry 3: 5.39 - 50%
Current market price: 5.84
Stop: 5.11 (-8.22%)
Technical indicators:
24h Volume: 9710601.0431
Satoshis: 5.84
Could see a market pump (or at least some wild volatility) over the next 72 hours with CPI data set to be release. DEX tokens could respond well to volume increasing following the mistrust in CEX's caused by FTX.
UNI is bouncing from support in a bullflag. Given the high chance of volatility I'm DCA'ing entry t manually manage if we see a sudden drop in price.
Trade: UNIUSDT 12/12/2022 12:13
Account: SPOT
Volume last 24h: 9710601.04 USDT

Uniswap/USD Bullflag Bullish BAMM ProjectionWe have Hidden Bullish Divergence above all the Moving Averages and near the BAMM triggerline, if all gues as expected we should see $7.43

#UNIUSDTPERP - Potential 3% Scalp#UNIUSDTPERP - Potential 3% Scalp
Entry Conditions:
- Broken local trendline + retest
- Regression breakout
- Trading above all key moving averages (20DEMA, 50DEMA, 200 1h EMA)
- Filled weekly pivot

Only Up📈 Bull Flag Formed At The Chart And The Price Is About To Breakout The Resistance ,First Target Is 7$

UNIUSDT 1D Interval- Targets and StoplossHello everyone, let's look at the 1D UNI to USDT chart as you can see how we can see the price moving below the downtrend line marked in yellow.
Let's start by setting goals for the near future that we can take into account:
T1 - $6.68
T2 - $7.29
T3 - $7.91
T4 - $8.76
and
T5 - $9.85
Now let's move on to the stop loss in case the market goes down further:
SL1 - $5.81
SL2 - $4.72
and
SL3 - $3.33
Looking at the CHOP indicator, we see that on the 1D interval, the energy is starting to slowly increase, while the MACD indicator shows an uptrend, and the RSI shows that we still have room for further growth.

uniif the candle 15min closed under the line or same shape we can open the short position with RR2 if rsi broke 30 it will be more safely

UNIIdea: The price is forming a descending triangle. The daily 50 EMA is a key support level. The price may bounce to the upper border of the pattern. Breakout of the lower border of the triangle will be a strong reversal signal
