Uniswap (UNI) 1DAY UPDATE BY CRYPTOSANDERSHello dear traders, we here new so we ask you to support our ideas with your LIKE and COMMENT, also be free to ask any question in the comments, and we will try to answer for all, thank you, guys.
Uniswap ( UNI ) UPDATE:- uniswap (UNI) was one of Friday’s biggest losers, as prices fell by nearly 8%.
UNI/USD, which rose to a peak of $6.49 during yesterday’s session, slipped to a low of $5.85 earlier today.
As a result of today’s sell-off, uniswap fell below a key support point of $5.95, hitting its lowest point since October 13 in the process.
Friday’s decline in price has also pushed the RSI to a floor of 42.30, which is the weakest point for the index in the last ten days.
Currently, uniswap has rebounded from its earlier lows, and as of writing is trading at $5.95.
This shows a level of bullish momentum still remains in the market, despite prices now falling for a second consecutive session.
Sorry for my English it is not my native language.
Hit the like button if you like it and share your charts in the comments section.
Thank you
UNIUSDT trade ideas


UNIUSDT SHORT POSTION Timeframe Day " Symmetrical Triangle "
Timeframe Hour " Ascending Wedge "
2 Scenario
First is go down right now !
Second make a Perfect Ascending Wedge then go down !
First Target is Fibo 0.618
Good luck, NFA

UNI USDT SHORTWith a tight stop loss and a good taking profit sentiment.
Saw an opportunity to short this.
Disclaimer:
DYOR and TAYOR.


UNI : BREAKOUT POSSIBLITYUNI: BREAKOUT POSSIBILITY
Low time frame coin.
we will follow to see the trend.
Markets can be very hard, so please think about your SL on any trades you made.❤️

UNI MULTIPLE PATTERNSUNI Symmetrical Triangle DTF.
Bull target top of the range and Bear target bottom of the range.
Ascending Triangle leading up to the mid range, lets see if we can break the MID RANGE for continuation.
Nice simple trading setup for long or short trade.

Uni Will Dump Moreas you can see Uni is rejected its supply zone daily and also broken dynamic support, it seems in 1h engulfing is happening, it shows more dump is on the way,
my chart is clear, focus on that you will get everything...
I consider all analyses performed in relation to that trade position.
Our analysis is not a buy or sell referral.
If you found our analysis useful and interesting, feel free to share it so that more individuals might benefit from it.
And please don't forget to like and comment; we will read them all.

UNI POTENTIAL SELL SET UPAfter Uni took liquidity on our demand orderblock at $5.5-5.7 and long position is up 13% on 1x, will be looking at the reaction at $6.85 for a possible sell, will ladder orders between 6.85-$7 and cut profits down to $6, if it doesnt play out, will cut at $7.2, all risk involved is less than 5% and traders advised to manage risk and not use more than 5-7x as leverage, also not more than portfolio risk size, also reminder that our previous long is up 13% already. so RR is good.......

🟢 UNIUSDT - 1D (22.09.2022)🟢 UNIUSDT
TF: 1D
Side: Long
Pattern: Bull Pennant / Falling Wedge
Leverage: 5x
SL: $4.7202
TP 1: $6.2473
TP 2: $6.9297
TP 3: $7.4812
Looks like it wants to make powerful moves soon.


UNIUSDT 4H Time Frame.As can be seen, in the 4-hour time frame, the price is completing the correction. According to Elliott's theory, we are now in wave 3 of this correction, and if all five waves of this correction are completed, a buying position can be taken in the price range of $5.5 to $5.56. .
Thank you very much for your attention.

UNI/USDT 9% move towards downside expected, selling uni here. UNI/USDT is clearly rejected from its resistance, also broke its trendline and retested it.
clear H&S is in progress, once it is broken, it will test 6.00 area, so initial TP is set at 6.00.
BEST OF LUCK!!

UNI LONGWhat I see from the price in the daily time frame is a strong upward movement.
Price correction up to the 50% Fibonacci area, which coincides with the static support area .
What I expect is the end of the correction and the beginning of the upward movement .
UNIThe price has formed a rising wedge and several bearish signals - a slight correction is possible after breaking through the lower border of the pattern

UNI Mid term speculationmiddle term speculation based on fibonacci and price action. Might be tradeable but not an indication

UNI/USDTUNI/USDT
It is in a descending channel.
An inverted head and shoulder is formed.
In my opinion, it can increase the price up to the ceiling of the channel.
#UNIUSDT #UNI #BTCUSDT #BTC #ETHUSDT #DOGE #DOGEUSDT

UNİ⚡⚡ #UNİ/USDT ⚡⚡
Exchanges: Binance Futures
Signal Type: Regular (Long)
Leverage: Cross (20X)
Entry Zone:
1) 6.07
2) 5.96
3)
Take-Profit Targets:
1) 6.28
2) 6.43
3) 6.54
4) 6.66
Stop Targets:
1) 5.79
Trailing Configuration:
Entry: Percentage (0.5%)
Take-Profit: Percentage (0.5%)
Stop: Moving Target -
Trigger: Target (1)

UNIUSDTHello Dear friends
In the four-hour period, the negative divergence of the RSI has been issued to us, but we do not have another signal to form a corrective trend!
And as long as the upward trend line is maintained and the movement trend is not placed below the price range of $6.39, the probability of breaking the resistance range of $7.25 is high.
We would be happy to hear your comments


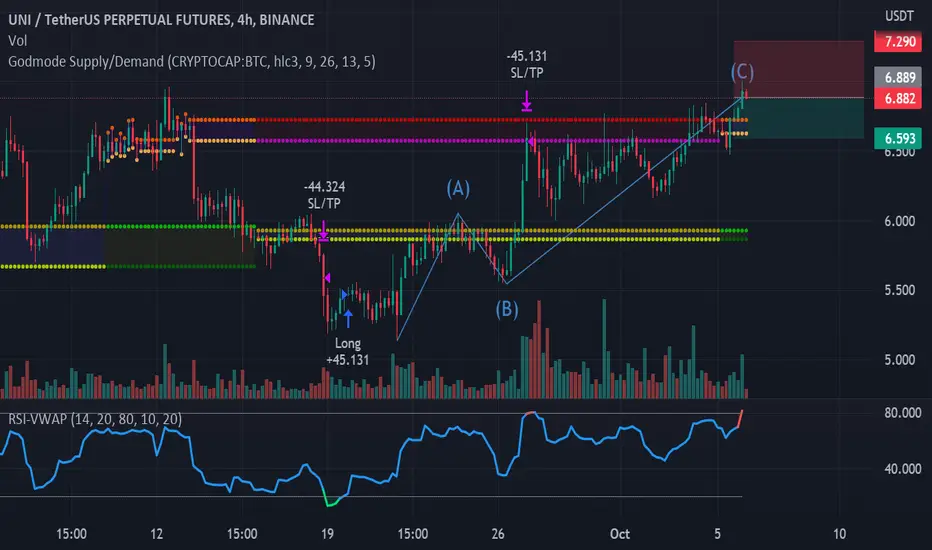
4h harmonic pattern UNIEntry price :6.891
Stop Price : 7.290
Take Price : 6.593
RSI : 68.47
RSI Divergence : Yes
UniswapIf Uniswap daily candle breaks the support line and closes under 6.55$, the price will continue falling

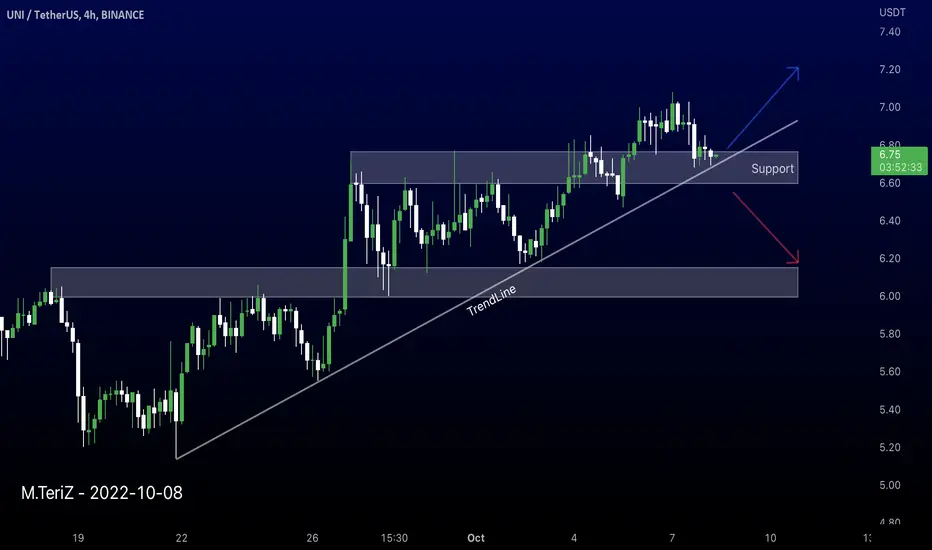
UNIusdt 4H TrendLine support According to the trend line, we expect the price to increase from the specified level, otherwise, the fall will become stronger with the failure of the support zone.
Its not Buy or Sell SIGNAL
DYOR
BY : M.TeriZ - @AtonicShark