uniif the candle 15min closed under the line or same shape we can open the short position with RR2 if rsi broke 30 it will be more safely
UNIUST trade ideas

UNIIdea: The price is forming a descending triangle. The daily 50 EMA is a key support level. The price may bounce to the upper border of the pattern. Breakout of the lower border of the triangle will be a strong reversal signal

Leg lower is likely for UNI🥶trend support flipped to resistance/resistance zone + RSI resistance
I can see potential dip to 5.5-6.10 targets before next leg up, drop boost and follow for more!
also hope you all have a great weekend, see you soon with more charts <3

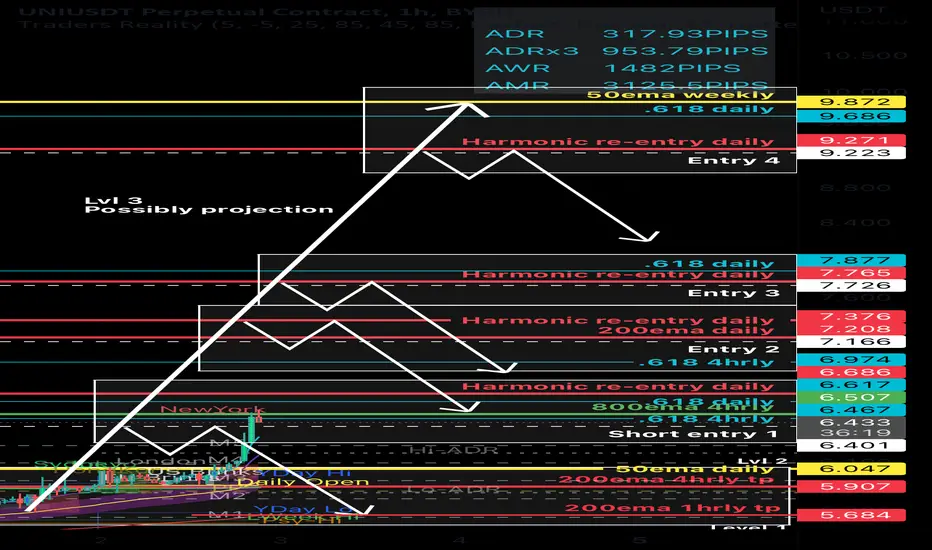
UNI - Potential SHORT - 1hrly-DailyTF - Bybit: UNIUSDTPERPTrading view post:
Trade Status: ACTIVE
Trader: Drizzzled (AUS)
Trade Type: SHORT
(RE-ENTRY/DCA/LADDER previous entry post
Entry 1: 6.401 (entry 1 box options)
-if missed focus on next entries. Don’t stress.
Entry 2: 7.166 “”
Entry 3: 7.726 “”
Entry 4: 9.223 “”
Entry 5:
Entry 6:
Entry 7:
Stop Loss/ladder entries:
Entry 1:
-slightly above your re-entries
-5-10% move from your chosen entry 1
-slightly above/below entry/key resistance
-1:1 or to own personal risk factor
Entry 2: “”
Entry 3: “”
Take Profit Targets:
-5.907 (200ema 4hrly tp)
-5.684 (200ema 1hrly)
-
Comments:
-move stop loss to break even once target 1 is hit. DCA entries above/below if stop loss is hit.
-emas will rise/drop with time so shift tp accordingly. If we re-enter higher/lower our same emas become our take profits. Also i have put boxes around key supports which I may choose to take earlier or later profits at too.
-by all means you can long from the daily open to these higher target ‘short’ entries.
-you don’t have to enter at ‘entry 1’ if you would rather enter higher.
-level 1,2 or 3 ,pumps/moves, can go higher and create new levels, hence the re-entries. It’s a shorter time frame strategy.

UNI - Potential SHORT - 1hrly-DailyTF - Bybit: FTMUSDTPERP Trading view post:
Trade Status: ACTIVE
Trader: Drizzzled (AUS)
Trade Type: SHORT
(RE-ENTRY/DCA/LADDER previous entry post
Entry 1: 6.401 (entry 1 box options)
-if missed focus on next entries. Don’t stress.
Entry 2: 7.166 “”
Entry 3: 7.726 “”
Entry 4: 9.223 “”
Entry 5:
Entry 6:
Entry 7:
Stop Loss/ladder entries:
Entry 1:
-slightly above your re-entries
-5-10% move from your chosen entry 1
-slightly above/below entry/key resistance
-1:1 or to own personal risk factor
Entry 2: “”
Entry 3: “”
Take Profit Targets:
-5.907 (200ema 4hrly tp)
-5.684 (200ema 1hrly)
-
Comments:
-move stop loss to break even once target 1 is hit. DCA entries above/below if stop loss is hit.
-emas will rise/drop with time so shift tp accordingly. If we re-enter higher/lower our same emas become our take profits. Also i have put boxes around key supports which I may choose to take earlier or later profits at too.
-by all means you can long from the daily open to these higher target ‘short’ entries.
-you don’t have to enter at ‘entry 1’ if you would rather enter higher.
-level 1,2 or 3 ,pumps/moves, can go higher and create new levels, hence the re-entries. It’s a shorter time frame strategy.
UniusdtHi. We see a rising wedge pattern that has bearesh potential. Target mentioned in charge. Thx for comment.

Short UNI @ 5.950 10x leverageAfter the bullish momentum Jerome's speech gave the markets, UNI has skyrocketed to 6.000 USDT.
I believe this is another reaction rally and we won't be able to find support, so I'm going to open up a UNI position. I may add onto this as time goes on.
Our 4-hour chart is starting to signal overvalued but the TOTAL doesn't have the momentum to keep this push up forward.
We're about to break up over our Ichimoku cloud of resistance. Typically when this happens we'll see a small rally then a sharp drop. There are no layers of support or resistance in our current area.
Our momentum indicators, MACD and TSI and also slowly pulling back.


UNISWAPHello this is my tradin idea about UNIUSDT Thank you
LIKES and FOLLOW for more ideas Thank you .

UNI SHORT @ $5.18 BINANCE:UNIUSDT
Gartley pattern
Entry: $5.82
SL: $6.13
TP1: AD 0.382 $5.49
TP2: AD 0.618 $ $5.28

UNIIdea: The price rose to the upper border of the symmetrical triangle. Breaking through the upper border of the pattern will raise the price to the resistance of $5.7. A powerful pump can push the price up to a cluster of MAs

UNIUSDT 4H Interval- Targets and StoplossHello everyone, let's look at the 4H UNI to USDT chart as you can see that the price is moving above the local downtrend line.
Let's start by setting goals for the near future that we can take into account:
T1 = $5.63
T2 = $5.84
T3 = $6.06
T4 = $6.35
and
T5 = $6.74
Now let's move on to the stop loss in case the market goes down further:
SL1 = $5.27
SL2 = $5.04
SL3 = $4.86
SL4 = $4.67
and
SL5 = $4.41
Looking at the CHOP indicator, we see that the energy is strongly charged on the 4H interval, while the MACD indicator indicates a local uptrend.

UNIUSDT Elliott Waves AnalysisHello friends.
Please support my work by clicking the LIKE button👍(If you liked). Also i will appreciate for ur activity. Thank you!
Everything on the chart.(update)
Almost nothing has changed from my last idea,
We complicated the corrective structure to a double zigzag (wxy),
I still expect that UNI should to show good growth.
Entry: market and lower
Targets: 7.5 - 10 - 12
Main Target zone: 12 - 15$
after first target reached move ur stop to breakeven
Stop: ~3.4 (depending of ur risk). ALWAYS follow ur RM .
Risk/Reward: 1 to 6
risk is justified
Good luck everyone!
Follow me on TRADINGView, if you don't want to miss my next analysis or signals.
It's not financial advice.
Dont Forget, always make your own research before to trade my ideas!
Open to any questions and suggestions.

UNIUSDT| SETUPUNIUSDT has been trading in a bearish trend.
The price has now broken above the falling resistance.
The price is now approaching to the support zone.
The bulls can show strength at that point.
Manage your trades accordingly.

UNIUSDT | Scalp deal, channel exit!Hello trader Today I have prepared a new idea for you. Like and subscribe to the channel there is a lot of useful information✅
The chart showed an ascending channel with clear boundaries.
If you pay attention to the lower zone of the channel, then we will see a strong compression of the local support, which means that soon we will see a breakout of the lower border approximately to the $5.30-5.15 zone
Usually, this pattern works out through downward movements in most cases, but I would recommend taking no more than 2-3% of the deposit for a deal, as it looks very risky and therefore it is better to work with a short stop order.

UNIUSDT is creating a rising wedge
The price is creating a rising wedge on the 0.618 Fibonacci level on the 4h timeframe
How to approach it?
If the price is going to lose the support, According to Plancton's strategy , we can set a nice order
–––––
Keep in mind.
🟣 Purple structure -> Monthly structure.
🔴 Red structure -> Weekly structure.
🔵 Blue structure -> Daily structure.
🟡 Yellow structure -> 4h structure.
⚫️ black structure -> <= 1h structure.
–––––
Follow the Shrimp 🦐

#Uniswap within a bullish pattern, UNI strong support at $5Past Performance of Uniswap
Uniswap is remarkably resilient at spot rates, steadying above the multi-week support line and within a bullish path from a top-down preview. In the last 24 hours, UNI rose three percent, and prices remain inside the November 9 bearish engulfing bar, a bearish preview.
#Uniswap Technical Analysis
UNI has support at around $5, flashing with November 9 lows and within Q3 2022 range. At spot rates, UNI has retested the 78.6 percent Fibonacci retracement level of the June to August 2022 trade range, meaning buyers stand a chance. If prices are above $5, swing traders can load the dips in alignment with Q3 bulls, targeting $9.5—or August 2022 highs. However, for conservatives, there could be more opportunities once there is a solid recovery, reversing the losses of November 9. Based on the current formation, there is a risk of UNI plunging below $5 in confirmation of early November losses, pressing UNI towards June lows at around $3.20.
What to Expect from #UNI?
Bulls are confident, but there must be clear, high-volume gains above $6.5 as confirmation of November 10 losses. In either case, buyers must prove resilient, soaking in selling pressure and sustaining prices above $5 for the continuation of bulls of early Q3 2022.
Resistance level to watch out for: $6.5
Support level to watch out for: $5
Disclaimer: Opinions expressed are not investment advice. Do your research.

UniSwap Wave C Target 4.93UniSwap Trade in the middle of Wave C that Target level 4.93 Break above 6.40 Cancel this Idea

Uniswap (UNI) forming bullish Gartley for upto 17% moveHi dear friends, hope you are well and welcome to the new trade setup of Uniswap ( UNI ).
Previously I shared a long-term trade setup for UNI , which is still in play:
Now on a 4-hr time frame, UNI has almost completed a bullish Gartley pattern.
Note: Above idea is for educational purpose only. It is advised to diversify and strictly follow the stop loss, and don't get stuck with trade

Fake breaking?!During the last week, UNI has registered a range below the resistance range of $5.95 to $6.35. The selling pressure observed in this currency in the past weeks has caused the price trend to change from upward to downward in the daily time. Considering the general situation of the market, the possibility of further price reduction and return to lower supports is more likely. In order to determine the fluctuation situation more precisely, we can consider a short-term ascending channel below the resistance in the 4-hour time frame.
The breaking of the bottom of the channel in the range of 5.71 to 5.76 and the closing of the 4-hour candle below it can be a sign of continuing the downward trend and moving towards the main supports. The first support is in the area of the previous floor at the price of $4.72-$5, but if the price hits this area with an upward slope, the probability of breaking this support will increase. In this case, the second support, which is considered in the range of 2.96 to 3.5 dollars, can be the second target of the sellers. With a very high probability, we expect a positive reaction from this area, especially at the price of $3. So, we conclude that if the selling pressure is high, there is a possibility of the failure of the previous fake floor in the weekly time frame.

buy the best coin of decentralized Exchange !! Best zone for BUY UNISWAP ( UNIUSDT )
BUY in 2 steps at 3.5 - 2
RES. 6 - 9 - 11.5 - 16
MAX RISK 1%


UNIUSDT, 1HBINANCE:UNIUSDT Bullish Gartley (Targets Pending) & Potential Bearish Bat (CD leg pending)
C to D leg Bat can extend to 1.618 to 2.618 of fib retracement
