Let's see how it goes. www.youtube.com
"The true strength of any government, military, or society lies in its commitment to protect civilians. When that principle is compromised, we lose the very reason these institutions exist. Power must serve humanity, not harm it."
US500.F trade ideas

SPX short analysisLike I wrote in my EUR/USD analysis you never know what could happened.
USA bombed Iran!
This could have huge impact on the US market next week.
My guess is temporarily short... At least to close this gap in spot price of SPX.
Since we're still in bearish market, until we see new highs, and this could be catalyst for another sell off. So the jump could be even bigger and we could see new ATH this year.
For now, I'm seeking a position to short tomorrow after market is open.
This is my entry mark.
There will be higher volatility. However, I expect US market to open in the red, close the gap and to sell off again.
We shall see!
Trade safe this one :)

S&P500 Bullish breakout support at 6040 The US dollar hit a three-year low and Treasury yields declined after reports suggested Donald Trump may replace Fed Chair Jerome Powell earlier than expected. Investors interpreted this as a sign that rate cuts could come sooner, adding uncertainty to the outlook for the dollar and US bonds—already under pressure from tariff concerns and a growing fiscal deficit.
Oil Sector:
Shell ruled out a takeover bid for BP, putting to rest speculation of a potential mega-merger between the two energy giants. Despite BP's weak stock performance and activist pressure, Shell appears unwilling to pursue a deal.
Corporate Highlights:
Nvidia shares hit a record high, once again becoming the world’s most valuable company.
Xiaomi launched its first electric SUV, the YU7, aiming to challenge Tesla’s Model Y.
Shell denied reports of merger talks with BP, reaffirming its current strategy focus.
Key Support and Resistance Levels
Resistance Level 1: 6145
Resistance Level 2: 6178
Resistance Level 3: 6210
Support Level 1: 6040
Support Level 2: 6010
Support Level 3: 5978
This communication is for informational purposes only and should not be viewed as any form of recommendation as to a particular course of action or as investment advice. It is not intended as an offer or solicitation for the purchase or sale of any financial instrument or as an official confirmation of any transaction. Opinions, estimates and assumptions expressed herein are made as of the date of this communication and are subject to change without notice. This communication has been prepared based upon information, including market prices, data and other information, believed to be reliable; however, Trade Nation does not warrant its completeness or accuracy. All market prices and market data contained in or attached to this communication are indicative and subject to change without notice.

06/30 Weekly Gamma Exposure Outlook🧠 SPX Weekly Outlook — Gamma Breakout + Short Week Setup
The bulls finally broke through after weeks of painful grinding — and they did so with force.
📈 Thursday & Friday brought a textbook gamma squeeze as SPX sliced through the long-standing 6100 call wall , triggering sharp upside acceleration.
We are now firmly in positive Net GEX territory.
🔺 Entire GEX structure has shifted higher.
🎯 New squeeze zone at 6225 , with major call resistance near 6200 .
🔍 What Just Happened?
📊 The 6060–6120 zone acted as a tough resistance range for weeks — until last week’s breakout.
💥 Put skew collapsed , suggesting downside hedges are being unwound.
📉 VIX and IV keep dropping , confirming a shift toward lower-volatility environment .
🧲 Strong Net GEX across expiries created sustained upward dealer pressure → we’re in long gamma mode .
✅ Bullish Bias — But Stay Tactical
We're in a bullish gamma regime , so dips are likely to be bought.
Key pullback zone to watch: 6125–6060 .
🛠️ Strategy Ideas:
• Wait for a 6060–6125 retest before re-entering longs
• Use shorter-DTE bull put spreads or 0DTE gamma scalps above 6130+
• Scale out or trim risk near 6200–6225
⚠️ Risks to Watch
We’re overextended short-term.
🚨 Losing 6130–6125 could spark a quick flush to 6050 .
Bearish signals to monitor:
• IV spike or renewed put buying
• Loss of 6100 = no-man’s land without confirmation
• Consider short-term debit put spreads if breakdown confirms
🗓️ Short Trading Week Note
🇺🇸 U.S. markets closed Friday, July 5 for Independence Day.
This compresses flows into 4 sessions. Expect:
📌 Early week dealer hedging
📌 Possible positioning unwind on Thursday
💡 Weekly Trade Idea — Structure in Place
💼 Setup:
• Put Butterfly below spot
• 3x Call Diagonal Spreads above spot (5pt wide)
• Slight net negative delta , 11 DTE
🎯 Why it works:
• Leverages IV backwardation
• Profits from time decay
• Favors a stable or modestly bullish week
• Takes advantage of horizontal skew (July 11 vs July 14)
💰 Profit Target: 10–20% return on ~$1,730 risk.
Take profits before time decay kills the center valley — don’t overstay. 🏃💨
📌 Final Thoughts:
The 6100 breakout was technically & gamma-structurally significant ,
but big moves often retest before continuing.
Let price breathe.
Stay aligned with gamma exposure profile. 🔄

S&P 500 , UPDATE CHART Uptrend
I closed all my open positions when the price was near the All-Time High (ATH) and observed a bearish candle at the end of June 11th. Now, the chart is attempting to break the resistance (S/R) level again. However, I've noticed a divergence between the main chart and the Awesome Oscillator (AO), which leads me to believe we will either see a correction below this level or a pullback after a potential breakout. I am waiting for one of these scenarios to materialize before re-entering with new buying positions.


July 9th EU-US tariff deal, what will happen to S&P500?Timeline & Context
-The U.S. initially implemented a 10% baseline tariff on most imports (April 5), with potential spike to 50% for EU goods on July 9 unless a deal is struck.
-On June 26, Macron warned that if U.S. keeps a 10% tariff, the EU will impose equivalent retaliatory levies.
-EU offer of “zero-for-zero” (Macron, von der Leyen) remains on the table, though Washington reportedly resists.
How Markets May React
If a 10%–10% deal is struck (U.S. keeps 10%, EU matches):
-Markets will likely breathe a sigh of relief—clearing headline risk.
-Expect a moderate rally, perhaps +1–3% in the S\&P 500, as tariff uncertainty diminishes.
-Economists note past discussion: when the EU delay hit May, S\&P futures jumped ~2%.
If they agree to Macron’s “zero-for-zero” proposal:
-That would be a bullish surprise—tariffs completely lifted.
-Market response could range +3–5%, though EU has indicated U.S. pushback on full zerozero .
-Analysts warn clarity isn’t always calm: the S\&P is already priced above fundamentals—choppy reactions still possible .
If the pause lapses with no EU agreement:
-U.S. could enforce 50% tariffs; EU likely retaliates.
-Risks: recession fears in EU, U.S. inflation spike so stocks will likely fall.
-Bank strategists forecast flat S\&P (5,900), but warn of volatility range 5,600–6,000 based on trade policy surprises.
-Disclaimer: This analysis is for informational and educational purposes only and does not constitute financial advice, investment recommendation, or an offer to buy or sell any securities. Stock prices, valuations, and performance metrics are subject to change and may be outdated. Always conduct your own due diligence and consult with a licensed financial advisor before making investment decisions. The information presented may contain inaccuracies and should not be solely relied upon for financial decisions. I am not personally liable for your own losses, this is not financial advise.

SPX -TINAUnlimited money sloshing around means no end to upside in the markets. When the Fed finally lowers interest rates, all markets will go crazy. Calling for 7,500. Go big!!

DXY, EURUSD & SP500 Daily Trade SetupsIn this update we review the recent price action in the Dollar, Euro & SP500 and identify the next high-probability trading setups and price objectives to target. To review today's video analysis, click here!

The fate has already been written, it's in your hands Neo. ;)Fate has already been written and their is no return, get ready ;)

The market bias stays up, MJ stocks may be a buy here. The market continues to be biased up, and the target is likely the weekly B. MJ stocks are showing technical signs that a reversal may come. There may be other sectors similar as I think the summer bottom gamblers will start appearing now that everything else is at the highs. Gold looks like it will eventually go lower. Nat gas lost support and is likely to go lower. USOIL is bear flagging.

52 W hi Capitalize on the around-the-clock liquidity of S&P 500 futures , and take advantage of one of the most efficient and cost-effective ways to gain market exposure to a broad-based, capitalization-weighted index that tracks 500 of the largest companies of the US economy
they'll losing they pants. we're selling gang
!!!!!!!!! Lol

S&P 500 (SPX) 1M next week?The S&P 500 is pulling back from a key resistance after completing a bearish AB=CD pattern on the monthly chart. Price action suggests a potential correction toward the 4662–4700 zone, aligning with the 0.618 Fibonacci retracement level, which may serve as a key area for bullish reaccumulation. Momentum indicators show bearish divergence, hinting at a cooling rally.
Fundamentally, the index remains supported by strong earnings in tech and AI sectors, but risks persist from elevated interest rates, sticky inflation, and potential Fed policy shifts. A pullback into the 4662–4700 zone may offer a medium-term setup for continuation toward 5198 and potentially 5338. A breakdown below 4662 would invalidate the bullish structure and shift focus to lower Fibonacci levels.

S&P 500 Daily Chart Analysis For Week of June 27, 2025Technical Analysis and Outlook:
During the current trading week, the S&P 500 Index has predominantly demonstrated an upward trajectory, surpassing the Mean Resistance level of 6046, the Outer Index Rally target of 6073, and the critical Key Resistance threshold of 6150. Currently, the index is exhibiting a bullish trend, indicating potential movement towards the Outer Index Rally objective of 6235. However, it is essential to note that there is a substantial probability that prices may retract from their current levels to test the Mean Support at 6136 before experiencing a resurgence.

LONG SPX TILL 6300+Hi,
I am publishing this idea for educational purpose. I beleive break out has done and spx should touch 6300 t0 6400 zone in future soon.

Is Now a Good Time to Invest in the S&P 500? Is Now a Good Time to Invest in the S&P 500?
The chart shows the S&P 500 in a long-term upward trend, with clear channels indicating zones from "extremely cheap" (bottom green line) to "extremely expensive" (top red line). Currently, the index is trading near the upper part of the channel, in the "expensive" to "extremely expensive" area.
What Does This Mean for Investors?
The current price level suggests the S&P 500 is expensive compared to its historical trend, increasing the risk of a short-term correction.
Historically, buying near the top of such channels has offered less margin of safety and a higher probability of pullbacks in the following months.
Investment idea
It is a good time to start investing gradually (using a dollar-cost averaging strategy, investing a fixed amount each month) rather than making a lump-sum, “all-in” investment with your savings.
This approach allows you to benefit from long-term market growth while reducing the risk of entering at a market peak.
The risks currently outweigh the potential short-term gains, and we could see better prices in the coming months.
In summary:
Now is not the time to go all-in on the S&P 500. Gradually investing each month is a sensible approach, given the elevated risk of a correction and the possibility of better entry points ahead.

SPX/USD Has A Double Top Pattern On The 1Hr Hey Traders and following gang!
Hope all are raking in profits on all your trades.
I spotted this double top setup on the 1hr SPX/USD.
A break below 5980.6 triggers a short down to target-1 5926.3
A break below 5943.8 triggers a short down to target-2 5842.1
A little scuffle in the Mid East helps this market fall so, short the ticker .
Best of luck in all your trades my friends and stay profitable $$$

It seems very simple.Based on the market volume chart, as well as its similarity to previous declines, it seems like we are approaching a reliable bottom. This bottom is not far away and could happen right around 5000. We just have to wait for the daily reversal candle.

Weekly Red Candles Signal Potential PullbackOn the weekly chart, two clean red candles have formed. The price is struggling to move higher — every attempt to break above is being sold off.
An additional factor is geopolitical tension, which puts extra pressure on bullish momentum.
After such an exponential rally, I expect at least a pullback .
Could there be a new high and breakout above resistance? Yes, it's possible.
But the current setup offers a clear stop-loss just 1.60% below the current price — a small and comfortable risk.
This is not a quick trade. I plan to hold the position anywhere from 1 week to 1 month, depending on how the market develops. Therefore, I choose an optimal position size for my account, knowing that margin will be frozen.

Weekly Preview - SPX USOIL NAT GAS GOLD BTCfor SPX to have a good down move, 5900 has to break overnight tonight. 5700 is possible this week. Nat Gas still looks bullish, OIl as well. Gold may go to new highs but that wouldn't necessary be longer term bullish. BTC should continue to drop.

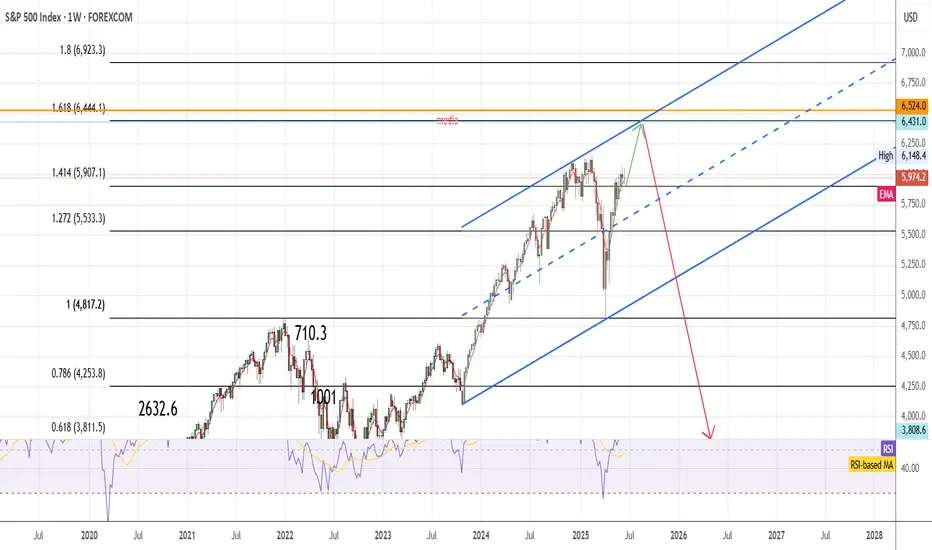
SPX tp 6440 then 3800In my view next month will be bullish for SPX, I expect a test of 6444 area (1.6 fibonacci extension from bullish trend started in 2020) then bearish market will start and push SPX to 3800 area.
MAJOR TOP IS NOW IN PLACE 5th wave up from 4835 has ended 6059The chart posted is that of the sp 500 and I now have counted 5 waves up as ending based on this wave structure I will look for two things to happen a rather deep ABC if there is a bull market intact and it should decline in 3 waves back to .236/382 area from 6059 - 4835 The 4th wave or A low This MUST HOLD at .382 or The cycle has ended the 5 wave sup from march 23 low 2020 I sold longs this morning based on NAAII exposure and Now have moved to a 100 % long VERY DEEP IN THE MONEY PUTS 2027 Best of trades The WAVETIMER

SPX vs VIX: Is this a sign of a bullish market?VIX has seen a strong decline in the past 2 months following the massive surge of Feb-March due to the Tariff War. In contrast, the S&P500 rose massively to almost its ATH, which is a natural response as the two assets are negatively correlated. This VIX pattern has been seen during every major market bottom in the past 15 years, the strongest of which was the 2020 COVID crash. This is a sign of a very bullish market, TP = 6,800 by the end of the year.
## If you like our free content follow our profile to get more daily ideas. ##
## Comments and likes are greatly appreciated. ##
