SPX500 | CPI Day Volatility – Key Level at 6389SPX500 Overview
Today’s market is expected to be highly volatile with the release of U.S. CPI data.
The forecast is 2.8%, higher than the previous reading, indicating inflation remains elevated. A result above 2.8% would likely support a bearish trend for indices, while a figure below expectations could trigger bullish momentum.
Technical Outlook:
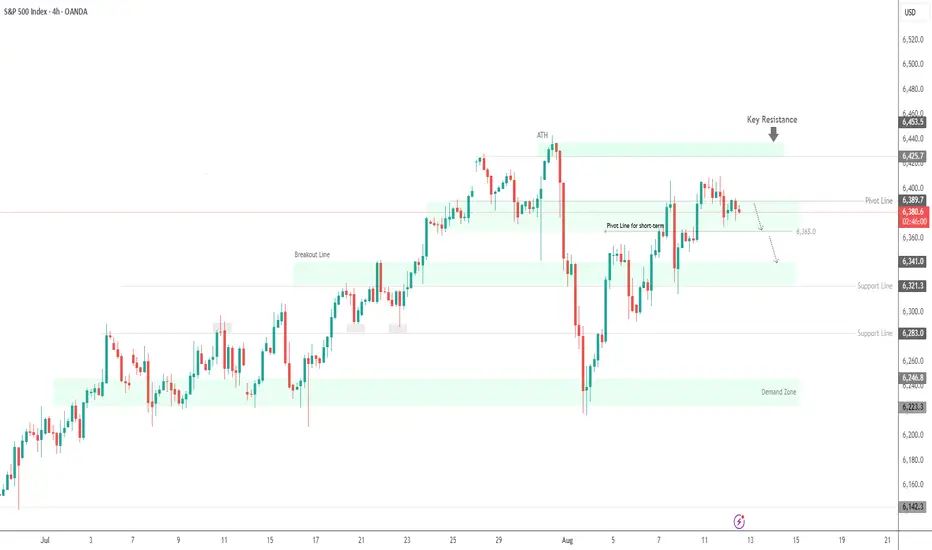
As long as the price trades below 6389, the downside targets are 6365, then 6341, and 6321.
A 1H close above 6389 would shift momentum bullish toward 6425.
Support: 6365, 6341, 6321
Resistance: 6404, 6425, 6438
US500 trade ideas
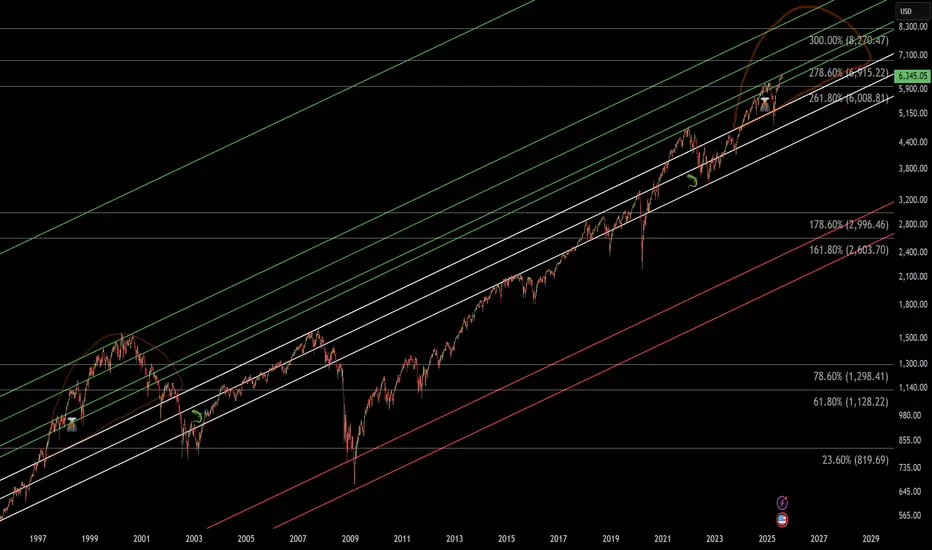
US500 one last leg upI do not want to sound 100% like David Hunter, but I recon max upside in this cycle is approaching and will be somewhere between 7000$ to 7400$, from there a correction of at least 25% is very likely

S&P 500 Futures Hold Ground After Tariffs Take EffectS&P 500 Futures Rise After New Tariffs Kick In
President Trump's sweeping tariffs officially took effect just after midnight, escalating trade tensions with dozens of countries. While negotiations are ongoing behind the scenes to secure exemptions and reduce tariff rates, market reactions are already underway.
Technical Outlook
S&P 500 Futures continue to show bullish momentum as long as price trades above 6289, with the potential to retest the All-Time High (ATH).
To confirm a move toward 6453, price must close above 6437 on the 1H chart.
🔻 However, if the price stabilizes below 6389, a correction toward 6365 becomes more likely.
Key Levels:
🔹 Resistance: 6424 – 6453
🔹 Support: 6365 – 6341

SPX500 | Holding Above Key Pivot – Path to New ATH or Pullback?SPX500 Overview
S&P 500 futures are up 0.2% early Monday, with traders preparing for a week filled with key economic events. While tariff concerns remain in the background, market focus is firmly on upcoming U.S. inflation and retail sales data.
Technical Outlook:
The price has stabilized above 6389, indicating the potential for the bullish trend to extend toward 6425. A breakout above this level could lead to a new all-time high.
Conversely, a 1H close below 6389 would signal a potential bearish move toward 6365.
Resistance: 6413, 6425, 6442
Support: 6365, 6341, 6321

US500 Short Setup: Bearish Momentum Toward 6205Currently holding a short position on the US500 from the 6358 level, based on Smart Money Concepts. Price has tapped into a premium zone within a higher time frame supply area, showing clear signs of distribution. Liquidity has been swept above recent highs, and a shift in market structure confirms bearish intent. I’m targeting the 6205 level, expecting a rapid downside move in the very short term as smart money drives price toward discounted levels.

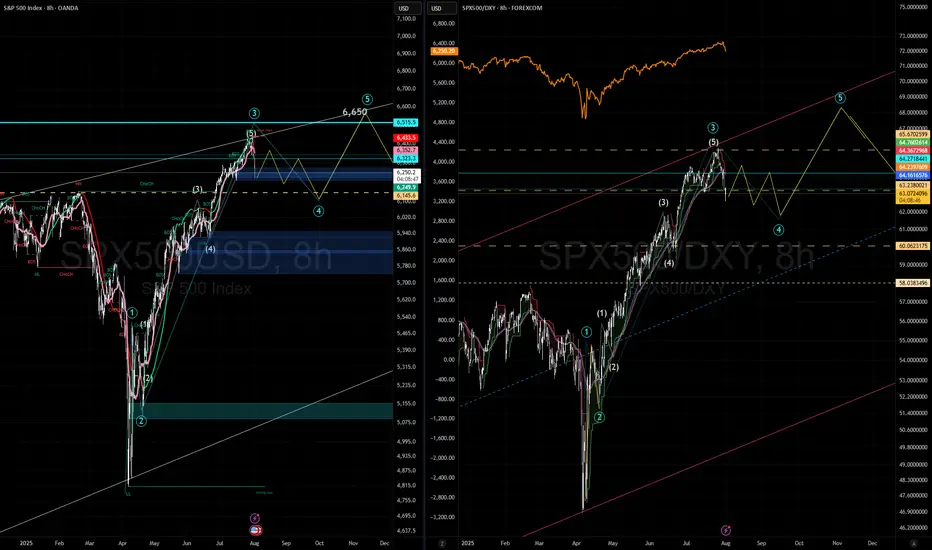
S&P500’s Bullish Island Turns Risky: Elliott Wave Says “Top”The S&P500 Index( SP:SPX ) started to rise and even created a new All-Time High(ATH=$6,428) with the help of the Bullish Long Island Pattern , as I published in my previous idea on May 14, 2025 .
The S&P500 Index is currently moving near the Potential Reversal Zone(PRZ) , upper line of the ascending channel , the Important Resistance line , and the Yearly Resistance(1) .
In terms of Elliott Wave theory , the S&P500 Index appears to be completing microwave 5 of microwave 5 of the main wave 5 .
Also, we can see the Regular Divergence(RD-) between Consecutive Peaks .
I expect the S&P500 Index to correct at least -4% and fall to the lower line of the ascending channel .
First Target: $6,233
Second Target: $6,033
Note: Stop Loss(SL) $6,513
Do you think S&P500 Index can create a new ATH above $6,500 !?
Please respect each other's ideas and express them politely if you agree or disagree.
S&P 500 Index Analyze (SPX500USD), Daily time frame.
Be sure to follow the updated ideas.
Do not forget to put a Stop loss for your positions (For every position you want to open).
Please follow your strategy and updates; this is just my Idea, and I will gladly see your ideas in this post.
Please do not forget the ✅' like '✅ button 🙏😊 & Share it with your friends; thanks, and Trade safe.

SPX500 Swing Short!
HI,Traders !
#SPX500 keeps growing
And is locally overbought
So after the price hit a very
Strong resistance level
Around 6422.93 we will be
Expecting a pullback and
A local bearish correction !
Comment and subscribe to help us grow !

SPY - Final InningTo understand where you're headed you must understand where you came from
Marketwide history in the making
SPX500 - what's next?Further to my previous idea on SPX.
SPX respected the Resistance at FR 161.8 at 6400.
Price went down and reverted form SMA200 (4H)
Now price has completed the Perfect Gartley Pattern and reached point D.
If (against fundamentals) price reverts down from there and breaks down through SMA50 (4h), I will consider it as Bearish Validation and I will expect correction movement, which cen go down to ca 6000.
Just my humble opinion


US500: Rebound Setup After Sharp Pullback – Key Support HoldingUS500 has experienced a strong corrective move after an extended bullish run but is now showing signs of stabilizing near a key support area. This zone aligns with both technical retracement levels and the market's reaction to fundamental shifts—particularly the dovish repricing of the Fed following weak US jobs data.
Technical Analysis (4H Chart)
Pattern: After a strong uptrend, price faced a steep correction, forming a potential short-term reversal setup.
Current Level: 6,235, holding above the 6,217 support zone.
Key Support Levels:
6,217 (immediate support; key defense zone for bulls).
6,171 (38.2% retracement, secondary support if deeper pullback occurs).
Resistance Levels:
6,272 (23.6% retracement and initial resistance).
6,360 (upper resistance zone and retest of recent breakdown).
6,429/6,436 (recent high and target if bullish momentum resumes).
Projection: A rebound from current levels could push US500 back toward 6,360–6,430 if support holds.
Fundamental Analysis
Bias: Neutral-to-bullish as macro drivers favor a recovery from pullback.
Key Fundamentals:
Fed Policy: Weak US jobs (+73K) and downward revisions have solidified rate cut expectations (~75% probability in September), boosting equity sentiment.
Inflation: Market awaits US CPI; softer data would further support equities.
Tariffs: While Trump’s tariffs create a medium-term risk for earnings, immediate Fed easing bets outweigh these concerns.
Risk Sentiment: Global risk remains supported by lower yields and optimism about Fed easing.
Risks:
Hot US CPI could reverse cut expectations, pressuring equities.
Geopolitical risks or tariff escalation could trigger renewed selling.
Key Events:
US CPI and PPI.
Fed speeches and rate expectations.
Earnings reports from key US companies.
Leader/Lagger Dynamics
US500 is a leader, driving global risk sentiment and influencing risk-sensitive assets like AUD/USD, NZD/USD, and JPY crosses.
Summary: Bias and Watchpoints
US500 is neutral-to-bullish, stabilizing at key support (6,217) after a sharp correction. Fed cut expectations and risk-on sentiment support the upside scenario, targeting 6,360–6,430 if US CPI aligns with softer inflation. However, a hot CPI print could invalidate this rebound and trigger another leg lower.

JP Morgan warns the S&P is due a retracement!🚨 Alert 🚨
JP Morgan and Deutsche Bank are the latest to warn that the S&P is due for a correction.
I'm short with a small position size, as the price could move higher yet... Judging by experience, it's near impossible to predict tops. It's best to close long positions or enter smaller-sized short positions with large stops.
VANTAGE:SP500 PEPPERSTONE:US500 ICMARKETS:US500 OANDA:SPX500USD

SP500 reinforcing a bearish short-term trendThe S&P 500 retreated in the final session of July, weighed down by renewed tariff concerns and ongoing uncertainty surrounding the Fed’s next policy move. Despite the late pullback, the index remains positive for the month overall.
From a technical perspective, the index has declined approximately 2.5% since yesterday, reinforcing a bearish short-term trend. The bearish outlook remains valid as long as the price stays below 6220.
Immediate Support: 6220 – A break below this level could lead to further downside. Next Downside Target: 6150 – If the bearish momentum continues past 6220. if price closes above this, 6250 short-term bullish momentum may build. 6300 – A major resistance; a close above this would invalidate the current bearish outlook.
we have Some Tips about SO500 But Trading range is small Traders.
Ps; Support with like and comments for more analysis.

US 500 road mapus 500 could be ready for a major c leg down. looking for a significant entry signal down

SPX range bound unit September expirationExpect sideways wave 4 to last 4 weeks, volatility, (small positions: sell up, buy dips or do NPOTHING and hold. Basically these types of Wave-4 are where traders loose money from Wave-3.
Warning: SPX500 May Have Peaked—Here’s What the Charts SayThe S&P 500 (SPX500) may have reached its peak. In this video, I reveal the technical evidence pointing to a potential reversal—including monthly bearish divergence, daily and weekly reversal candles, and confirmation from key indicators.
This isn’t just noise—these signals align across timeframes, suggesting a shift in momentum that could lead to significant downside. I’ll walk you through the charts, explain the implications for traders and investors, and highlight critical support levels to watch.
Thank you for watching and have a great trading week. Cheers!!

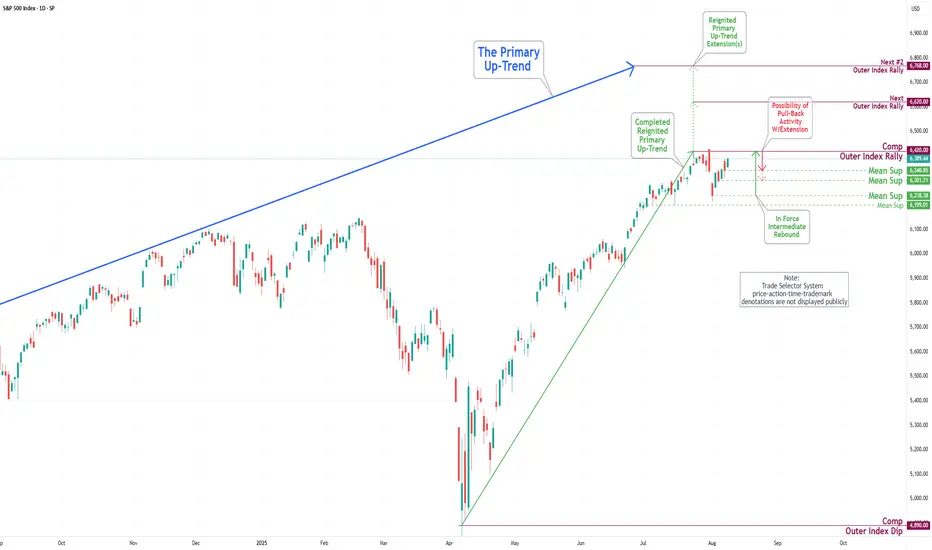
S&P 500 Daily Chart Analysis For Week of August 8, 2025Technical Analysis and Outlook:
During the trading activity of the previous week, the S&P 500 Index exhibited a predominantly bullish trend and is poised to retest the completed Outer Index Rally target of 6420, as outlined in last week’s Daily Chart Analysis. The primary objective now is to target subsequent levels, specifically the next Outer Index Rally target of 6620 and beyond.
It is crucial to recognize that the current price movement may initiate a substantial pullback from the present price action, either before or following the attainment of the Outer Index Rally peak at 6420.
SHORT ON SPX/USDSpy has created a Double top followed by a CHOC and retest to the downside.
Their is plenty sell side liquidity to be collected as I expect a major drop on spy.
Looking to catch 300-400 points on SPY.

Trend weakness or consolidation?This index is in an uptrend both in the larger cycle and in the smaller cycle, but in the lower cycle, a trend weakness is observed. If the price can confirm above 6.405, it can continue its upward trend.

Quants vs Humans: Wall Street’s Cold War
By Ion Jauregui – Analyst at ActivTrades
A silent battle is being fought on Wall Street between humans and machines. Quants — algorithmic traders who operate by following trends — are showing a level of optimism not seen since January 2020, according to Deutsche Bank AG (Ticker AT:DBK.GE). In contrast, “flesh and blood” managers have reduced their equity exposure to modestly underweight levels, pressured by the risk of new Trump tariffs, weaker-than-expected economic growth, and corporate earnings that remain unconvincing.
The S&P 500 has risen nearly 30% since April, bringing systematic long positions to their highest level in four years. Goldman Sachs (Ticker AT:GS.US) reports that Commodity Trading Advisors (CTAs) now control about $50 billion in U.S. equities, placing them in the 92nd percentile of historical exposure. Such an extreme positioning has not been seen since periods preceding major market moves.
Deutsche Bank was among the first to warn about this divergence between quantitative and discretionary trading: while trend-following models keep adding positions, manually managed portfolios are prioritizing capital protection. Goldman Sachs, for its part, offers the clearest risk assessment: aggressive accumulation by CTAs leaves the market highly exposed to feedback-driven moves. And UBS Group AG (Ticker AT:UBSG.CH) warns that if the S&P 500 falls just 4.5% to 6,100 points, these systems could trigger massive selling, creating a domino effect that would accelerate the correction.
The backdrop adds more tension: the VIX volatility index remains around 15 points, its lowest level since February. This apparent calm acts like a stretched rubber band ready to snap. In the event of a sharp pullback, discretionary managers might step in to “buy the dip” and prevent a deeper sell-off, yet the sense that the market is approaching a top is becoming increasingly tangible.
Technical Analysis – S&P 500
The index maintains an underlying bullish structure, but with overbought signals on daily and weekly charts. Currently, the RSI shows mild overbought conditions at 58.7%, while the MACD indicates a bearish divergence and a red histogram with low volume — a sign of possible price consolidation.
• Key resistance: 6,442.76 points, the recent all-time high and a psychological ceiling that could halt further gains if quantitative momentum fades.
• Intermediate support: 6,204 points, where short-term moving averages converge with previous consolidation areas.
• Critical support: 6,060 points, identified by the Point of Control (POC) as the threshold for triggering massive algorithmic selling; a break below this level could open the door to declines toward 5,950 or 5,908 points.
As long as 6,060 holds, the primary trend still favors the bulls. However, the high concentration of systematic long positions suggests that any correction could be swift and violent, forcing traders to react quickly.
*******************************************************************************************
The information provided does not constitute investment research. The material has not been prepared in accordance with the legal requirements designed to promote the independence of investment research and such should be considered a marketing communication.
All information has been prepared by ActivTrades ("AT"). The information does not contain a record of AT's prices, or an offer of or solicitation for a transaction in any financial instrument. No representation or warranty is given as to the accuracy or completeness of this information.
Any material provided does not have regard to the specific investment objective and financial situation of any person who may receive it. Past performance and forecasting are not a synonym of a reliable indicator of future performance. AT provides an execution-only service. Consequently, any person acting on the information provided does so at their own risk. Political risk is unpredictable. Central bank actions can vary. Platform tools do not guarantee success.

S&P 500: Bearish For The Short Term! Sell It!Welcome back to the Weekly Forex Forecast for the week of July 28 - Aug 1st.
In this video, we will analyze the following FX market for the week of Aug 4-8th:
S&P 500 (ES1!)
The S&P 500 rose Friday to fresh highs, following a busy week of tariff updates and earnings. The S&P ended the week with its fifth straight record close, its longest such streak in over a year.
No reason to consider selling. Wait for pullbacks to FVGs for high probability buys.
FOMC and NFP loom. Be careful to avoid new entries during news times.
Enjoy!
May profits be upon you.
Leave any questions or comments in the comment section.
I appreciate any feedback from my viewers!
Like and/or subscribe if you want more accurate analysis.
Thank you so much!
Disclaimer:
I do not provide personal investment advice and I am not a qualified licensed investment advisor.
All information found here, including any ideas, opinions, views, predictions, forecasts, commentaries, suggestions, expressed or implied herein, are for informational, entertainment or educational purposes only and should not be construed as personal investment advice. While the information provided is believed to be accurate, it may include errors or inaccuracies.
I will not and cannot be held liable for any actions you take as a result of anything you read here.
Conduct your own due diligence, or consult a licensed financial advisor or broker before making any and all investment decisions. Any investments, trades, speculations, or decisions made on the basis of any information found on this channel, expressed or implied herein, are committed at your own risk, financial or otherwise.

Potential bearish drop?S&P500 is rising towards the pivot, which is a pullback resistance that aligns with the 61.8% Fibonacci retracement and could drop to the 1st support.
Pivot: 6,362.20
1st Support: 6,214.78
1st Resistance: 6,436.72
Risk Warning:
Trading Forex and CFDs carries a high level of risk to your capital and you should only trade with money you can afford to lose. Trading Forex and CFDs may not be suitable for all investors, so please ensure that you fully understand the risks involved and seek independent advice if necessary.
Disclaimer:
The above opinions given constitute general market commentary, and do not constitute the opinion or advice of IC Markets or any form of personal or investment advice.
Any opinions, news, research, analyses, prices, other information, or links to third-party sites contained on this website are provided on an "as-is" basis, are intended only to be informative, is not an advice nor a recommendation, nor research, or a record of our trading prices, or an offer of, or solicitation for a transaction in any financial instrument and thus should not be treated as such. The information provided does not involve any specific investment objectives, financial situation and needs of any specific person who may receive it. Please be aware, that past performance is not a reliable indicator of future performance and/or results. Past Performance or Forward-looking scenarios based upon the reasonable beliefs of the third-party provider are not a guarantee of future performance. Actual results may differ materially from those anticipated in forward-looking or past performance statements. IC Markets makes no representation or warranty and assumes no liability as to the accuracy or completeness of the information provided, nor any loss arising from any investment based on a recommendation, forecast or any information supplied by any third-party.

SPX500
Based on the provided 4-hour chart of the S&P 500 Index (SPX500), here is a brief summary and outlook.
The SPX500 has been in a clear uptrend, as indicated by the trend channel and a series of higher highs and higher lows. The price is currently facing resistance near the 6,450 level, where a recent high was made before a pullback. The chart also highlights several key support zones, with the most immediate one being around the 6,290 level.
The chart illustrates a potential scenario where the price consolidates or pulls back from the current resistance. The orange arrow depicts a possible movement where the price could retrace towards the immediate support level around 6,290 before finding buyers. From this support, the expectation is for the uptrend to resume, with the price aiming to break through the resistance at 6,450. A successful breakout would open the path towards the upper boundary of the trend channel, with a target set around 6,600.
The key expectation is a continuation of the overall bullish trend after a potential short-term dip. Traders should look for the price to hold above the support at 6,290 for a long entry opportunity. A break below this support would be a bearish signal, but as long as the price stays within the trend channel, the overall bias remains bullish. The final target for this move is projected to be around the 6,600 level, which aligns with the trend channel's upper boundary.
