RKLB Weekly Options Trade Plan – 2025-06-07🚀 RKLB Weekly Options Trade Plan – 2025-06-07
Bias: Moderately Bullish
Holding Period: 3–5 trading days
Catalyst: Trump–Musk headline cycle + strong short-term momentum
Timeframe: Expiry June 13, 2025
🔍 Multi-Model Consensus Summary
Model Direction Strike Entry Stop Target(s) Confidence
Grok No Trade – – – – 0%
Claude Long Call $30 $0.76 $0.38 $1.50 75%
Llama Long Call $30 $0.76 $0.57 $1.14 70%
Gemini Long Call $31 $0.49 $0.24 $0.74–$0.98 65%
DeepSeek Long Call $30 $0.76 $0.38 $1.52 70%
✅ Consensus: Buy $30 call expiring 2025-06-13
💬 4 of 5 models bullish; 3 aligned on same strike and premium
⚠️ Max pain at $26 and overbought daily RSI are top risks
📈 Technical Snapshot
Price Trend: Bullish short-term (price > EMAs on 5-min & daily)
RSI: Nearing overbought (RSI ~69)
MACD: Bullish short-term, weakening daily
Resistance: $29.00–$29.50
Support: $28.70–$28.75
✅ Trade Setup
Parameter Value
Instrument RKLB
Direction CALL (LONG)
Strike $30
Entry Price $0.76
Profit Target $1.14 (≈50% gain)
Stop Loss $0.38 (≈50% loss)
Size 1 contract
Expiry 2025-06-13 (Weekly)
Confidence 70%
Entry Timing At market open
⚠️ Key Risks
Max Pain Gravity: $26 could act as price magnet by end of week
Overbought Setup: Daily RSI + Bollinger breach may cap further upside
Exhaustion Signs: Bearish MACD divergence could lead to snap pullback
Momentum Trade: Must act quickly; trail stops if resistance nears
US500 trade ideas
A little more upside for SPX500USDHi traders,
And again my previous outlook of SPX500USD played out as I've said. After a small correction we saw the continuation of the upmove to the Daily FVG.
Next week we could see price come into the Daily FVG and reject from there for a correction down.
Let's see what the market does and react.
Trade idea: Wait for a small correction down on a lower timeframe to trade short term longs into the Daily FVG.
If you want to learn more about trading FVG's & liquidity sweeps with Wave analysis, then please make sure to follow me.
This shared post is only my point of view on what could be the next move in this pair based on my technical analysis.
Don't be emotional, just trade your plan!
Eduwave

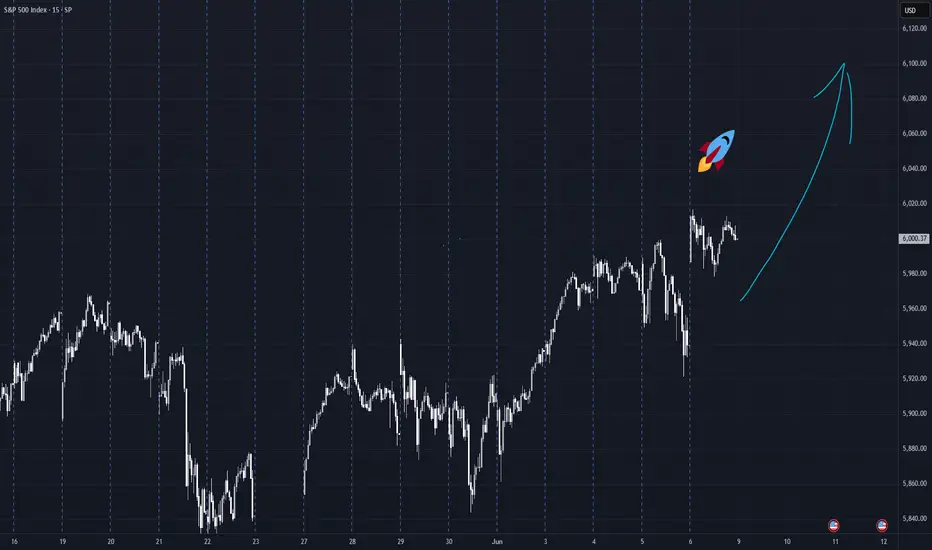
**** Market Trading Strategy Idea SP500 ***Key Chart & Economic Insights:
- Current Market Position
- The S&P 500 is around $6000, showing positive momentum (+1.03%).
- Upward trend visible, indicating strong buying interest.
- Economic tailwinds support continued growth.
- Projected Price Movements
- 6800 USD: Key resistance level where selling pressure could emerge.
- Market pullback: A correction after 6800 may create a buyback opportunity.
- Recovery phase: Expected rebound toward 7000-7500 USD, another selling position.
- Economic Context: U.S. Manufacturing Boom & GDP Growth
- The United States is ramping up domestic production, boosting industrial output and reshoring manufacturing.
- This shift is fueling GDP growth, strengthening economic fundamentals and potentially sustaining bullish market momentum.
- Strong consumer spending & investment could drive stocks higher, aligning with the planned trade strategy.
Risk Management & Optimization:
- Entry & Exit Precision: Define stop-loss and take-profit levels.
- Momentum Confirmation: Ensure price action validates expected moves.
- Economic Indicators: Watch manufacturing & GDP data for trend validation.
If you want to refine this analysis or explore other scenarios, I'm here to dive deeper into key points! 🚀 Subscribe! TSXGanG
I hold a CCVM and MNC (Certificate of Competence to become a securities broker anywhere in Canada) and have been working as a trader for five years.
It’s a pleasure for me to help people optimize their trading strategies and make informed financial market decisions.

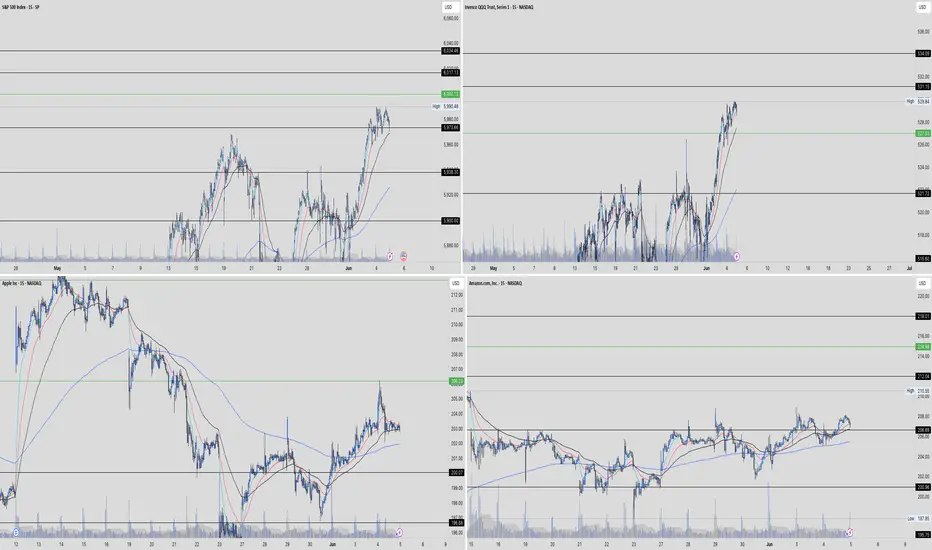
SPX: chasing the 6KThe jobs data were in the spotlight of markets during the previous week. The Non-farm payrolls in May with 139K new jobs came as better than market anticipated, which supported the optimistic mood of investors. The S&P 500 managed to return to the levels modestly above the 6K level. Tech companies were again in the spotlight of investors. In this sense, the magnificent 7 drove the market to the higher grounds. In the Friday trading session, NVDA gained 1,2%, AMZN was up by 2,7%, while Tesla gained 3,7%. It should be noted that Tesla had quite a turbulent week. Its shares first dropped by 14% at the beginning of the week, after its CEO commented negatively on a current policy of the US President Trump. Certainly, this came as a surprise for markets, considering Musk's strong support for President Trump, both during the electoral campaign and his presidency.
Current optimism might be slowed down with forthcoming inflation data. Namely, a large number of economists are pointing to potential for the economic slowdown and higher inflation induced by implemented trade tariffs by the US Administration. In this sense, there is a probability that higher volatility of the index might continue in the coming period, as markets will try to understand what impact future growth and earnings will have on any new news on trade tariffs. It has been announced that further talks between China and US officials on trade tariffs will be held next week in London. This event will be closely monitored by investors.

S&P 500 Daily Chart Analysis For Week of June 6, 2025Technical Analysis and Outlook:
The S&P 500 Index has demonstrated an upward trajectory during this week's trading session, surpassing the established Outer Index Rally level of 5955 and the Key Resistance level of 5965. Currently, the index is exhibiting a bullish trend, with a focus on the Outer Index Dip target, set at 6073. Furthermore, additional critical levels have been identified, including Key Resistance at 6150 and the Next Outer Index Rally at 6235. Conversely, there is a potential decline in index prices from the current level or upon completion of the Outer Index Dip 6073, which may lead to a retest of the Mean Support at 5940, with the possibility of extending the pullback to the Mean Support at 5888.

Possible bearish outlook After algorithm took out the previous liquidities, I would be expecting a downward move to see price taking out the bullish liquidity below, into the bullish gap, possibly filling it up

Another leg of bull market comingBeing bearish in the stock market—especially after such a big correction and a V-shaped recovery—is definitely not a good idea. Probability and past history are against you. If Trump succeeds in bringing more jobs by tarrifs and reduce government expending as he promises, it could easily keep the uptrend going for the next two years and push past the 10,000 level, just like 2018 and 2020

S&P500 tests the upper border of the rangeThe S&P 500 index is concentrating in the massive triangle below the psychological level of $6000, and given the overall neutral to good market sentiment, it’s not expected to plummet from this area before testing the area of $6000-6200. Should the breakout of this zone happen, it’s not expected to be sustainable and may quickly revert back to the range, as traders are quite cautious right now and the market is prone to liquidations and quick profit taking.
Don't forget - this is just the idea, always do your own research and never forget to manage your risk!

Hellena | SPX500 (4H): LONG resistance area of 6176.6.Colleagues, it appears that price has not yet completed the upward movement in a five-wave move.
At the moment I expect the continuation of wave “3” and reaching the target in the resistance area of 6176.6.
Manage your capital correctly and competently! Only enter trades based on reliable patterns!

SPX500 H1 | Heading into an overlap resistanceSPX500 is rising towards an overlap resistance and could potentially reverse off this level to drop lower.
Sell entry is at 5,967.36 which is an overlap resistance that aligns close to the 61.8% Fibonacci retracement.
Stop loss is at 6,012.00 which is a level that sits above a multi-swing-high resistance.
Take profit is at 5,909.96 which is a swing-low support that aligns close to the 61.8% Fibonacci retracement.
High Risk Investment Warning
Trading Forex/CFDs on margin carries a high level of risk and may not be suitable for all investors. Leverage can work against you.
Stratos Markets Limited (tradu.com ):
CFDs are complex instruments and come with a high risk of losing money rapidly due to leverage. 63% of retail investor accounts lose money when trading CFDs with this provider. You should consider whether you understand how CFDs work and whether you can afford to take the high risk of losing your money.
Stratos Europe Ltd (tradu.com ):
CFDs are complex instruments and come with a high risk of losing money rapidly due to leverage. 63% of retail investor accounts lose money when trading CFDs with this provider. You should consider whether you understand how CFDs work and whether you can afford to take the high risk of losing your money.
Stratos Global LLC (tradu.com ):
Losses can exceed deposits.
Please be advised that the information presented on TradingView is provided to Tradu (‘Company’, ‘we’) by a third-party provider (‘TFA Global Pte Ltd’). Please be reminded that you are solely responsible for the trading decisions on your account. There is a very high degree of risk involved in trading. Any information and/or content is intended entirely for research, educational and informational purposes only and does not constitute investment or consultation advice or investment strategy. The information is not tailored to the investment needs of any specific person and therefore does not involve a consideration of any of the investment objectives, financial situation or needs of any viewer that may receive it. Kindly also note that past performance is not a reliable indicator of future results. Actual results may differ materially from those anticipated in forward-looking or past performance statements. We assume no liability as to the accuracy or completeness of any of the information and/or content provided herein and the Company cannot be held responsible for any omission, mistake nor for any loss or damage including without limitation to any loss of profit which may arise from reliance on any information supplied by TFA Global Pte Ltd.
The speaker(s) is neither an employee, agent nor representative of Tradu and is therefore acting independently. The opinions given are their own, constitute general market commentary, and do not constitute the opinion or advice of Tradu or any form of personal or investment advice. Tradu neither endorses nor guarantees offerings of third-party speakers, nor is Tradu responsible for the content, veracity or opinions of third-party speakers, presenters or participants.

Market wrap - SPX USOIL BTC GoldThe market was very tricky but ultimately it did sell off. The question is - will we make one more high? That's hard to tell and there are mixed signals. Gold is at support. BTC is at it's Bollinger Band target, USOIL still has not broken up or down as of now.

06/02 Weekly GEX Analysis - 6000 Looks EasyThe biggest event last week was undoubtedly the court ruling involving Trump. The market responded with optimism, and on Thursday premarket, SPX surged toward the 6000 level — only to get instantly rejected. That strong rejection suggests this is a firm resistance zone.
From the GEX expiry matrix, it's clear that the market is hedging upward for this week, but downward for next week. To me, this indicates that while the near-term GEX sentiment remains slightly bullish, the market may be preparing for a pullback or retest in the medium term.
This week, SPX has already entered a GEX zone surrounded by positive strikes — up to around the 6000 level. That makes 6000 an “easy target” for bulls, and we’ll likely see profit-taking here, just like we did last Thursday premarket.
⚠️ However, if we look more closely at the weekly net open interest:
...we can see a strong bullish net OI build-up starting to emerge around the 6100 level — a price zone that currently feels distant and even unreachable. But if the 6000 resistance breaks, we could see a fast gamma-driven squeeze up to 6050 and possibly 6100 before the next wave of profit-taking kicks in.
As is often the case during bullish moves, the market seems blind to the bigger picture — no one’s looking down, only up. The mood is greedy, and momentum favors the bulls... for now.
Never underestimate FOMO — but also never underestimate Trump. He’s unlikely to accept the court’s decision on tariffs quietly. Any new negative headline could shake the market, no matter where price is sitting…

US & Global Market Breakdown | Profits, Losses & Bearish TradesIn this video, I break down the current state of the US and global economy, and why I believe we’re heading into a bearish phase.
📉 Fundamentals:
I cover the key macroeconomic factors influencing the markets — including Trump’s proposed new tariffs, slowing GDP growth, and ongoing supply chain constraints. These all point toward increasing pressure on the global economy.
📊 Technical Analysis:
I go over the major indexes and highlight their recent behavior. We’ve seen reactions from resistance levels, contraction patterns forming, and a significant volume dry-up — followed by today’s spike in volume, which occurred right at resistance. These are potential signs that the market may be shifting toward a bearish trend.
That said, we could still just be witnessing a deeper pullback within a longer-term uptrend. Markets are unpredictable, and no one knows for sure — which is why it’s important to always do your due diligence.
💰 I also review the profits and losses I’ve taken on recent bullish trades, and why I’ve now positioned myself in select short opportunities based on what I’m seeing.
If I’m sharing this, it’s because I’m personally investing my capital based on my conviction — so always use your own judgment and risk management when making decisions.
If you found value in the breakdown, leave a like, comment, and subscribe for more timely updates.

$SPX $SPY /ES! Bearish divergence at 6000SP:SPX AMEX:SPY Bearish divergence at 6000
When we dropped to the 35EMA, which happens when we see a red signal line, then we bounced but with a bearish divergence.

Come on SPX! Let's cross back over 6,000Stop playing with me SPX. So far this week, we've seen a slowwww drift up. Ok, Monday and Tuesday did put in some solid bars, but now here we are, babying this 6,000 psychological area.
Below is my write up from Sunday. While I always state different scenarios, I've been leaning bullish...though some of my individual stock plays have retested my stop levels this week. (They have been a bit more sideways)
SPX (written Sunday 06/01/25)
Still above key weekly MAs, trend remains intact
The weekly chart still shows an uptrend. We're above the 10EMA, 20EMA, and 50SMA, and those moving averages are turning up. So while the pace of the uptrend has slowed, the broader structure hasn't broken down. This past week was a digestion of the recent April and early May run, and so far, not an unraveling of it.
Friday's dip was likely just a shakeout.
Friday gave us a candle that flushed below the daily 20EMA then quickly reversed. That kind of action often traps early shorts and clears out weaker long hands…a classic shakeout. If this theory holds, we should see strength early next week. But if we break below the 5750-5725 area, that thesis gets invalidated. At that point, I'd treat the move as something more structurally weak, not just a pullback.
Confluence zone still holding for now
We're sitting right on a layered area of support above all moving averages, and a horizontal support and resistance level from earlier this year. So far, it has held. If it continues to hold, it gives the index a platform to try the upside again.
Trendlines matter, but not more than the overall structure
I was asked about trendlines this week, and it was a good reminder to step back and recognize how I was sharing my use of them. Trendlines are helpful, but they’re just one part of the picture. Same goes for moving averages, volume, and other tools. They only hold weight relative to the context. In a choppy, indecisive market, over-focusing on any single signal can do more harm than good. I'm aiming to keep my analysis well-rounded, zoomed out, and centered on structure.
What would confirm the upside?
A clean move back above 6,000 and a push through the February all-time high would help strengthen the case for continued upside. Not just because it’s a technical level, but because it’s psychological too. If we’re breaking out into new highs, especially after the chop and hesitation of the last few weeks, that’s when retail traders tend to feel like we’re “in the clear.” That can bring in more participation, more confidence, and more momentum. Ideally, we’d see a higher low hold on any dips, and then a strong push through 6,000 with follow-through, not just a quick tag and pullback. That kind of behavior would tell me buyers are stepping in with conviction again.
What would shift the bias more bearish?
A breakdown and hold below 5725 (not just a quick flush) would suggest deeper downside potential. From there, 5600 (around the daily 50SMA) becomes the next level I’d watch for support. But so far, I’m not leaning toward this as the main scenario.
What do you all see? Will we break 6,000 and get an increase in momentum?

Balance lost, 5850 is the likely next targetUnless they save the market within the next fw hours, balance has been lost on the small time frmes and 5850 is the bottom of the larger balance area. Gold could go either way from here. Oil is also at the top of balance. BTC still looks bearish

Volume Droughts and False Breakouts: Your Summer Trading TrapsThe market’s heating up — but is your breakout about to dry up? Here’s a word about the importance of summer trading success (helped by volume — the main character).
☀️ Welcome to the Liquidity Desert
Summer’s getting ready to slap the market with a whole flurry of different setups. Picture this — the beaches are full, your trading desk is half-abandoned, and the only thing more elusive than a decent breakout is your intention to actually read that big fat technical analysis book you bought last year.
And yet, here you are — eyes glued to the chart — watching a clean breakout above resistance that’s just begging for you to hit “buy.” Everything looks perfect. Price rips through the level like it’s made of butter. But there’s just one tiny problem: no volume. None. Nada. Niente.
Congratulations. You’ve just bought the world’s most attractive false breakout.
🏝️ Summer Markets: Where Good Setups Go to Die
Let’s set the scene.
It’s June. The big dogs on Wall Street are golfing in the Hamptons and sipping mezcal espresso martinis, interns are running the order flow, and every chart you love is doing just enough to get your hopes up before crushing them like a half-melted snow cone.
This isn’t your usual high-volatility playground. Summer markets — especially between June and August — are notorious for thin liquidity . That means fewer participants, smaller volume, and a much higher likelihood of being tricked by price action that looks strong… until it’s not.
And it’s not just stocks. Forex, crypto, commodities — even the bond boys — all face the same issue: when fewer people are trading, price becomes more fragile. And fragile price = bad decisions.
🚨 Why False Breakouts Love Quiet Markets
False breakouts happen when price appears to break above resistance (or below support), only to reverse sharply — often trapping late traders and triggering stop hunts.
But in summer? It’s a whole different beast. Here’s why:
No liquidity cushion : In normal markets, you need strong volume to fuel a breakout. Without that, the breakout doesn’t necessarily have the gas to keep going.
Market makers get bored : Thin markets mean it’s easier for a few big orders to push prices where they want. Welcome to manipulation season (there, we said what we said!).
Algos go wild : With fewer humans around, algorithms dominate. And they love playing games around key levels.
🧊 The Mirage Setup: A Cautionary Tale
Let’s say you’re watching GameStop NYSE:GME stock. Resistance at $30. Price hovers there for days, teasing a breakout. Then — boom — a sudden 6% pop above.
You buy. Everyone buys. The trading community goes nuts. “This is it bois!”
But there’s a problem. Look at the volume: a trickle. Not even half the average daily volume. Ten minutes later, NYSE:GME is back below $30, your stop loss is hit, and you’re left explaining to your cat why you’re emotionally invested in a ticker.
Moral of the story? Don’t trust breakouts when no one’s trading.
📉 Volume: Your Summer Lie Detector
Volume is more than just a histogram under your chart. It’s your truth serum. Your smoke alarm. Your buddy who tells you to think twice before jumping in that trade.
Here’s how to read it right when everyone else is checking out:
Confirm the move : If price breaks out, but volume doesn’t spike at least 20–30% above the average — be suspicious.
Look for acceleration : Healthy moves gather steam. You want to see volume growing into the breakout, not fizzling.
Watch for volume cliffs : A sudden volume drop right after a breakout often signals that the move is running on fumes.
Add Volume Profile Indicators : Just to be safe, you can always add Volume Profile Indicators to your chart — they analyze both price and volume and can highlight what your keen eye might miss.
Remember what happened last summer? And how we all learned the downside of something called "carry trade"? Those who were short the Japanese yen remember .
🧠 Context Over Candles: Be a Liquidity Detective
Let’s say you see a double top pattern — your favorite. Clean lines. Tight price action. Perfect setup.
But now zoom out.
It’s July 3. Pre-holiday half-day. No volume. And the S&P 500 SP:SPX has moved 0.04% all day. Still want in?
Technical analysis doesn’t work in a vacuum. Chart patterns lose their predictive power when the environment they live in is compromised. And thin liquidity is a compromised environment.
🐍 Snakes in the Sand: How Market Makers Bait Traps
Market makers (and large players) are like desert snakes — quiet, patient, and very good at making you move when you shouldn’t.
Here’s how they bait traders in illiquid markets:
Run stops above resistance to trigger breakout buyers.
Dump shares immediately after breakout to trap retail.
Ride the reversal as trapped longs scramble to exit.
They’re so powerful some say they run the game — and can stop it anytime it’s not going their way (remember the GameStop freeze? ) It’s a psychological game — and in the summer, it’s easier to do shenanigans because most players aren’t watching.
Don’t be the one jumping at shadows. Be the trader who expects the trap.
🛠️ How to Survive (and Thrive) in the Summer Slump
Not all is lost. You can still trade — smartly.
Here’s your Summer Survival Toolkit :
Wait for volume confirmation on every breakout.
Lower your position size . Less liquidity = more slippage risk.
Set wider stops , or better yet, sit out the chop.
Focus on trending names with relative strength and solid weight (think: tech titans, oil plays, or financials).
Use alerts instead of staring at charts . Don’t mistake boredom for opportunity.
And most importantly: Know when not to trade . Discipline is a position too.
🔚 Final Word: This Isn’t the Off-Season. It’s the Setup Season.
Summer might feel slow, but it’s not dead.
Smart traders know that the best trades of Q3 and Q4 often begin in July — as early trendlines form, consolidation patterns develop, and institutional footprints quietly appear in the tape.
So use this time wisely. Don’t force trades. Watch volume like a hawk. And never forget: the best breakouts don’t need hype — they bring their own thunder.
Stay cool, stay patient, and trade smart. The mirage may be tempting, but the oasis always belongs to the ones who go far enough and don’t give up.
Off to you : How are you navigating trading during the summer months? Staying poolside with one eye on the charts or actively seeking out opportunities while folks catch a break? Share your insights in the comments!

US500 potential buyUS500 is setting up for a classic Wyckoff spring. This is a high probability set up with high risk to reward (5R+)
Here is what needs to happen
For situations 1 and 2,
a. price should break blue support (traps sellers and shakes out weak hands)
b. price should then close above any of the 2 blue supports with high volume
c. enter at the close of that bar or retest of the blue line
d. T.P @ recent high.
What do you think? how would you approach this better?

SPX500 – Consolidation Between 5966–5990, Breakout to Set DirectSPX500 | Technical View
The price is currently consolidating between 5966 and 5990.
A 1H or 4H candle close below 5966 would confirm bearish momentum, with downside targets at 5938 and 5905.
However, as long as price trades above 5966, the outlook remains bullish, targeting 5990.
A 1H close above 5990 may extend the move toward 6010 and 6030.
Resistance: 5990, 6010, 6030
Support: 5938, 5905, 5858

S&P500 awaits Trade Balance and Jobless Claims figuresTrump Tightens Immigration: Bans people from 12 countries, limits entry from 7 more, and blocks foreign students from attending Harvard.
Russia-Ukraine Tensions: Putin plans to strike back after a Ukrainian drone attack. Trump says Russia’s allies won’t profit from rebuilding Ukraine.
UK Housing Boom: Home sales rose 6% in May, the strongest in 3+ years, despite the end of a buyer tax break.
Germany & U.S.: German politician Friedrich Merz meets Trump today. At home, Germany faces rising public concern about tough economic times.
ECB Rate Cut Likely: The European Central Bank is expected to cut rates by 0.25% to 2%, but may slow further cuts soon.
Key Support and Resistance Levels
Key trading leel is at: 6000
Resistance Level 1: 6090
Resistance Level 2: 6140
Resistance Level 3: 6200
Support Level 1: 5900
Support Level 2: 5845
Support Level 3: 5800
This communication is for informational purposes only and should not be viewed as any form of recommendation as to a particular course of action or as investment advice. It is not intended as an offer or solicitation for the purchase or sale of any financial instrument or as an official confirmation of any transaction. Opinions, estimates and assumptions expressed herein are made as of the date of this communication and are subject to change without notice. This communication has been prepared based upon information, including market prices, data and other information, believed to be reliable; however, Trade Nation does not warrant its completeness or accuracy. All market prices and market data contained in or attached to this communication are indicative and subject to change without notice.

S&P500 Index (US500): Bullish Accumulation Pattern
I spotted a nice example of an ascending triangle pattern on a daily time frame.
To confirm a bullish continuation, we will need a bullish breakout
of its neckline.
A daily candle close above 5996 will provide a reliable confirmation.
A rise will be anticipated at least to 6080 resistance then.
❤️Please, support my work with like, thank you!❤️
I am part of Trade Nation's Influencer program and receive a monthly fee for using their TradingView charts in my analysis.

Skeptic | SPX 500 Analysis: Long Triggers Ready to Rip!Hey, what’s good? It’s Skeptic! 😎 Last week, we scored a nice R/R on SPX 500, and now it’s looking ready for another big move, super close to our long trigger. Let’s check it out with a multi-timeframe breakdown to grab those long and short triggers!
Daily Timeframe: The Big View
The SPX was riding a strong bullish wave, then hit a deep correction. Here’s what’s up:
It’s bounced back most of that drop and is nearing its ceiling at 6128.55. 🏔️
A break and hold above 6128.55 could kick the bullish trend into high gear, per Dow Theory.
Watch the daily RSI—if it goes overbought, we might see a fast, big rally. 🚀
This is our long-term play, so let’s zoom in for the short-term action!
4-Hour Timeframe: Long & Short Triggers
On the 4-hour chart, here’s the plan for our trades:
Long Trigger: Break above 5990.67, with RSI above 66.57 to show the move’s got juice.
Stop Loss: Your choice—put it below 5955.77, or check 1H or 15-minute charts for a tighter stop under the last low. 🎯
Short Trigger: A drop below 5856.93 lets you short, but it’s against the trend, so keep it low-risk. Take profits quick, use a small stop loss, and close when you hit a good R/R. ⚠️
Shorts are tricky here, so play it safe and don’t go all-in!
RSI Trick & Your Input
Love RSI? I’ve been using it forever, and I think most guides get it wrong. They say overbought RSI means sell, but for me, it’s a go sign for longs! Want a full RSI tutorial? Tell me in the comments, and I’ll hook you up! 📢
💬 Let’s Talk!
If this got you hyped, hit that boost—it helps a ton! 😊 Got another pair or setup you want me to hit? Drop it in the comments. Thanks for chilling with me—keep trading smart! ✌️

Andycharts, publishing key levels. We have key levels across 15 different charts which I am looking at tomoorow for contination,