S&P bullish continuation supported at 6340Tariff Turmoil and Geopolitical Shifts – Implications for S&P 500 Trading
Donald Trump's sweeping new tariffs officially took effect, hitting nearly all U.S. trading partners. Switzerland, facing the steepest rates among developed nations, may retaliate by cancelling a major fighter jet purchase, signaling potential defense-sector implications.
Key developments:
Semiconductor imports to face 100% tariffs, unless production is moved onshore – a bullish signal for domestic chipmakers (e.g., Intel, GlobalFoundries) but negative for firms reliant on overseas fabs.
Additional tariffs floated on China over purchases of Russian oil, echoing similar penalties on India – suggesting growing fragmentation in global trade.
Market impact:
S&P 500 sectors likely affected:
Tech (Semis): Tariff pressure may weigh on multinationals like Nvidia or AMD short term, but benefit domestic fabs and U.S.-based supply chains.
Industrials/Defense: Swiss retaliation could ripple through defense contractors if deals are halted.
Energy/Commodities: Any China-Russia oil tensions could lead to energy volatility, affecting names like ExxonMobil or ConocoPhillips.
Meanwhile, China’s exports unexpectedly rose, softening the blow from the U.S. tariff crackdown. Chinese equity gains could calm broader EM sentiment, helping mitigate global risk-off contagion.
Finally, Trump signaled potential peace talks with Putin and Zelenskiy, with the Kremlin confirming a Putin meeting soon. A diplomatic breakthrough could ease geopolitical risk, supporting investor sentiment and equities globally.
Bottom Line for S&P 500:
Expect sector rotation as traders digest tariff fallout. Watch for:
Strength in domestically focused tech and defense stocks
Caution around globally exposed industrials and semis
Short-term volatility tied to trade rhetoric and geopolitical headlines
Key Support and Resistance Levels
Resistance Level 1: 6437
Resistance Level 2: 6480
Resistance Level 3: 6520
Support Level 1: 6340
Support Level 2: 6295
Support Level 3: 6256
This communication is for informational purposes only and should not be viewed as any form of recommendation as to a particular course of action or as investment advice. It is not intended as an offer or solicitation for the purchase or sale of any financial instrument or as an official confirmation of any transaction. Opinions, estimates and assumptions expressed herein are made as of the date of this communication and are subject to change without notice. This communication has been prepared based upon information, including market prices, data and other information, believed to be reliable; however, Trade Nation does not warrant its completeness or accuracy. All market prices and market data contained in or attached to this communication are indicative and subject to change without notice.
US500FU trade ideas

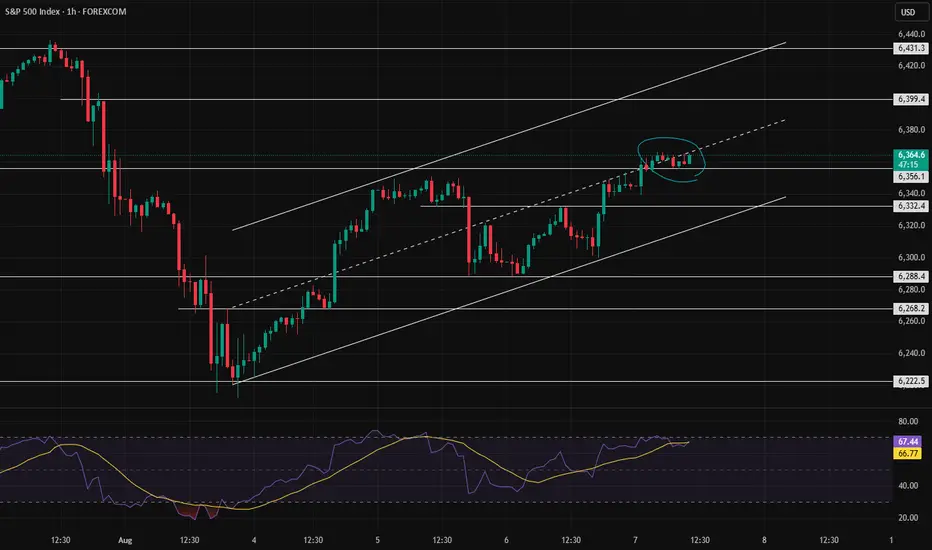
Decision pointThe weakness of the trend is clearly visible, but we need to see how it reacts to the channel’s midline. If buying pressure increases, the price could reach 6400. Otherwise, a correction down to around 6330 is likely.
US500 Market Insight US500 Market Insight
The US500 continues to demonstrate resilience amid a complex macroeconomic backdrop, trading around 6,388 at mid-session today. This represents a modest 0.40% recovery from the previous close of 6,299, signaling improving investor sentiment despite ongoing market headwinds.
Fundamental Outlook: Market Resilience Amid Volatility
After a stretch of choppy trading sessions driven by mixed U.S. economic data and escalating tariff concerns, the index has regained its footing above the psychologically important 6,300 support level. This bounce reflects investor confidence in the broader market’s fundamentals, particularly in the face of global policy uncertainties.
Strong Corporate Earnings as a Key Driver
Earnings season has delivered notable upside surprises, particularly in the technology, consumer discretionary, and financial sectors. Positive forward guidance and robust profit margins have underpinned the index’s strength, helping offset negative sentiment from trade related headlines and slowing global demand in select sectors.
Dovish Federal Reserve Expectations
Markets are increasingly pricing in a more accommodative stance from the Federal Reserve, even as policymakers continue to stress a data dependent approach. With inflation surprising on the upside and NFP data coming out softer, this is reinforcing expectations for possible rate cuts later in 2025. This has eased pressure on equities and boosted appetite for risk assets.
Technical Outlook: Bullish Continuation
From a technical perspective, the US500 remains in a well defined long-term uptrend. Maintaining price action above 6,300 strengthens the case for further gains, with 6,400–6,500 seen as the next potential resistance zone. Keep watching for consolidation above 6,300 to confirm breakout momentum.
Key Risks and Market Sensitivities
Despite the positive bias, risks remain. The index remains highly sensitive to global trade developments, particularly US-China and US-EU tariff disputes. In addition, any shift in Fed tone or unexpected inflation data could trigger renewed volatility.
Conclusion
The US500’s current recovery reflects a careful balance of strong earnings, improving rate outlook, and technical support. While bullish sentiment persists, the path forward will likely remain data driven and headline sensitive, requiring traders to remain nimble. A sustained break above 6,400 could open the door to new highs later this quarter, but near-term volatility should not be discounted.
Analysis by Terence Hove, Senior Financial Markets Strategist at Exness
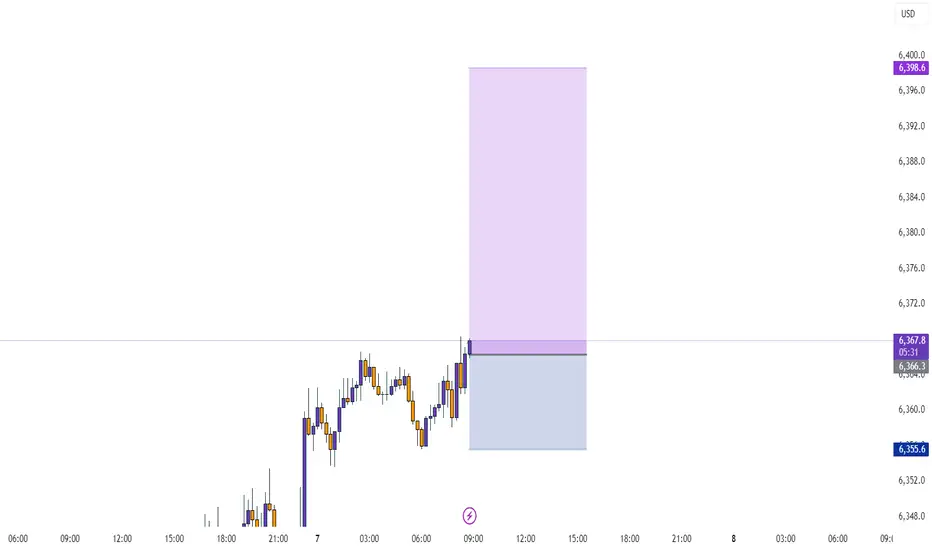
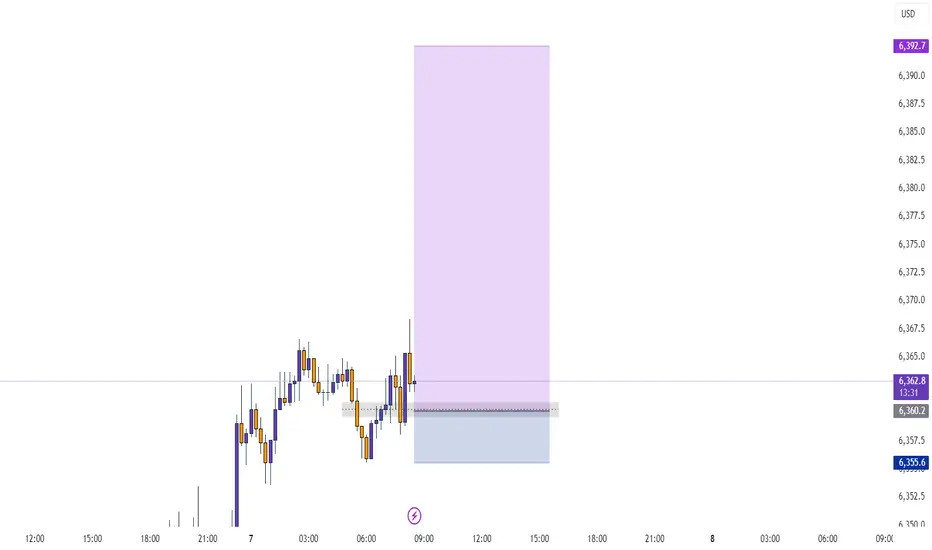
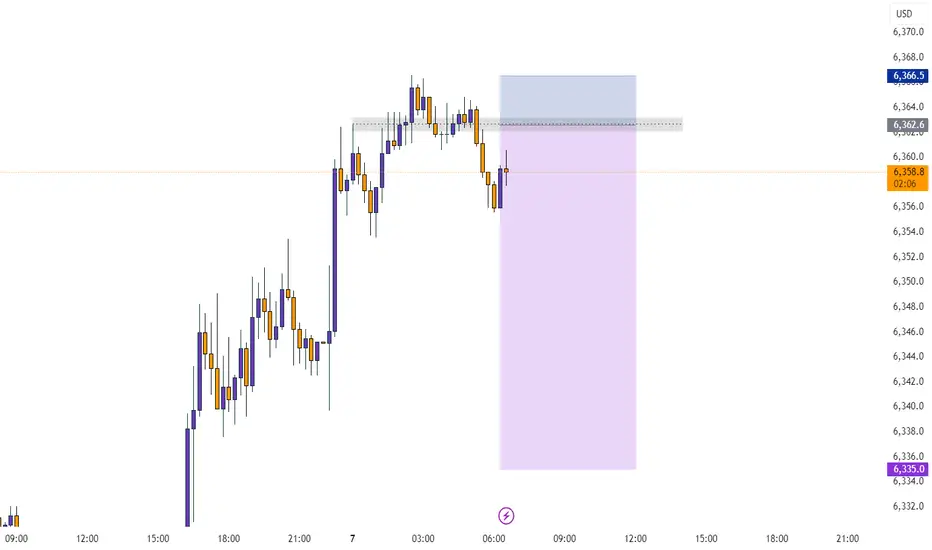
SPX BUY SPOT 8/61h had a unicorn setup I seen forming yesterday. Today I got on just after 7:30 am and saw price inside POI/IPA. All it did was WICK that gap, not fill it. I went against the 4h and 1h candles both being bearish because price reacted to the OPEN of the FVG. This makes it risky because we could still fill and sweep below that wick. Just had a little FOMO this morning once the reaction happened. No major news until tomorrow. I love the sweet spot where price is. Perfect HL area on 1 hour even tho we can sweep lower again, we shall see!

SPX Breakdown or Another Push Higher?Hi y'all thanks for tuning in! Here are a few written notes to sum up the video.
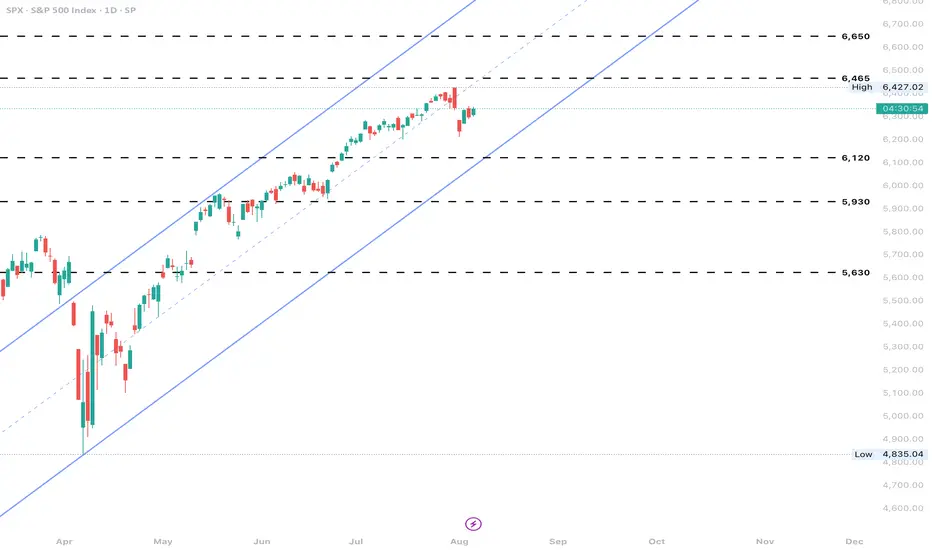
Indecision at New Highs
After breaking out to new all-time highs, SPX printed a doji on the weekly chart, signaling indecision. This hesitation could mark the start of digestion.
Still Structurally Bullish, but Extended
The weekly chart shows SPX is still holding trend structure, but price is notably extended from the 10EMA. Historically, when price moves too far from key short-term EMAs, it tends to reset either via time (sideways chop) or price (pullback).
Daily Chart Shows a Shelf Forming
On the daily chart, price has been consolidating just under the prior high with small-bodied candles. This is forming a “shelf” around the 6,260–6,280 zone. It’s acting like a pause, not a breakdown. Holding above this zone keeps the trend intact.
Pullback Risk Increases Below 6,232
If price loses 6,232 (last week's breakout area and short-term shelf), it increases the likelihood of a pullback toward the 6160 or even deeper toward the 5970. That lower zone also marks the bottom of the prior consolidation box from earlier this year.
Seasonality Reminder
Historically, July is strong in the first half, with weakness (if it shows up) arriving mid-to-late month. So far, price has tracked that seasonal strength. Any weakness from here would align with that typical timing.

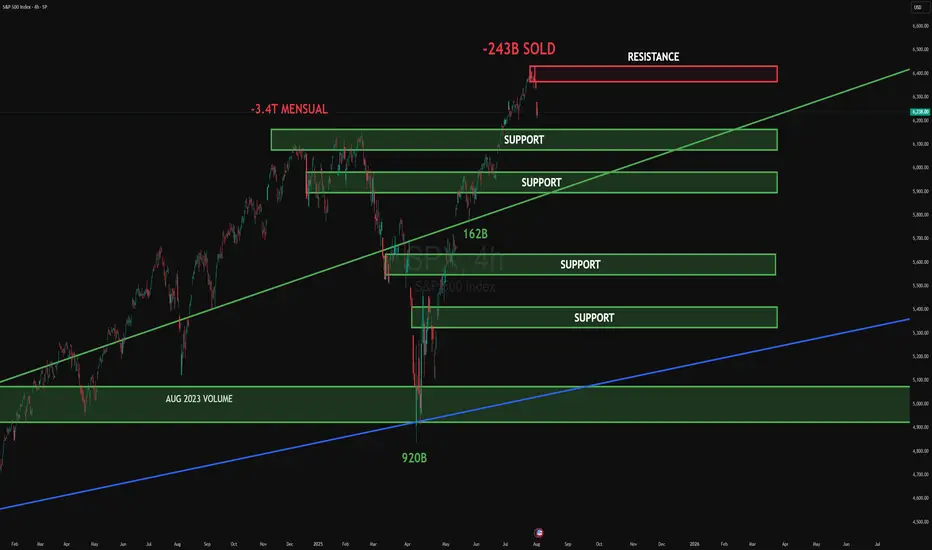
SPX CORRECTIONThe S&P 500 Index (SPX) faced strong rejection at the upper resistance zone near 6,400, where -243B was sold, signaling aggressive institutional distribution. This area aligns with the broader -3.4T monthly level, confirming it as a significant ceiling.
Multiple support levels lie below. The first key zone near 6,200 is being tested. If broken, deeper liquidity pockets are visible around 6,000 and 5,700, where 162B was previously absorbed. Further down, the high-volume August 2023 level near 5,000 remains a macro support with 920B of institutional activity.
Upside target (if reclaimed): 6,400
Downside target (if breakdown continues): 5,700 → 5,000
#SPX #globaltrade #investment #investing #stockmarket #wealth #realestate #markets #economy #finance #money #forex #trading #price #business #currency #blockchain #crypto #cryptocurrency #airdrop #btc #ethereum #ico #altcoin #cryptonews #Bitcoin #ipo
Bearish Engulfing on Risk. Average quarterly downside since 2023 open is 4.07%. Is a retest of near the yearly open on order over the month of August? Markets are no longer pricing in a Fed rate cut in September. Will that be the near term bearish fuel?

SPX500 NEARING AN IMPORTANT FIB. EXTENSION RESISTANCEIn this weekend's analysis I find the SPX500 to remain BULLISH for next few days as we have strong closings outside the upper KC band and also touching the upper Bollinger band on the higher time frames from Daily to Monthly charts. It's also important to note that declining volume bars is NOT supporting the monthly rally, while MACD, RSI divergences are also sounding warning sirens that it's near a major correction territory which I have measure as the fib extension 0.618 from the October, 2022 base or support on the monthly chart. As signaled last week that we could be getting a capitulation candle soon to the fib target. Once we get a reversal candle on the 4 Hours it will confirm that the intermediate tops is achieved on the SPX500 and a correction is highly probable. So our trade thesis is Bullish until we get a confirmed bearish signal on either the 4H or 1D timeframe with Stop loss at 6377 level. Thanks for visiting my publication and trade idea on the SPX500. Cheers and happy trading to everyone.

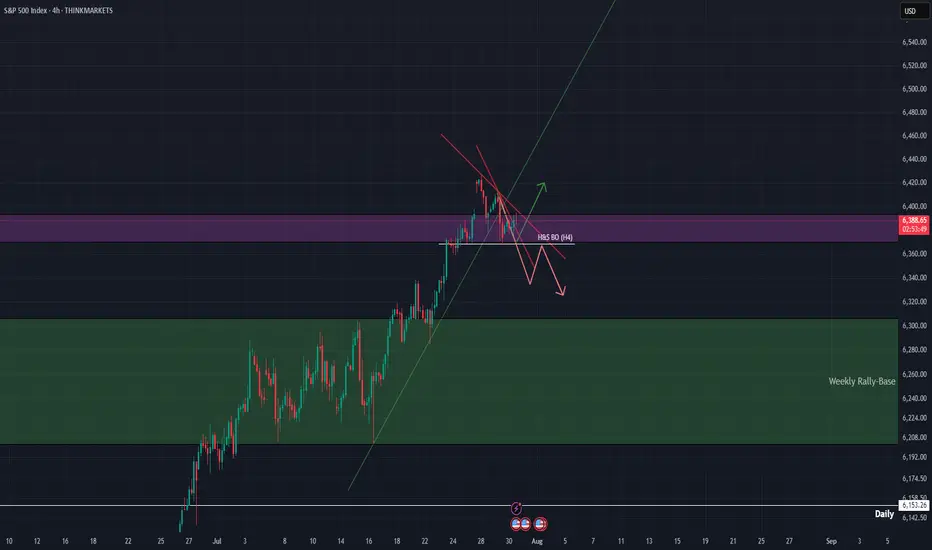
SPX500 AnalysisThis analysis is based on the 4-Hour timeframe, reversal trading, and trend formation.
If the price breaks below the white line (H&S breakout point) and closes, then my H&S pattern is complete, and I will short on its retest. I will post updates about this trade soon!

SPX500 Buy analysis/ideaThis trade is based on the 4-hour chart and executed using reversal trading, trend formation and an update on the analysis I posted on this instrument yesterday.
Complete explanation in the video!

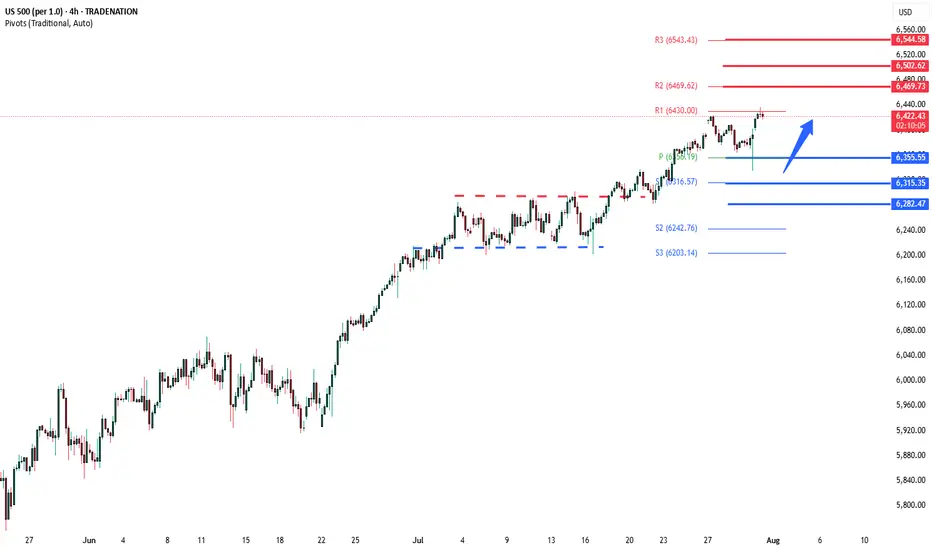
S&P500 uptrend pause supported at 6355The S&P 500 slipped -0.12% after initially rising +0.3%, as Fed Chair Powell’s cautious “wait-and-see” stance on rate cuts dampened sentiment. The metals and mining sector dragged the index lower, falling nearly -4% after the U.S. announced surprise copper tariff details—excluding refined metal until 2027—leading to a sharp -20% drop in COMEX copper futures.
However, market sentiment rebounded overnight, driven by strong tech earnings. Meta surged +11.5% post-market on upbeat Q3 guidance and rising AI-driven ad revenues, while Microsoft rose over +8% thanks to better-than-expected Azure cloud growth and a $30 billion AI infrastructure investment.
Conclusion:
Despite short-term pressure from the Fed’s tone and commodity weakness, strong AI-driven earnings from major tech firms are likely to support a positive bias for the S&P 500 in the near term, especially in the tech-heavy growth segments. Broader gains may depend on upcoming inflation data and Fed clarity.
Key Support and Resistance Levels
Resistance Level 1: 6470
Resistance Level 2: 6500
Resistance Level 3: 6545
Support Level 1: 6355
Support Level 2: 6315
Support Level 3: 6282
This communication is for informational purposes only and should not be viewed as any form of recommendation as to a particular course of action or as investment advice. It is not intended as an offer or solicitation for the purchase or sale of any financial instrument or as an official confirmation of any transaction. Opinions, estimates and assumptions expressed herein are made as of the date of this communication and are subject to change without notice. This communication has been prepared based upon information, including market prices, data and other information, believed to be reliable; however, Trade Nation does not warrant its completeness or accuracy. All market prices and market data contained in or attached to this communication are indicative and subject to change without notice.
FOMC rate decision 30-07-2025FOMC announced no change to interest rate, but the new tariffs is the major player for the upcoming quarter, we shall see its effect on the economy and corporates earnings soon, then the fed can make better judgment whether to lower interest rate or not.
Disclaimer: This content is NOT a financial advise, it is for educational purpose only.

SPX500USD | Retesting All-Time HighsThe index has extended its bullish rally, printing a new local high at 6,286.5 before showing signs of slight hesitation with consecutive small-bodied candles.
Support at: 6,134.5 / 6,026.0 / 5,926.2 🔽
Resistance at: 6,286.5 🔼
🔎 Bias:
🔼 Bullish: Sustains above 6,134.5 and breaks 6,286.5 for new highs.
🔽 Bearish: Break below 6,134.5 could trigger a retracement toward 6,026.0.
📛 Disclaimer: This is not financial advice. Trade at your own risk.

SPX500 AnalysisThis analysis is based on the 4-hour timeframe, reversal trading, and trend formation. I've posted a video explaining what I think is probable to happen and why.
Tuesday 29 July: Forex Market thoughts The EUR has begun the week under pressure following the US / EUR trade deal.
EUR weakness could be out down to what they call 'sell the fact', meaning buy last week's deal rumours / sell (take profit) on the announcement. Or, more likely, it could be because it appears the US has the better side of the deal. Either way, all of lat week's EUR positivity has dissipated.
I didn't get involved in a EUR short trade yesterday, but there is a case to say it was viable.
The USD and JPY begin the week on the front foot. Possibly benefitting from 'EUR liquidity', or possibly due to 'positioning' ahead of this week's FOMC and BOJ meetings.
As things stand, with the VIX below 15 and the S&P still riding high, I maintain my view that according to market fundamentals, 'risk on' trades 'should' be viable. Which means staying patient and waiting for a turnaround, particularly on the JPY charts.
If that turnaround doesn't come, I could be forced to change my view.
S&P500 uptrend pause supported at 6355US equities were largely subdued, with the S&P 500 inching up +0.02%, marking its sixth straight record high, the longest streak since July 2023. Despite the headline gain, over 70% of S&P 500 stocks declined, revealing weak breadth and suggesting index gains are being driven by a narrow group of large-cap tech names.
Tech led the way, with the information technology sector +0.77% and the Mag-7 rising +0.79%.
Semiconductors outperformed, as the Philadelphia Semiconductor Index climbed +1.62%, driven by AMD’s +4.32% surge.
Momentum is building ahead of key Big Tech earnings: Microsoft and Meta report tomorrow; Apple and Amazon follow Thursday.
Meanwhile, traders are staying cautious ahead of a busy macro week:
FOMC decision (Wednesday),
Core PCE, Q2 GDP, ISM, and nonfarm payrolls still to come.
Geopolitical developments include a possible 90-day US-China trade truce extension and Taiwan cancelling overseas travel, which may help de-escalate tensions.
On the corporate front:
Apple's India strategy sees it surpass China as the top smartphone source for US buyers.
Harley-Davidson may sell its finance unit in a $5B deal with Pimco and KKR.
Vitol rewarded top staff with $10.6B in share buybacks—a record.
Conclusion for S&P 500 Trading
The S&P 500 continues to post record highs, but narrow leadership and weak breadth raise red flags. With tech doing the heavy lifting, near-term direction hinges on earnings from Microsoft, Meta, Apple, and Amazon. Broader market upside looks fragile ahead of critical Fed and economic data, suggesting that any disappointment could trigger a pullback. Stay cautious and watch for rotation or retracement if macro or earnings catalysts falter.
Key Support and Resistance Levels
Resistance Level 1: 6430
Resistance Level 2: 6470
Resistance Level 3: 6500
Support Level 1: 6355
Support Level 2: 6315
Support Level 3: 6280
This communication is for informational purposes only and should not be viewed as any form of recommendation as to a particular course of action or as investment advice. It is not intended as an offer or solicitation for the purchase or sale of any financial instrument or as an official confirmation of any transaction. Opinions, estimates and assumptions expressed herein are made as of the date of this communication and are subject to change without notice. This communication has been prepared based upon information, including market prices, data and other information, believed to be reliable; however, Trade Nation does not warrant its completeness or accuracy. All market prices and market data contained in or attached to this communication are indicative and subject to change without notice.

SPX....what goes up, must go downThis is long overdue. SPX has just crossed 9SMA, next 50SMA then 200SMA. Won't be surprised if it knocks each very soon. This will be a big week and tariffs are going to start hitting; even though this was mostly artificial and Americans are paying 90% of it! When in doubt, sell and park in money market! The next dip will hit hard and deep. Don't let the small wins overshadow the deep issues in the economy. Overpriced market and many lagging indicators will soon hit and default rates that are coming out are scary! Stay safe and don't get emotional over any stock. If it dips, you can always buy it cheaper.
Bulls and Bears zone for 07-28-2025Last week 4 out of 5 sessions S&P 500 made new ATH. However they were all trading within a tight range.
Level to watch: 6434---6436

US 500 – Potentially A Pivotal Week Ahead The US 500 index registered a new record closing high on Friday at 6396 continuing a bullish trend that has yet to show many signs of faltering. The Monday open has seen this move extend as traders digest the positive news flow from the weekend that a US/EU trade deal has been agreed after President Trump and EU Commission head Ursula Von der Leyen, met in Scotland on Sunday. This has seen the US 500 index rally another 0.4% to a new high of 6429 (0730 BST).
However, the week ahead could be a pivotal one for the direction of US stock indices over the remainder of the summer, and in this regard, it is perhaps surprising that market volatility measures, such as the VIX (fear Index), are back to their lowest levels since late March, indicating limited trader concern for what lies ahead. Although, things can change very quickly.
In many ways the week ahead is one that has it all, including a new round of US/China trade talks which start today, a Federal Reserve (Fed) rate decision, key tech earnings, tier 1 US data releases and on-going trade/tariff discussions. More than enough to ensure there is the potential for US 500 price action to become increasingly volatile as the week progresses.
Looking forward, Wednesday could be a very busy day, with the Fed Interest Rate Decision released at 1900 BST and quickly followed at 1930 BST by the press conference led by Chairman Powell, who has been under intense political pressure in the last 10 days. While the Fed are expected to keep rates unchanged, traders may be interested to see which policymakers were keen to vote for a cut, as well as whether Chairman Powell’s comments indicate a September rate reduction may be more likely than currently anticipated.
Then, later Wednesday evening Microsoft, Qualcomm and Meta release their earnings updates after the close, with Amazon and Apple’s results due after the market close on Thursday. These releases could be crucial for sentiment towards the US 500, with particular focus being paid to what these companies say about future revenue and tariff issues, as well as the specific performance of AI and cloud services.
This only takes us to the middle of the week, which is where the tier 1 US economic data releases take over, with the PCE Index, the Fed’s preferred gauge of inflation, due on Thursday at 1330 BST, and then the all-important Non-farm Payrolls update on the current health of the US labour market released on Friday at 1330 BST. US 500 index traders may well be sensitive to the outcome of both of these prints.
That’s still not all. Friday’s US employment update coincides with President Trump’s tariff deadline which could add to US 500 volatility into the weekend.
Wow, I did say it’s a week that has it all!
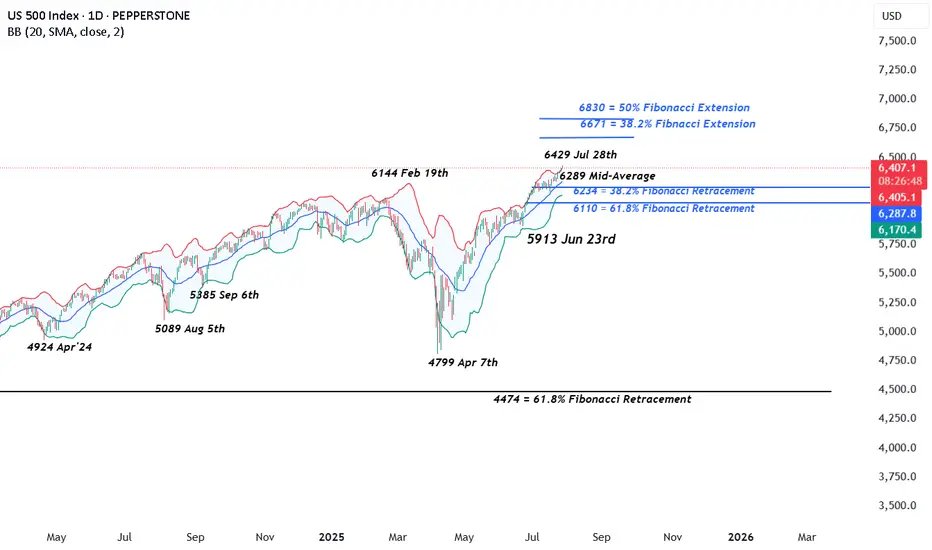
Technical Update: New All-Time Highs Posted Again
It looks as if the latest US 500 index activity is maintaining the current positive trending themes after another all-time high was posted this morning at 6429. This could skew risks towards the further development of the pattern of higher price highs and higher price lows that has materialised since the April 7th downside extreme at 4799 was seen.
However, it must be remembered, these moves do not guarantee this price activity will continue, so traders may find it useful to assess the possible support and resistance levels that could influence price activity moving forward across what is set to be a very busy week of events.
Possible Support Levels:
If any US 500 price weakness does materialise across the week ahead with the potential to develop into a more extended phase of declines, a support level that traders may consider worth monitoring could be 6289.
6289 is equal to the current level of the rising Bollinger mid-average. Closing breaks below 6289 might suggest a more extended phase of weakness is possible, opening the potential for moves back to 6234, which is the 38.2% Fibonacci retracement, possibly further if this level in turn gives way.
Possible Resistance Levels:
Having been capped by the 6429 all-time high this morning, sellers may continue to be found at this level, so this might prove to be the first potential resistance if fresh attempts at price strength develop over the coming week.
It may be helpful for traders to watch how this 6429 level is defended on a closing basis, as successful closing breaks might suggest a further extension of the uptrend pattern currently evident in price activity.
Such closing breaks higher may well suggest price strength towards 6671, which is the 38.2% Fibonacci extension level of the February 19th to April 7th sell-off.
The material provided here has not been prepared accordance with legal requirements designed to promote the independence of investment research and as such is considered to be a marketing communication. Whilst it is not subject to any prohibition on dealing ahead of the dissemination of investment research, we will not seek to take any advantage before providing it to our clients.
Pepperstone doesn’t represent that the material provided here is accurate, current or complete, and therefore shouldn’t be relied upon as such. The information, whether from a third party or not, isn’t to be considered as a recommendation; or an offer to buy or sell; or the solicitation of an offer to buy or sell any security, financial product or instrument; or to participate in any particular trading strategy. It does not take into account readers’ financial situation or investment objectives. We advise any readers of this content to seek their own advice. Without the approval of Pepperstone, reproduction or redistribution of this information isn’t permitted.
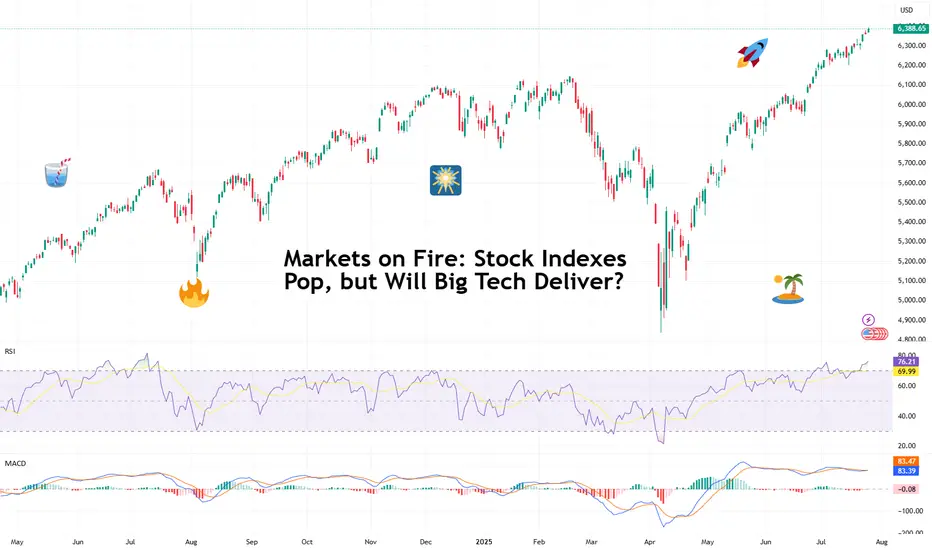
Markets on Fire: Stock Indexes Pop, but Will Big Tech Deliver?S&P 500 and Nasdaq set records. Now it's up to big tech to justify that.
Talk about forward-looking valuation. Tech companies’ valuations are largely based on future potential rather than current performance. And that’s what we’re seeing right now getting priced in across the big indexes.
You’d think we’d be bored of record highs by now. But no — Wall Street keeps hitting refresh on its all-time-high counter. 🎵 Over and over again. 🎵
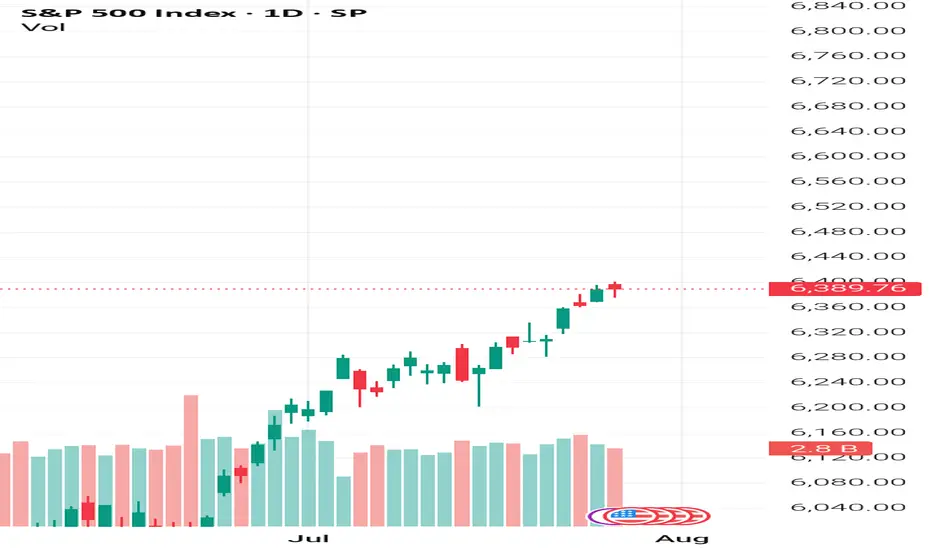
On Friday, the S&P 500 SP:SPX notched its 14th record close this year, ending at 6,388.64. The Nasdaq Composite NASDAQ:IXIC followed with its 15th at 21,108.32. Even the Dow TVC:DJI — the older sibling who prefers yield over hype — climbed nearly 0.5% to 44,901.92, within a latte’s foam of its December record .
And while indexes are breaking personal bests, investors are buying ahead of some big data deliveries. Why? Because the week ahead is the Super Bowl of Earnings, and the bigger chunk of the Magnificent Seven is up next.
😎 What in the Magnificent Seven?
A highly exclusive club with just seven members, the Mag 7 has entered the earnings spotlight — and the audience isn’t going mild. Traders are pricing perfection, and the script better deliver.
Meta NASDAQ:META kicks things off Wednesday after the close with expected revenue of $44.8 billion and EPS of $5.87. Can Zuckerberg’s AI narrative get investors to forget about the metaverse?
Microsoft NASDAQ:MSFT shows up at the same time, hoping to dazzle with $73.8 billion in revenue and $3.38 EPS. Copilot AI better be doing overtime.
Then on Thursday, again after lights out, Amazon NASDAQ:AMZN joins the chat with its AWS and ecommerce empire expected to pick up $162.1 billion in revenue. Right behind is Apple NASDAQ:AAPL , fighting to stop its slide into meh-land with projected revenue of $89.2 billion and $1.43 EPS. (Fast fact: AAPL is down 12% year to date — among the worst performers in the crew.)
So far, Alphabet NASDAQ:GOOGL already crushed its quarter , posting $96.4 billion in revenue and $2.31 EPS, plus a spicy raise in capex to $85 billion.
Tesla NASDAQ:TSLA ? Not so great. The EV maker reported a 12% revenue drop and a 16% net income decline, spooking investors with a warning of “rough quarters ahead.” The stock is lower by 17% year to date.
Nvidia NASDAQ:NVDA , the AI trailblazer, reports in late August. Until then, it’s chilling on a $4 trillion throne, as per our Top companies rankings, watching its friends sweat it out.
💸 Can the Mag 7 Keep Carrying?
Here’s a harsh dose of reality: the entire S&P 500 is riding on the backs of these seven stocks. Analysts expect them to post 14% earnings growth, while the other 493 companies limp along at 3.4%. Talk about top-heavy things.
So what happens if even one tech titan misses the mark big time and spooks with scary guidance? A market correction? A buy-the-dip opportunity?
And let’s not forget: valuations are stretched. The S&P 500 is now trading at nearly 23x forward earnings (that’s projected profits per share). And the Nasdaq? Don’t even ask. (We’ll tell you anyway — it’s close to 30x). In all that, now’s a great time to keep a close eye on the Earnings Calendar .
📊 Not All Is Big Tech: Fed and Jobs Loom
As if this week wasn’t already packed enough, macro is back on the menu. The Federal Reserve meets Tuesday and Wednesday, and Chair Jay Powell is expected to hold rates steady at 4.5%.
But don’t rule out drama. A single hawkish word and this party could quickly get some rain on. Powell, the man who moves trillions with a simple “Good afternoon,” has a track record of putting markets in their place when they get too euphoric.
And then there’s Friday’s nonfarm payrolls report. Consensus calls for just 108,000 jobs added in July — soft, but not disastrous, and fewer than June’s 147,000 . Blame summer hiring slumps, tariff uncertainty, or the market finally digesting its own hype.
Off to you : Can the Magnificent Seven keep this market magnificent? Or are we about to learn what happens when you ride too close to the sun on AI-generated wings?