Warning: SPX500 May Have Peaked—Here’s What the Charts SayThe S&P 500 (SPX500) may have reached its peak. In this video, I reveal the technical evidence pointing to a potential reversal—including monthly bearish divergence, daily and weekly reversal candles, and confirmation from key indicators.
This isn’t just noise—these signals align across timeframes, suggesting a shift in momentum that could lead to significant downside. I’ll walk you through the charts, explain the implications for traders and investors, and highlight critical support levels to watch.
Thank you for watching and have a great trading week. Cheers!!
USA500 trade ideas

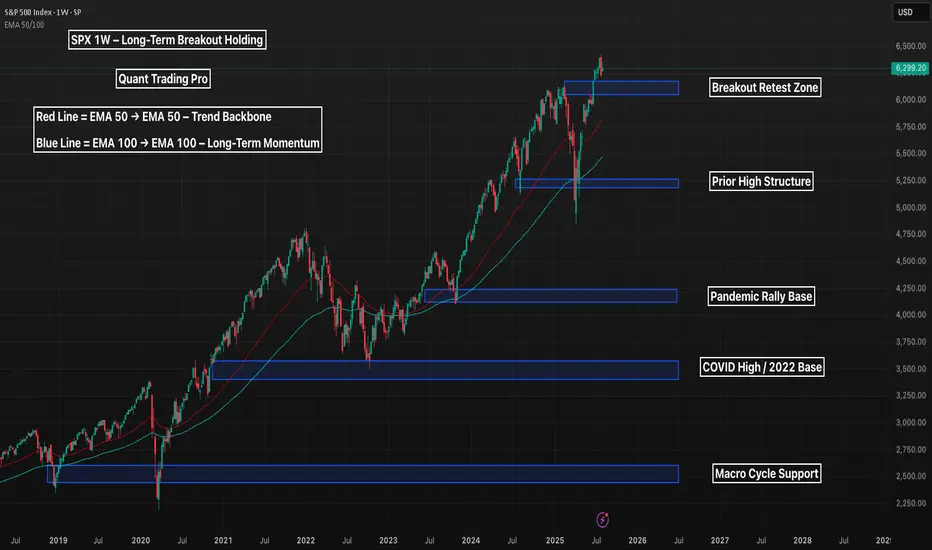
SPX 1W – Long-Term Breakout Holding, Can the Rally Sustain?The S&P 500 just printed a weekly breakout above historical highs, tapping into uncharted territory above 6,300 — but now the question is whether the trend can sustain or if a deeper retest is on the horizon.
🔹 Macro Structure
Multiple clean support levels exist below, each marking prior macro pivots — from the 2020 breakout to the 2022 base.
The most immediate zone of interest is 6,100–6,200, which could act as a bullish retest zone if this breakout is valid.
Deeper downside remains structurally healthy unless 4,250 or below is breached.
🔹 Trend Health
Price remains well above the EMA 50 and 100, showing no signs of structural weakness.
Pullbacks into the EMAs historically triggered trend continuation — and bulls will likely treat those zones as reload points.
🔹 Big Picture
As long as SPX holds above 5,400, the macro bull trend remains intact.
A drop to retest lower zones wouldn’t necessarily break the uptrend — but it would shake sentiment and invite reaccumulation.
Is this the beginning of a new macro leg — or the last shake before a deeper correction?
Let’s chart it out 👇
S&P 500 ETF & Index– Technicals Hint at a Possible Correction📉📊 S&P 500 ETF & Index at Resistance – Technicals Hint at a Possible Correction 🔍⚠️
Everything here is pure technicals— but sometimes, the market whispers loud and clear if you know how to listen. 🧠📐
The VOO ETF, which tracks the S&P 500 , has now reached the upper boundary of a long-term ascending channel, once again brushing against resistance near 590.85. This zone has consistently led to major pullbacks in the past.
On the right panel, the US500 Index mirrors this move—pushing toward all-time highs, right as broader sentiment turns euphoric. Technically, both charts are overextended and pressing into key zones.
👀 Potential Path:
🔻 Rejection from current zone ➝ Down toward 526.17, then 465.72 (green support channel)
🔁 Possible bounce after correction — trend still intact long term
And while we’re keeping it technical, it’s worth noting that the Buffett Indicator (Stocks-to-GDP) i s currently screaming “overvaluation.” This doesn't predict timing—but it adds macro context to an already overheated chart setup.
The lesson? Price respects structure. Whether or not the fundamentals are in agreement, the charts are warning that now may not be the time to chase.
History doesn’t repeat, but it often rhymes. Stay sharp, stay technical. 🎯
One Love,
The FX PROFESSOR 💙
ps. the beauty of these levels? Tight Stop loss- excellent R/R
Disclosure: I am happy to be part of the Trade Nation's Influencer program and receive a monthly fee for using their TradingView charts in my analysis. Awesome broker, where the trader really comes first! 🌟🤝📈

Are you loosing money?....... Please Read.I’ve shared this chart previously, but I’ve just given it another update.........
This is pure simplicity. If the price is above the moving averages, it's a good opportunity to trade. Did it close under any moving average? Step back and wait.
Stop trying to call tops or bottoms. Stop day trading crypto and FX. Stop attempting to master Elliot wave theory or ICT.
Concentrate on a single market, US stocks, align with the trend, and capitalise on a tested advantage. STOCKS WANT TO GO UP!!!!!!
Another advantage- Utilise a tax-advantaged account (IRA, ISA), try spread betting, or leverage an ETP (like 5xSPY).
Keep it simple, follow the trend. It does'nt have to be complicated.


Activation of the rounded pattern? Or a trend reversal?In the previous analysis, we mentioned that the price was at a decision point — and it made its decision, managing to move up slightly before returning to the bottom of the channel.
Now, at the end of the channel, a pattern has formed. We need to see whether it gets activated or turns out to be a fake.
If the pattern fails (turns out fake), the bullish trend could continue more strongly.
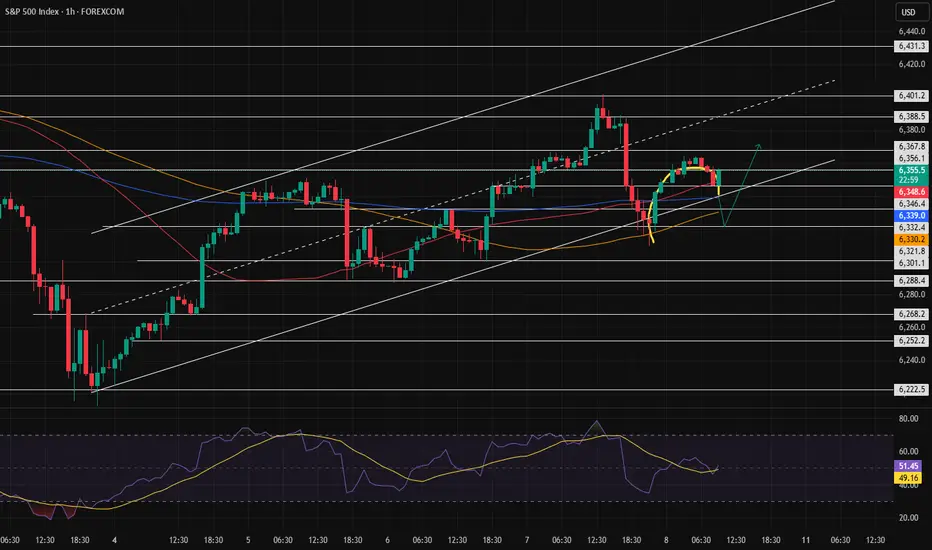
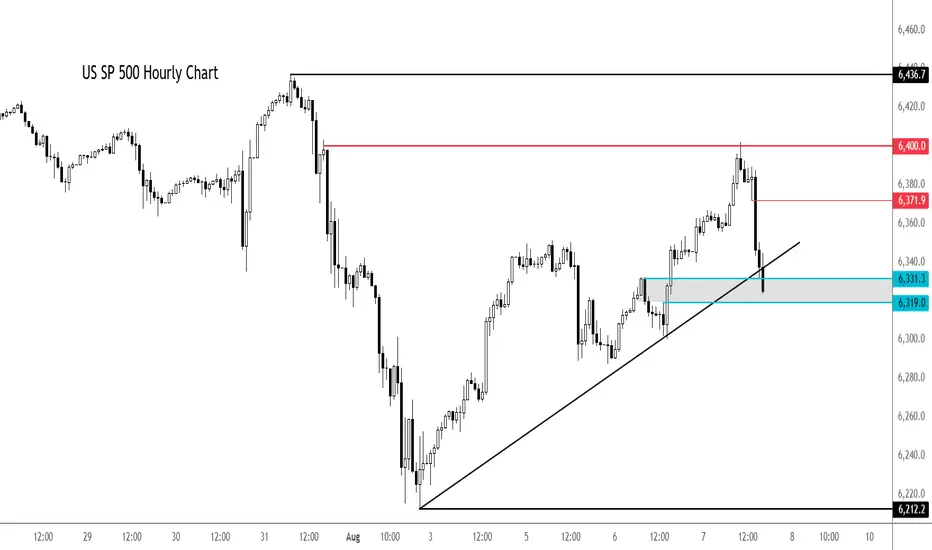
S&P 500 extends drop - can dip buyers come to rescue again?After a decent rally earlier in the day, the major indices and futures started to ease off around mid-morning London trade, before easing further lower in the last couple of hours.
At the time of writing, the S&P was testing its session lows. Here it was probing support and a short-term bullish trend line in the 6319-6331 range. This area needs to hold to keep the bulls happy and in charge. Break this and we could see a bigger correction in the days ahead.
Resistance now comes in at 6372 followed by 6,400.
By Fawad Razaqzada, markets analyst with FOREX>com
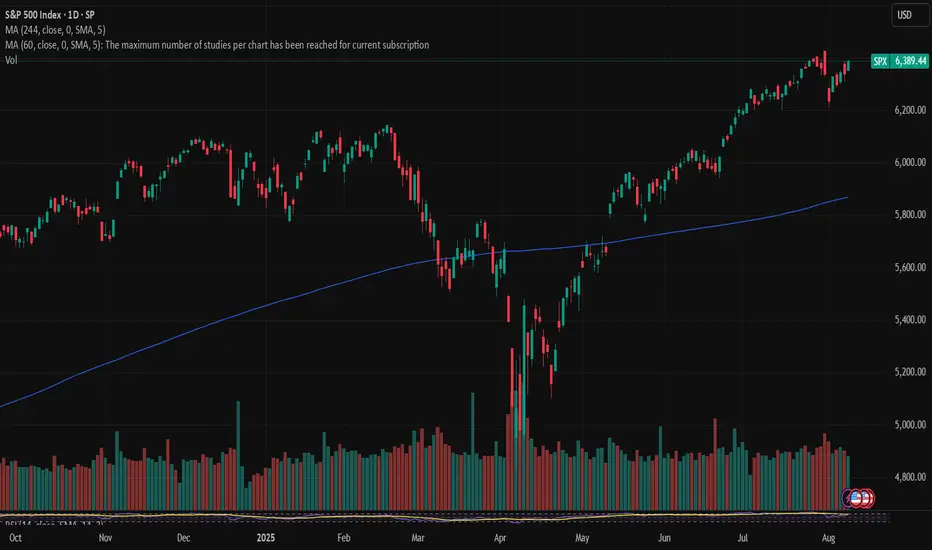
S&P500 Channel Up going straight to 6670.The S&P500 index (SPX) has been trading within a 3-month Channel Up since the May 12 candle. All of this time, it has been supported by the 1D MA50 (blue trend-line) and as long as it holds, the new Bullish Leg is expected.
The last two rose by +7.06%, and ahead of a new 1D MACD Bullish Cross, that gives us a medium-term Target of 6670.
-------------------------------------------------------------------------------
** Please LIKE 👍, FOLLOW ✅, SHARE 🙌 and COMMENT ✍ if you enjoy this idea! Also share your ideas and charts in the comments section below! This is best way to keep it relevant, support us, keep the content here free and allow the idea to reach as many people as possible. **
-------------------------------------------------------------------------------
Disclosure: I am part of Trade Nation's Influencer program and receive a monthly fee for using their TradingView charts in my analysis.
💸💸💸💸💸💸
👇 👇 👇 👇 👇 👇

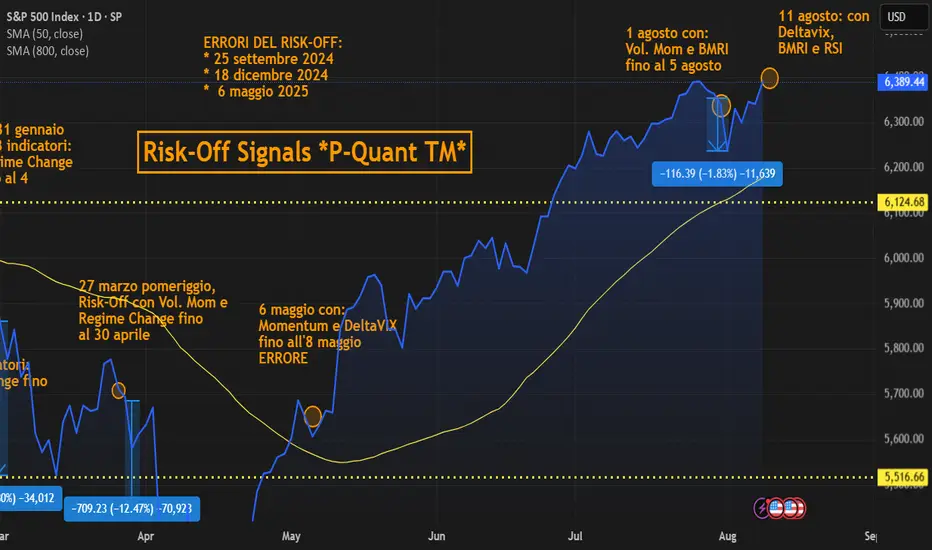
SPX: awaits inflation data Regardless of concerns regarding the future effects of implemented trade tariffs by the U.S. Administration, the positive sentiment continued to hold on the U.S. equity markets during the previous week. The S&P 500 closed the week at the level of 6.389, surging by 2,4% for the week. The index is slowly nearing its all time highest level, achieved on 31st July, at the level of 6.426.
Friday's rally was for one more time led by tech companies. Shares of Apple gained around 13% for the week, after the company announced its significant investments of $600B within the next four years in the U.S. Analysts are calling this deal as “appease” to the U.S. President, who on several occasions expressed his wish that IPhones are made in the U.S.A. As per comments made by Tim Cook, CEO of Apple, “the final assembly that you focus on, that will be elsewhere for a while”, meaning that the production of IPhones is still not going to be done in the U.S.A. Nevertheless, markets reacted positively to Cook's meeting with the U.S. President, especially taking into account a heavy burden of tariffs, which the U.S. President announced to be 100% on chip imports.
Considering current market sensitivity on inflation data, the week ahead might bring some major testing for the U.S. equity markets, as July inflation data are scheduled for a release. Analysts are noting that any surprises in the inflation figures might imply a correction in the value of US companies, especially after a significant surge during the last four months.
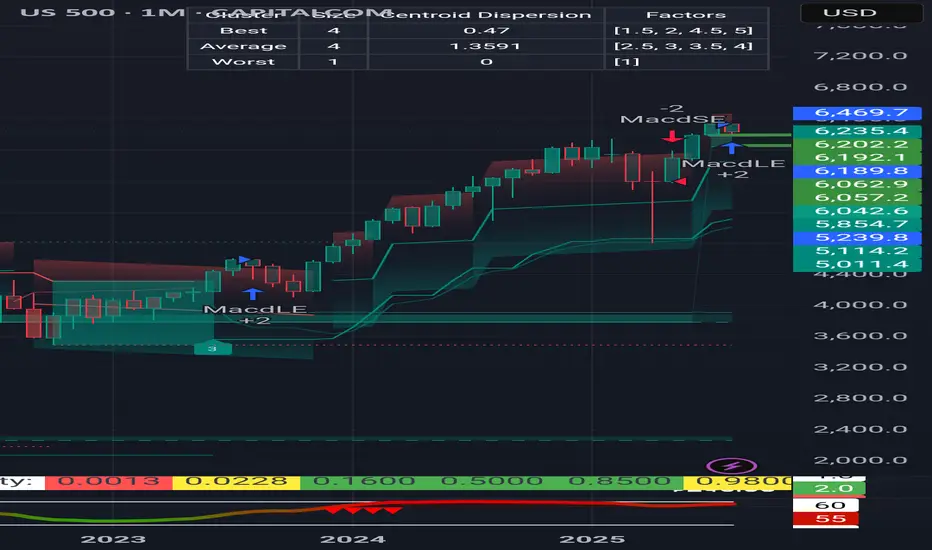
S&PS&P 500 waiting for overbought of 240 min. If it pass 6427 net resistance is about 6615. at this resistance there is a chance to drop 1 oversold of timeframe 240 min. however, it is on a long up trend, which the mid period target is 6952 (2-4 months). however, during this period it may go direcly to 6952 or down for 1 oversold of timeframe day or 240 min is OK. Note that the very importance supporting line,which should not be lower is at 4841. if it not fall below this point. S&P still on the uptrend.

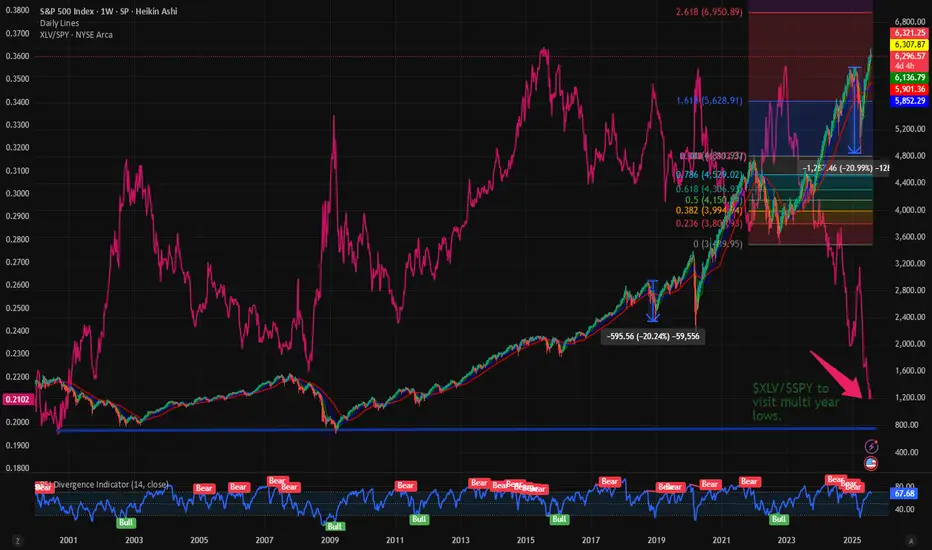
$XLV vs $SPY at multi year low. Is more downside expected? In this space we talk a lot about the market outperformance and how this has resulted in indexes at ATH. The SP:SPX and NASDAQ:NDX and their corresponding ETFs: NASDAQ:QQQ and AMEX:SPY have also made ATHs. But if peel under the surface we can observe that very few sectors have consistently outperformed the S&P 500. The Technology sector represented by AMEX:XLK has consistently outperformed the $SPY. The $XLK/ AMEX:SPY is in a upward channel depicted by the purple line. The SPDR select sector Technology sector has consistently increased its weightage on AMEX:SPY and the ratio $XLK/ AMEX:SPY is currently at 0.41 which is an ATH.
But the same cannot be told about the SPDR Healthcare Sector. The ratio between $XLV/ AMEX:SPY is making multi year low. With the ratio currently at 0.21 it is approaching its multi-year lows of 0.1975. The ratio was so low last in Sept 2000. Hence the question comes what should we expect the AMEX:XLV which is making new lows against the AMEX:SPY ? Will we visit the lows of 0.1975? If it happens then can we expect a upward momentum from his double bottom situation?
In my estimate in this bull market and Tech sector outperforming the AMEX:XLV will make new lows vs AMEX:SPY and the ratio will revisit the 2000 lows. But if on the macro front we have weak jobs numbers and recession risk rising then the AMEX:XLV can in fact draw inflows and outperform the index. Hence my estimate $XLV/ AMEX:SPY will sweep the multi-year low and then bounce back into 2026.
Verdict: Still more downside possible in $XLK/$SPY. Go long AMEX:XLV when the ratio is @ 0.1975 and into 2026.
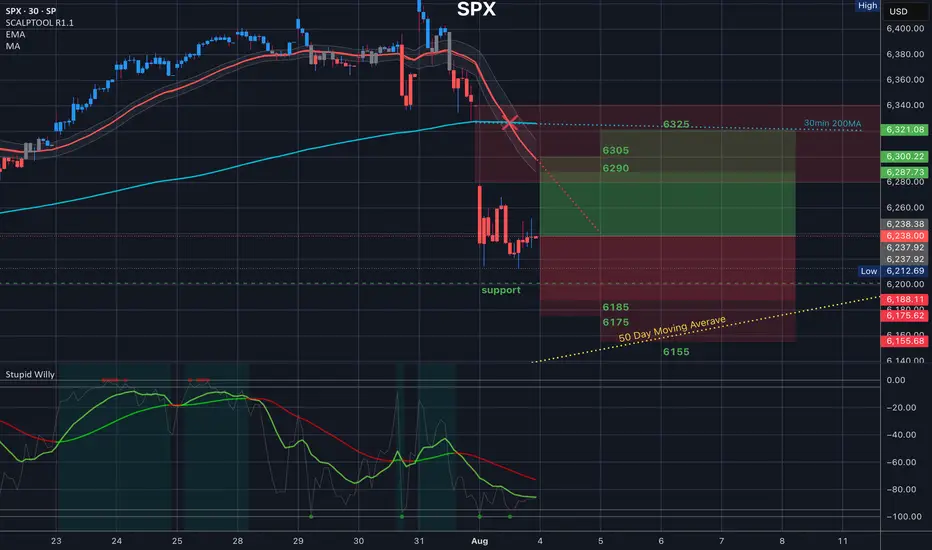
$SPX Analysis, Key Levels & Targets 8.4.25
Today’s Trading Range - we have a great range expansion here from last Friday’s drop. Some interesting targets here. Let me know what you see.
S&P 500 Daily Chart Analysis For Week of August 1, 2025Technical Analysis and Outlook:
During the trading activity of the previous week, the S&P 500 Index displayed a predominantly bearish movement after completing our Outer Index Rally target of 6420, as highlighted in the prior week’s Daily Chart Analysis, with the primary objective now being to plug our Mean Support at 6200.
It is essential to recognize that the current price movement may trigger a significant further pullback to the Mean Support level of 6090. Following this downturn, it is expected that the index will resume its upward momentum, aiming for a retest of the Outer Index Rally peak at 6420.

Correction will be to 6050-6190, probably the upper limit Now I notice something very important and things and the analyses of many actually coincide. Monthly support from the accumulated volume lies between 6050 and 6170. 4h indicators show a clear reversal. Separately, at these levels are the previous ATH. In my opinion, it is possible to stop even at 6180-6190. We will probably start with a gap on Monday. Now here comes the moment and over the weekend what will take place as conversations and statements in the media, but it is very likely that the minimum could happen as early as Monday night (USA time) or by Tuesday. I agree that this correction was necessary and should have happened as soon as possible because things became difficult even for bulls like me.
S&P Market Update – Signs of a Short-Term Correction?Although the S&P remains in an uptrend, recent price action suggests that momentum may be fading.
📉 Key Observations:
A Key Day Reversal occurred at 6409 – a potential warning signal.
We're seeing RSI divergence: price made a new high, but RSI didn’t follow suit.
The market is grinding higher, but without conviction.
📊 What to Watch:
The 15-day EMA, currently at 6317, is acting as near-term support. A close below this level could trigger a short-term correction.
Initial downside targets: 6147–6100, the previous highs from late 2024 and early 2025.
✅ To negate this bearish bias, the market would need to break above 6409 and continue higher with stronger momentum.
Stay alert — the technicals are flashing red flags. Always manage risk accordingly.
Disclaimer:
The information posted on Trading View is for informative purposes and is not intended to constitute advice in any form, including but not limited to investment, accounting, tax, legal or regulatory advice. The information therefore has no regard to the specific investment objectives, financial situation or particular needs of any specific recipient. Opinions expressed are our current opinions as of the date appearing on Trading View only. All illustrations, forecasts or hypothetical data are for illustrative purposes only. The Society of Technical Analysts Ltd does not make representation that the information provided is appropriate for use in all jurisdictions or by all Investors or other potential Investors. Parties are therefore responsible for compliance with applicable local laws and regulations. The Society of Technical Analysts will not be held liable for any loss or damage resulting directly or indirectly from the use of any information on this site.

The $CURE For Your Healthcare PortfolioHey team,
Everyone knows how the health sector is beat up.
The Trump administration hasn't shown any mercy to the health and pharma sectors. They’ve been hammering Big Pharma with a mix of fiery rhetoric and aggressive policy moves. Trump has brought back his “most favored nation” drug pricing plan, tying Medicare reimbursements to what other countries pay, slashing profits for drugmakers who’ve been charging Americans a fortune.
As a result, some of the top health stocks such as NYSE:PFE , NYSE:LLY , NYSE:JNJ , and NYSE:UNH , among many others, have been suffering.
We need, however, to understand that healthcare is sometimes cyclical, and there are some clues that tell us what's likely to happen next:
For most years, AMEX:XLV (health index ETF) is highly correlated with the $SP:SPX. Historically, when this correlation breaks, it's either because healthcare is lagging behind the S&P 500, or because the S&P 500 is crashing, and healthcare is holding well because healthcare is recession-resistant. Typically, these moments of uncorrelation are followed by a very well-performing healthcare sector.
AMEX:XLV / SP:SPX is now at a 25-year low! Healthcare stocks have never been so low in 25 years compared to the benchmark.
While the S&P P/E ratio is at 28, healthcare is at 14. This shows a potentially underdeveloped sector.
The spread between healthcare and the rest of the stock market is very large and unnatural. Considering this, it's more likely that it will regress to its mean and recover. You can see this in the Dual Z-Score indicator in the chart.
Additionally, the US midterms are coming, which can bring policy changes that might favor healthcare again.
Now, you might be wondering: Why invest in AMEX:CURE and not in AMEX:XLV ?
I plan to allocate around 2% of my portfolio to CURE, the 3x leveraged ETF, because it's an easier way to achieve the proper Kelly allocation to this sector, a sector that I believe will recover over the next couple of years. The leverage provided by this ETF will help compound returns.
Is this strategy risky?
Well, CURE is 3x more volatile than XLV, but this is the way I see it: healthcare is already too beat up to continue declining sharply from here. Additionally, healthcare is recession-resistant, meaning that it should not be too affected if the US economy suffers, enters a recession, or if unemployment numbers increase.
I think CURE gives me a potentially good risk/reward ratio, considering that if healthcare catches up with the S&P 500, CURE could return approximately (and very roughly) 100%.
Quick note: I'm just sharing my journey - not financial advice! 😊

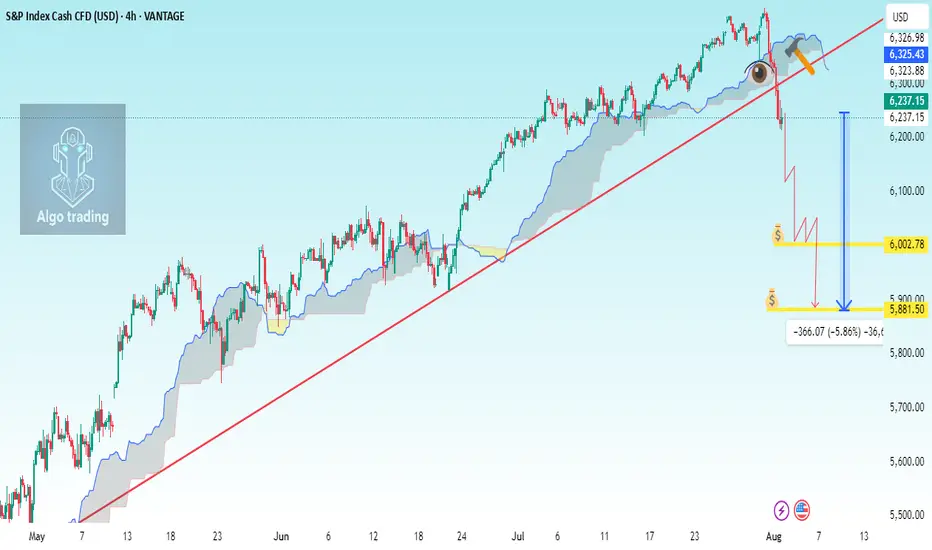
SP500 H4 analysis Breakdown TrendlineChart Components Observed:
Ichimoku Cloud: For trend and support/resistance visualization.
Uptrend line (manually drawn): Connecting higher lows since early May 2025.
Support break: Price has recently broken below the trendline and below the Ichimoku cloud.
Current Price: 6,237.15 (▼ -1.64%)
---
📉 Analysis Summary:
The trendline and Ichimoku cloud were acting as major dynamic support.
A bearish breakdown has occurred — price closed below the trendline and the cloud.
This suggests a potential trend reversal or correction underway.
---
🎯 Trade Setup Suggestion (Short Entry)
🟢 Entry Target (Short Position):
Sell Entry: Around 6,237 – 6,245 (current zone or slight pullback)
If price retests the underside of the broken trendline/cloud, that's a better entry confirmation.
📉 Take Profit Levels:
1. TP1: 6,130 (recent consolidation zone)
2. TP2: 6,000 (psychological + historical support)
3. TP3: 5,880 (next major support based on previous consolidation in early June)
🛡 Stop Loss:
SL: 6,300 – 6,310 (above the cloud and broken trendline for safe buffer)
---
📊 Risk Management:
Position size should be based on your account size, using 1–2% risk per trade.
Watch the S&P futures and macro news (e.g., U.S. data, Fed news) to avoid whipsaw.
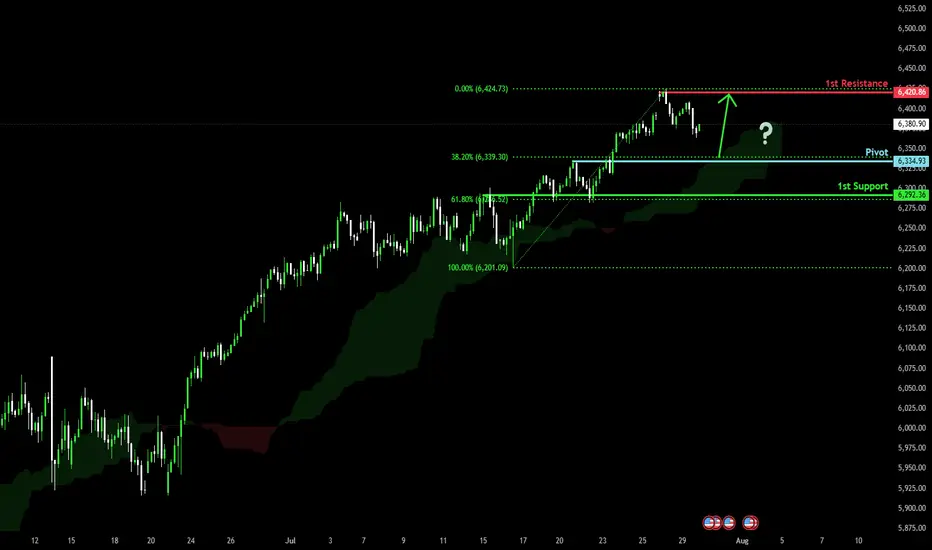
Bullish continuation?S&P500 is falling towards the pivot and could bounce to the swing high resistance.
Pivot: 6,334.93
1st Support: 6,292.36
1st Resistance: 6,420.86
Risk Warning:
Trading Forex and CFDs carries a high level of risk to your capital and you should only trade with money you can afford to lose. Trading Forex and CFDs may not be suitable for all investors, so please ensure that you fully understand the risks involved and seek independent advice if necessary.
Disclaimer:
The above opinions given constitute general market commentary, and do not constitute the opinion or advice of IC Markets or any form of personal or investment advice.
Any opinions, news, research, analyses, prices, other information, or links to third-party sites contained on this website are provided on an "as-is" basis, are intended only to be informative, is not an advice nor a recommendation, nor research, or a record of our trading prices, or an offer of, or solicitation for a transaction in any financial instrument and thus should not be treated as such. The information provided does not involve any specific investment objectives, financial situation and needs of any specific person who may receive it. Please be aware, that past performance is not a reliable indicator of future performance and/or results. Past Performance or Forward-looking scenarios based upon the reasonable beliefs of the third-party provider are not a guarantee of future performance. Actual results may differ materially from those anticipated in forward-looking or past performance statements. IC Markets makes no representation or warranty and assumes no liability as to the accuracy or completeness of the information provided, nor any loss arising from any investment based on a recommendation, forecast or any information supplied by any third-party.
S&P Correction Window is official - VOLATILITY AHEADIt's that time of year where the pre-summer push wraps and the summer lull and potential
pause gets underway.
July 31 finished on a bit of a sour note with over 67% of stocks declining today and US indexes finishing RED despite the big gaps and bullish pops on MSFT and META post earnings.f
SPX Key Levels
-watch the 21 day moving average
-watch the 50 day moving average
-more dynamic support in the 100/144/200 moving average cluster
I'll be taking bites at the 5/10/15% correction levels with options and looking for this dip
to be bought by retail and institutions.
Will August 1 US Tariff Deadline matter? After Japan and Eurozone came in and said a deal is being done, I was thinking this would be a dud. BUT, Dr. Copper says "maybe" on the global
tariff deadline with the largest single day move in history (bearish). Being the perfect time of year for a correction (the other being Feb-Apr), and the technicals looking so clean for an
orderly pullback, VIX may float higher and make things more interesting in the next 30-60 days.
Strategies matter, I'll be trading risk defined, but there are great opportunities ahead. A pullback is sure better than literally watching all-time highs every single day.
Thanks for watching!!!

SPY Pull back into another earnings week?An engulfing weekly candle is no joke. Sellers are in control.
There is a strong possibility of a pull back and with bias being short, I am looking for a strong LH on the 1/2HR TF to form at 6330 as 50% or 6370- 6375 near the weekly POC.
Confluences for Pull back scenario
- Price bounced off 38.2% fib from 5930 to ATH
- Price found support at 200 ema on 4HR
- 1 HR MACD is building up bullish signal
Have a great week all!

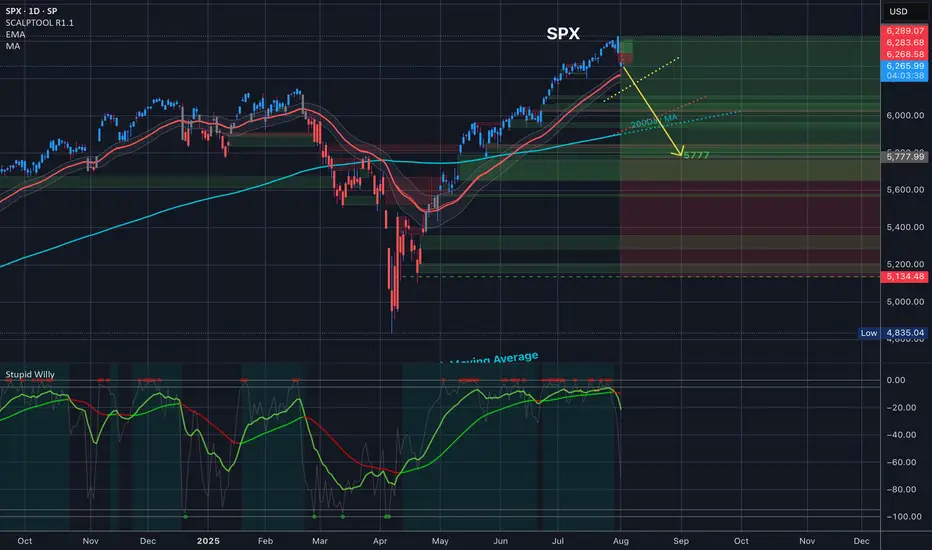
$SPY $SPX 5777 Target for end of AugustAMEX:SPY SP:SPX 5777 Target for end of August
What do you guys think here?
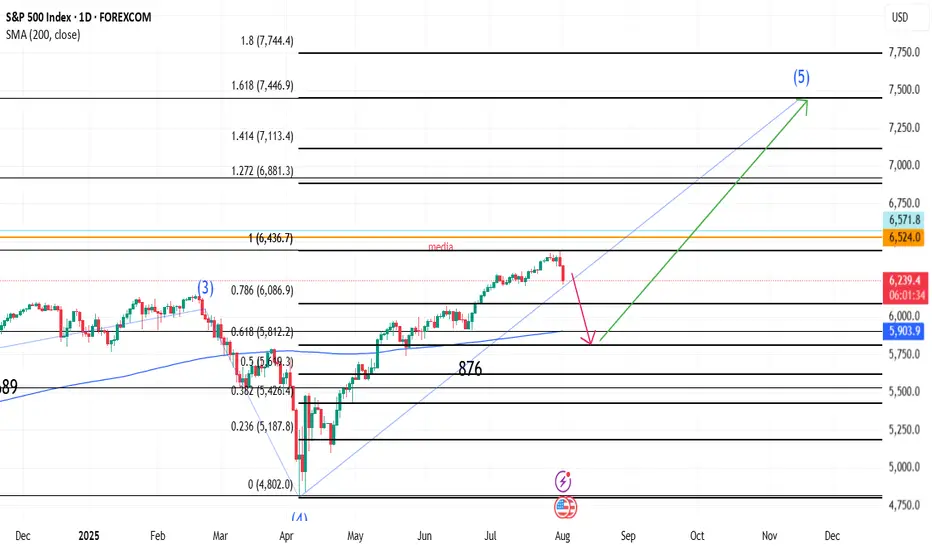
SPX correction to 5800 then 7445In my view current correction could stop in 5800 area where bullish trend could resume to target 7445 area in November