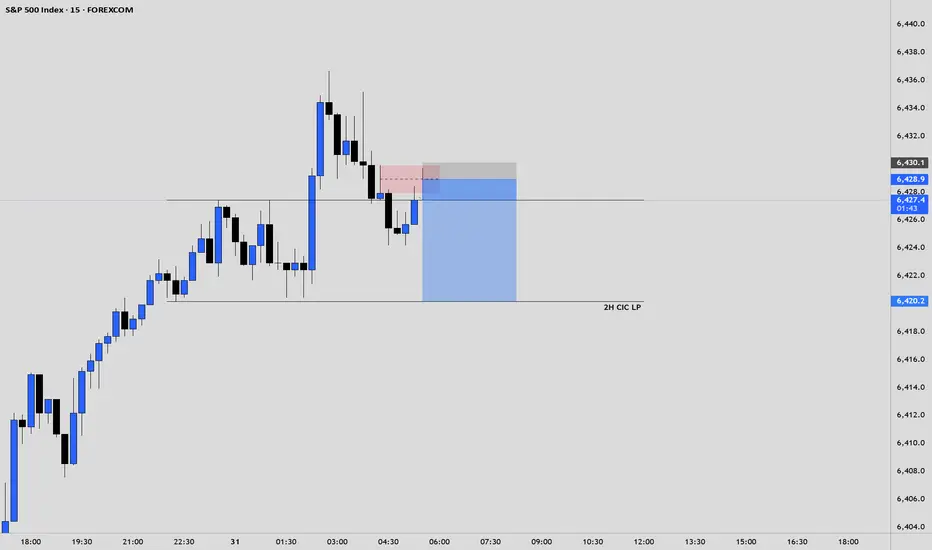
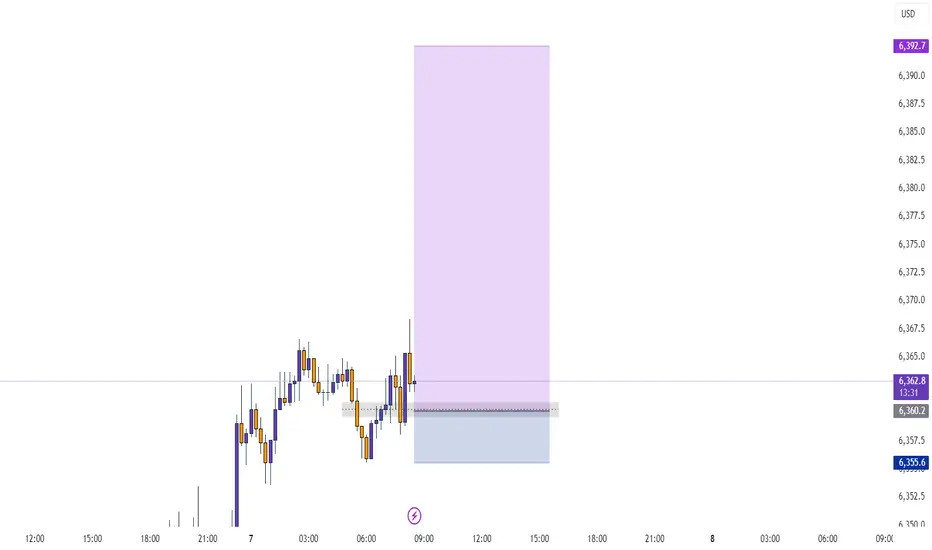
SPX ShortElite Analysis
Trade took previous high.
Market gave me a 30m BOS
Identified internal LP
Received confirmation on the 10m and 1m.
Executed off the 1m.
Targets lower LP's
USA500 trade ideas
29-07-2025This chart contains my analysis and key observations for today's trading session. All drawings and indicators reflect my current view of the market as of today. The purpose of this publication is to keep a record of my analysis and review it later for learning and improvement. No investment advice is provided.

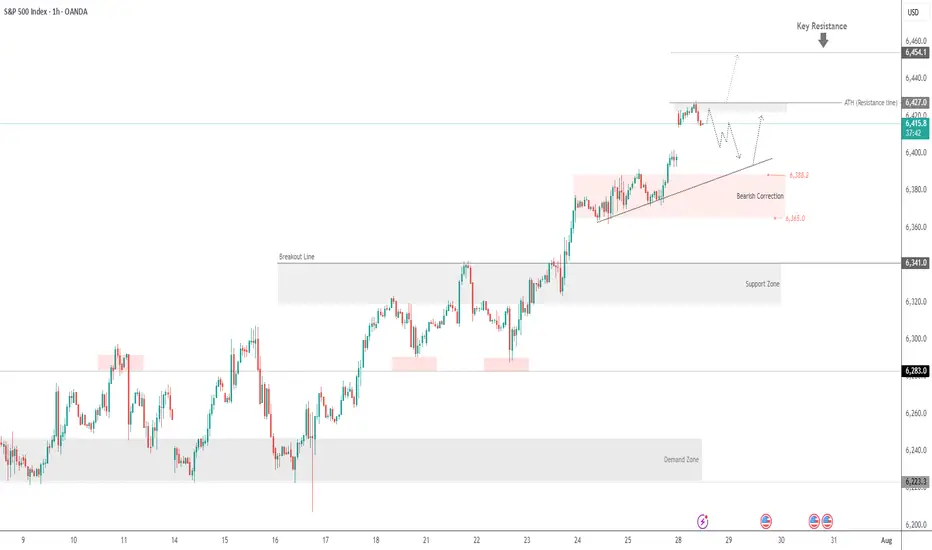
SPX500 Awaits Fed – Key Support at 6388 in FocusSPX500 Awaits Fed Decision – Breakdown Below 6365 Could Deepen Correction
Following the registration of a new all-time high at the beginning of the week, the price has started to decline. Also, investors await the Federal Reserve's policy statement later today for guidance on the future path of monetary policy.
The price is currently positioned below the 6388 level, which is a key zone in conjunction with the support line at 6365. This area signals the potential for a new downward correction if the price stabilizes below 6365.
A sustained move below 6365, confirmed by a 1H or 4H candle close, would open the door to a sharper decline toward 6341, followed by 6319, both considered critical support zones.
As for the bullish scenario: if the price finds support and manages to rebound today, the first step toward recovery would be a breakout above 6388, which may lead to a climb toward 6415. Breaking above 6415 would pave the way to retest the resistance zone at 6427, with the potential to reach a new all-time high at 6454.
Key Levels
• Support: 6365 - 6341 - 6319.
• Resistance: 6388 - 6415 - 6427.

S&P 500 as expensive as at the end of 2021 in valuation terms !Two weeks ago, I shared a technical analysis of the S&P 500 across all timeframes. This analysis outlines price targets for the end of 2025 based on technical and fundamental criteria. You can revisit this analysis by clicking the first chart below.
WARNING: A major bullish target I previously mentioned is close to being reached—6,475 points on the S&P 500 futures contract. The market may soon enter a consolidation phase.
Given this week's packed fundamentals, it's wise to start locking in your gains by moving up your stop-loss levels—especially as the S&P 500 has now returned to its end-2021 valuation peak.
Click on the table below to access details on this week's significant fundamental developments:
1. Caution: The S&P 500 has reached its end-2021 valuation record!
While technical market analysis is important, valuation metrics are even more so. The S&P 500 has just reached its previous valuation peak from the end of 2021—historically the starting point of the 2022 bear market. While the current macro context is different, this level could trigger a short-term market pause.
Chart showing S&P 500 valuation via the CAPE Ratio (Shiller PE):
2. S&P 500 seasonality is weaker in August and bearish in September
Another cautionary factor is seasonality. A statistical look at average S&P 500 performance by month highlights a weaker period in August and a typically negative one in September.
In summary, technical, fundamental, and seasonal analysis all point to securing gains as we approach August/September—without questioning the underlying long-term uptrend.
Chart showing S&P 500 seasonality since 1960:
DISCLAIMER:
This content is intended for individuals who are familiar with financial markets and instruments and is for information purposes only. The presented idea (including market commentary, market data and observations) is not a work product of any research department of Swissquote or its affiliates. This material is intended to highlight market action and does not constitute investment, legal or tax advice. If you are a retail investor or lack experience in trading complex financial products, it is advisable to seek professional advice from licensed advisor before making any financial decisions.
This content is not intended to manipulate the market or encourage any specific financial behavior.
Swissquote makes no representation or warranty as to the quality, completeness, accuracy, comprehensiveness or non-infringement of such content. The views expressed are those of the consultant and are provided for educational purposes only. Any information provided relating to a product or market should not be construed as recommending an investment strategy or transaction. Past performance is not a guarantee of future results.
Swissquote and its employees and representatives shall in no event be held liable for any damages or losses arising directly or indirectly from decisions made on the basis of this content.
The use of any third-party brands or trademarks is for information only and does not imply endorsement by Swissquote, or that the trademark owner has authorised Swissquote to promote its products or services.
Swissquote is the marketing brand for the activities of Swissquote Bank Ltd (Switzerland) regulated by FINMA, Swissquote Capital Markets Limited regulated by CySEC (Cyprus), Swissquote Bank Europe SA (Luxembourg) regulated by the CSSF, Swissquote Ltd (UK) regulated by the FCA, Swissquote Financial Services (Malta) Ltd regulated by the Malta Financial Services Authority, Swissquote MEA Ltd. (UAE) regulated by the Dubai Financial Services Authority, Swissquote Pte Ltd (Singapore) regulated by the Monetary Authority of Singapore, Swissquote Asia Limited (Hong Kong) licensed by the Hong Kong Securities and Futures Commission (SFC) and Swissquote South Africa (Pty) Ltd supervised by the FSCA.
Products and services of Swissquote are only intended for those permitted to receive them under local law.
All investments carry a degree of risk. The risk of loss in trading or holding financial instruments can be substantial. The value of financial instruments, including but not limited to stocks, bonds, cryptocurrencies, and other assets, can fluctuate both upwards and downwards. There is a significant risk of financial loss when buying, selling, holding, staking, or investing in these instruments. SQBE makes no recommendations regarding any specific investment, transaction, or the use of any particular investment strategy.
CFDs are complex instruments and come with a high risk of losing money rapidly due to leverage. The vast majority of retail client accounts suffer capital losses when trading in CFDs. You should consider whether you understand how CFDs work and whether you can afford to take the high risk of losing your money.
Digital Assets are unregulated in most countries and consumer protection rules may not apply. As highly volatile speculative investments, Digital Assets are not suitable for investors without a high-risk tolerance. Make sure you understand each Digital Asset before you trade.
Cryptocurrencies are not considered legal tender in some jurisdictions and are subject to regulatory uncertainties.
The use of Internet-based systems can involve high risks, including, but not limited to, fraud, cyber-attacks, network and communication failures, as well as identity theft and phishing attacks related to crypto-assets.

US 500 – Potentially A Pivotal Week Ahead The US 500 index registered a new record closing high on Friday at 6396 continuing a bullish trend that has yet to show many signs of faltering. The Monday open has seen this move extend as traders digest the positive news flow from the weekend that a US/EU trade deal has been agreed after President Trump and EU Commission head Ursula Von der Leyen, met in Scotland on Sunday. This has seen the US 500 index rally another 0.4% to a new high of 6429 (0730 BST).
However, the week ahead could be a pivotal one for the direction of US stock indices over the remainder of the summer, and in this regard, it is perhaps surprising that market volatility measures, such as the VIX (fear Index), are back to their lowest levels since late March, indicating limited trader concern for what lies ahead. Although, things can change very quickly.
In many ways the week ahead is one that has it all, including a new round of US/China trade talks which start today, a Federal Reserve (Fed) rate decision, key tech earnings, tier 1 US data releases and on-going trade/tariff discussions. More than enough to ensure there is the potential for US 500 price action to become increasingly volatile as the week progresses.
Looking forward, Wednesday could be a very busy day, with the Fed Interest Rate Decision released at 1900 BST and quickly followed at 1930 BST by the press conference led by Chairman Powell, who has been under intense political pressure in the last 10 days. While the Fed are expected to keep rates unchanged, traders may be interested to see which policymakers were keen to vote for a cut, as well as whether Chairman Powell’s comments indicate a September rate reduction may be more likely than currently anticipated.
Then, later Wednesday evening Microsoft, Qualcomm and Meta release their earnings updates after the close, with Amazon and Apple’s results due after the market close on Thursday. These releases could be crucial for sentiment towards the US 500, with particular focus being paid to what these companies say about future revenue and tariff issues, as well as the specific performance of AI and cloud services.
This only takes us to the middle of the week, which is where the tier 1 US economic data releases take over, with the PCE Index, the Fed’s preferred gauge of inflation, due on Thursday at 1330 BST, and then the all-important Non-farm Payrolls update on the current health of the US labour market released on Friday at 1330 BST. US 500 index traders may well be sensitive to the outcome of both of these prints.
That’s still not all. Friday’s US employment update coincides with President Trump’s tariff deadline which could add to US 500 volatility into the weekend.
Wow, I did say it’s a week that has it all!
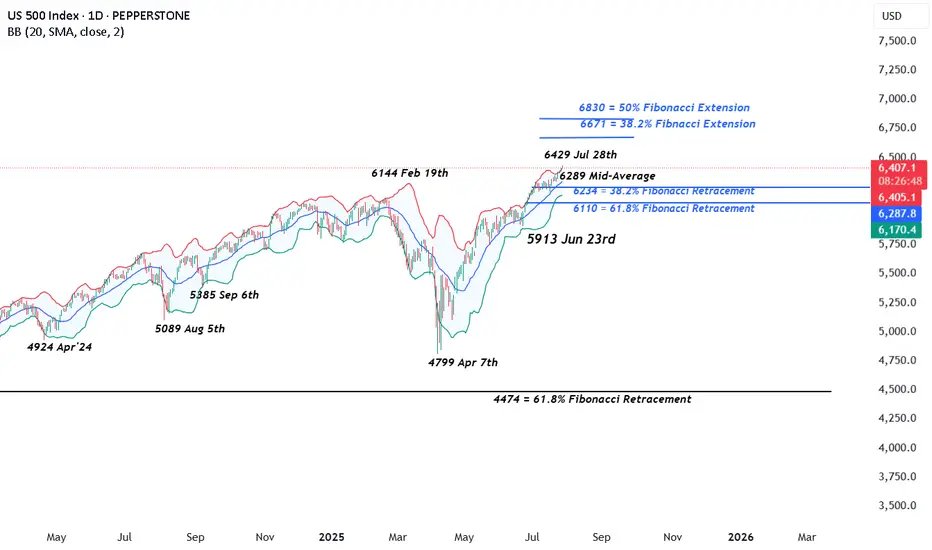
Technical Update: New All-Time Highs Posted Again
It looks as if the latest US 500 index activity is maintaining the current positive trending themes after another all-time high was posted this morning at 6429. This could skew risks towards the further development of the pattern of higher price highs and higher price lows that has materialised since the April 7th downside extreme at 4799 was seen.
However, it must be remembered, these moves do not guarantee this price activity will continue, so traders may find it useful to assess the possible support and resistance levels that could influence price activity moving forward across what is set to be a very busy week of events.
Possible Support Levels:
If any US 500 price weakness does materialise across the week ahead with the potential to develop into a more extended phase of declines, a support level that traders may consider worth monitoring could be 6289.
6289 is equal to the current level of the rising Bollinger mid-average. Closing breaks below 6289 might suggest a more extended phase of weakness is possible, opening the potential for moves back to 6234, which is the 38.2% Fibonacci retracement, possibly further if this level in turn gives way.
Possible Resistance Levels:
Having been capped by the 6429 all-time high this morning, sellers may continue to be found at this level, so this might prove to be the first potential resistance if fresh attempts at price strength develop over the coming week.
It may be helpful for traders to watch how this 6429 level is defended on a closing basis, as successful closing breaks might suggest a further extension of the uptrend pattern currently evident in price activity.
Such closing breaks higher may well suggest price strength towards 6671, which is the 38.2% Fibonacci extension level of the February 19th to April 7th sell-off.
The material provided here has not been prepared accordance with legal requirements designed to promote the independence of investment research and as such is considered to be a marketing communication. Whilst it is not subject to any prohibition on dealing ahead of the dissemination of investment research, we will not seek to take any advantage before providing it to our clients.
Pepperstone doesn’t represent that the material provided here is accurate, current or complete, and therefore shouldn’t be relied upon as such. The information, whether from a third party or not, isn’t to be considered as a recommendation; or an offer to buy or sell; or the solicitation of an offer to buy or sell any security, financial product or instrument; or to participate in any particular trading strategy. It does not take into account readers’ financial situation or investment objectives. We advise any readers of this content to seek their own advice. Without the approval of Pepperstone, reproduction or redistribution of this information isn’t permitted.
SPX preparing to sweep liquidity around the 6200 level.Based on my analysis, the #SPX has printed a reversal engulfing candle, which could lead to a period of consolidation. The most probable target appears to be the liquidity pool around the 6200 level.
However, this outlook becomes invalid if the daily candle closes above 6410—the current (today) session high.
As always, conduct your due diligence. Technical analysis offers a probabilistic perspective, not certainty.

SPX500 Correction Before Rally? Key Levels in FocusSPX500 Correction Before Rally? Key Levels in FocusSPX500 OVERVIEW
Fundamental Context:
The U.S. and EU have averted a tariff standoff. The agreement reduces the baseline tariff on most European imports to 15%, down from the previously threatened 30% by the Trump administration. In return, the EU has committed to investing approximately $600 billion in the U.S.
Additionally, U.S.–China trade talks are ongoing in Stockholm, with reports suggesting a possible 90-day extension to the tariff deadline.
Technical Outlook:
SPX500 maintains a bullish bias due to easing trade tensions. However, as long as the price trades below 6421, a short-term correction toward 6397 and 6388 is likely. A rebound is expected if the price stabilizes above 6388.
🔺 Bullish Continuation will be confirmed if a 1H candle closes above 6427, potentially targeting 6454 and 6470.
Key Levels
• Support: 6397 – 6388 – 6365
• Resistance: 6454 – 6470
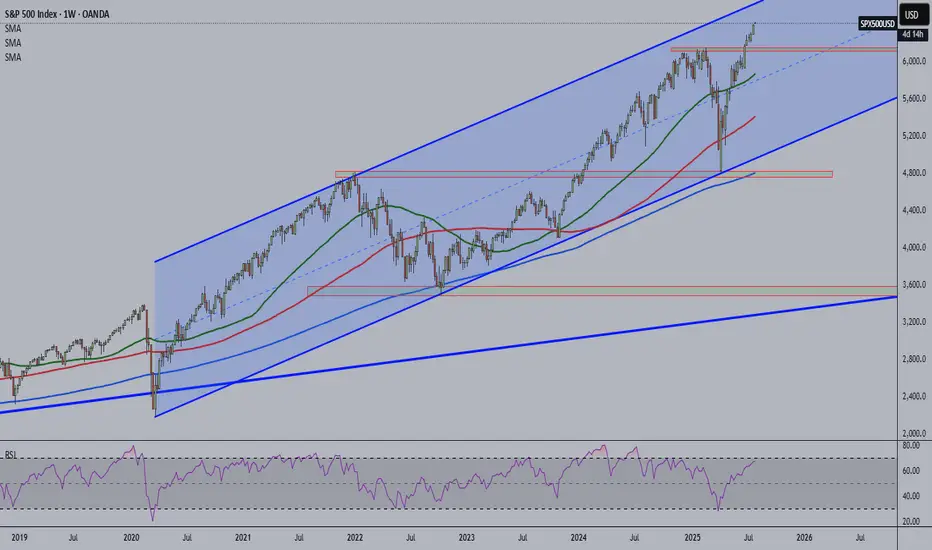
Overbought alert? The S&P500 is nearing weekly and monthly bullish channel resistance. Price has remained within this channel since 2020.
PEPPERSTONE:US500 VANTAGE:SP500
S&P500 INDEX (US500): Classic Gap Opening TradeI noticed a classic gap up opening on 📉US500 Index and believe it will be filled today.
The formation of an intraday bearish change of character (CHoCH) on the hourly chart indicates a strong likelihood of continued bearish movement.
Target - 6400.

No FOMOSPY does its thing and will keep moving higher but cautious on low volume push.
To keep it simple, if there is a daily close back inside the master trendline sometime this week, a short setup will be adequate to the previous all time high @ 6095

The Golden Age 7000 EOY SPXThe Golden Age (year) is here!
Have cash ready for May in April. Be heavy hedges going in to 26.
We're going to juice earnings with all the investments pouring in for just about every single industry. Once the injection is complete, we will reset while all the invested money completes projects.
GL!
Better Buy Bitcoin

SPX500 TECHNICAL ANALYSISSPX500 has broken above the recent range, reclaiming the 6,351.41 resistance. Price is now pushing into the 6,380.00 zone, with buyers showing control after a strong recovery from the 6,222.46 low.
Support at: 6,351.41 🔽 | 6,324.08 | 6,296.93
Resistance at: 6,380.00 🔼 | 6,409.21 | 6,438.44
🔎 Bias:
🔼 Bullish: Sustained trading above 6,351.41 opens the door toward 6,409.21 and higher.
🔽 Bearish: A close back below 6,351.41 may trigger a retest of 6,324.08 and 6,296.93.
📛 Disclaimer: This is not financial advice. Trade at your own risk.

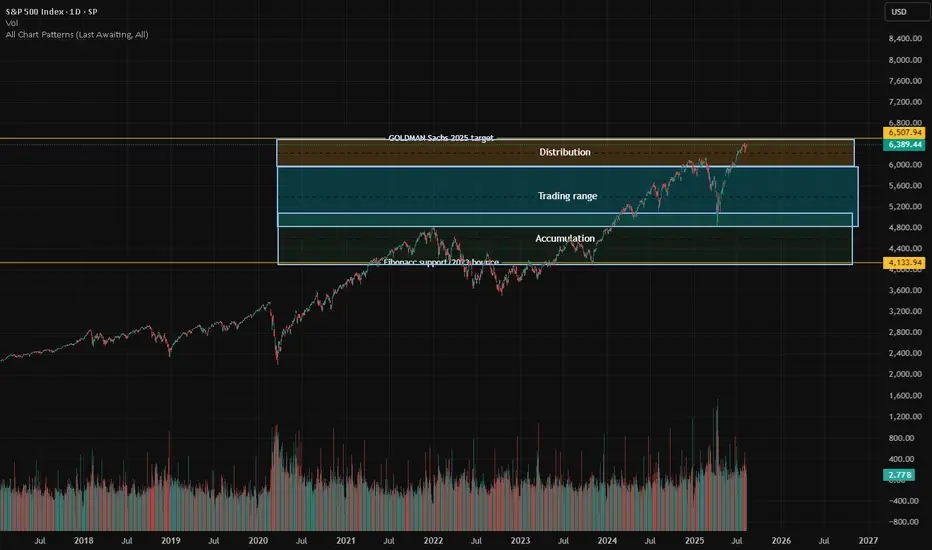
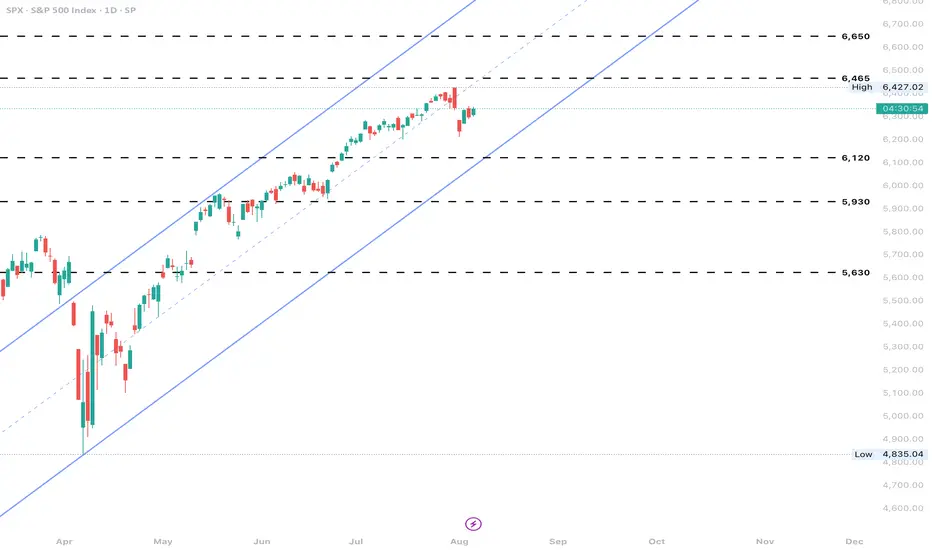
S&P Fibonacci based Accumulation/Distribution rangesFibonacci-Based Zones: The chart is structured around support and resistance zones derived from Fibonacci analysis, providing natural levels for market reaction.
Accumulation Zone: Lower price area (~4,133.94 and above) where buyers show interest and trend reversal is often seeded.
Trading Range: The broad mid-section where price is expected to oscillate, indicating indecision or equilibrium among buyers and sellers.
Distribution Zone: Upper price band near the Goldman Sachs 2025 target, as marked, where profit-taking and seller interest increases.
Potential for Parabolic Move: If price decisively breaks out above the distribution/resistance zone, it could trigger rapid, euphoric buying—a classic market melt-up.
Risk of Downside: Falling below the key Fibonacci support level could prompt a sharp correction,.
Historical Validation: Past price movements respect these zones.
Bulls and Bears zone for 08-08-2025ETH session has rallied to 61.8 Fibonacci level of yesterday's RTH session. Any test of ETH session High could provide direction for the day.
Level to watch: 6384 --- 6386
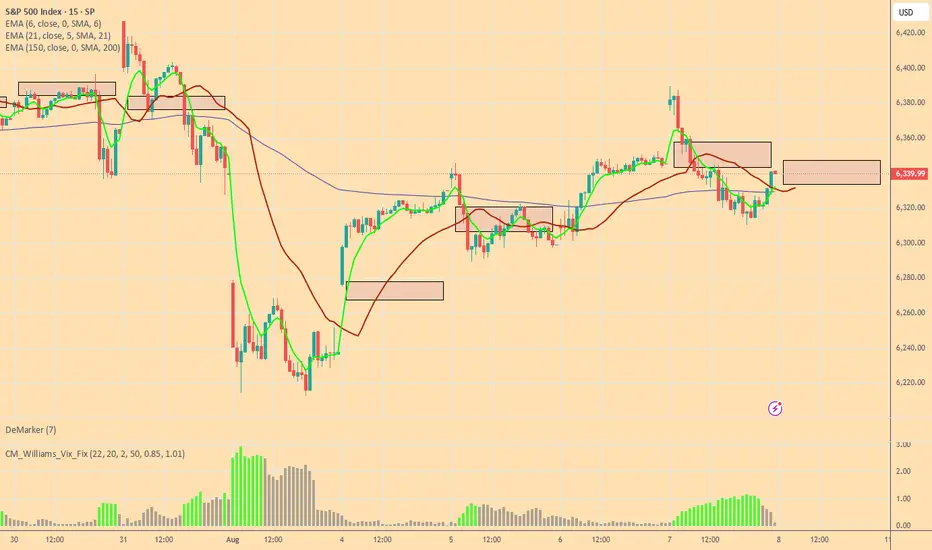
This V-Pattern on SPX500 Is Stupid CleanHey, it’s Skeptic.
In this video, I’m breaking down a clean V-pattern setup on SPX500 — right in line with what I taught in yesterday’s educational post.
We’re starting from the Daily time frame and walking through the logic behind my long trigger, why the previous fakeout was actually useful, and how to set your stop-loss depending on your trading style (H4 vs 15min).
This isn’t just chart talk — it’s about reading the story behind the candles.
If it helped you see things clearer, give it a boost and drop your thoughts below.
Let’s keep learning — one trap at a time.
Until next time, peace out.
📌 Disclaimer: This video is for educational purposes only and does not constitute financial advice. Always do your own research and manage your risk.

S&P bullish continuation supported at 6340Tariff Turmoil and Geopolitical Shifts – Implications for S&P 500 Trading
Donald Trump's sweeping new tariffs officially took effect, hitting nearly all U.S. trading partners. Switzerland, facing the steepest rates among developed nations, may retaliate by cancelling a major fighter jet purchase, signaling potential defense-sector implications.
Key developments:
Semiconductor imports to face 100% tariffs, unless production is moved onshore – a bullish signal for domestic chipmakers (e.g., Intel, GlobalFoundries) but negative for firms reliant on overseas fabs.
Additional tariffs floated on China over purchases of Russian oil, echoing similar penalties on India – suggesting growing fragmentation in global trade.
Market impact:
S&P 500 sectors likely affected:
Tech (Semis): Tariff pressure may weigh on multinationals like Nvidia or AMD short term, but benefit domestic fabs and U.S.-based supply chains.
Industrials/Defense: Swiss retaliation could ripple through defense contractors if deals are halted.
Energy/Commodities: Any China-Russia oil tensions could lead to energy volatility, affecting names like ExxonMobil or ConocoPhillips.
Meanwhile, China’s exports unexpectedly rose, softening the blow from the U.S. tariff crackdown. Chinese equity gains could calm broader EM sentiment, helping mitigate global risk-off contagion.
Finally, Trump signaled potential peace talks with Putin and Zelenskiy, with the Kremlin confirming a Putin meeting soon. A diplomatic breakthrough could ease geopolitical risk, supporting investor sentiment and equities globally.
Bottom Line for S&P 500:
Expect sector rotation as traders digest tariff fallout. Watch for:
Strength in domestically focused tech and defense stocks
Caution around globally exposed industrials and semis
Short-term volatility tied to trade rhetoric and geopolitical headlines
Key Support and Resistance Levels
Resistance Level 1: 6437
Resistance Level 2: 6480
Resistance Level 3: 6520
Support Level 1: 6340
Support Level 2: 6295
Support Level 3: 6256
This communication is for informational purposes only and should not be viewed as any form of recommendation as to a particular course of action or as investment advice. It is not intended as an offer or solicitation for the purchase or sale of any financial instrument or as an official confirmation of any transaction. Opinions, estimates and assumptions expressed herein are made as of the date of this communication and are subject to change without notice. This communication has been prepared based upon information, including market prices, data and other information, believed to be reliable; however, Trade Nation does not warrant its completeness or accuracy. All market prices and market data contained in or attached to this communication are indicative and subject to change without notice.

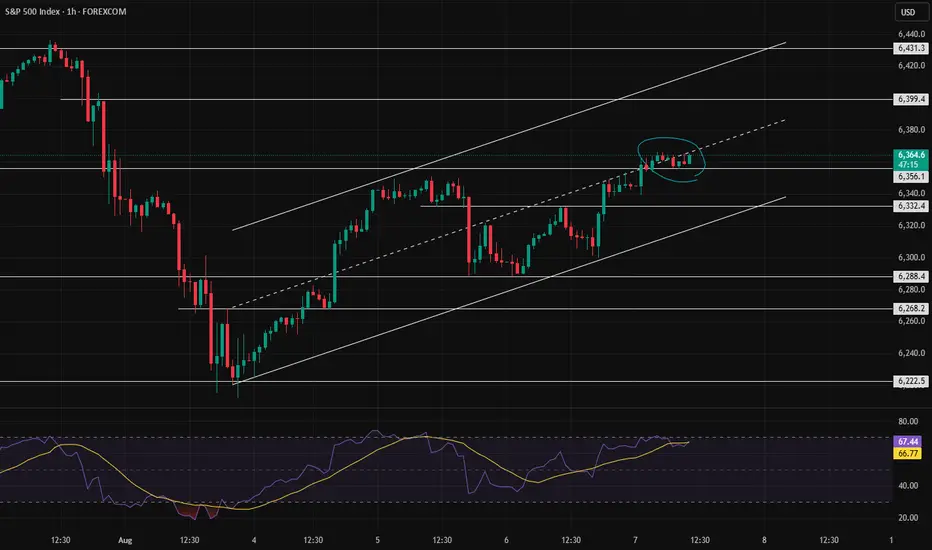
Decision pointThe weakness of the trend is clearly visible, but we need to see how it reacts to the channel’s midline. If buying pressure increases, the price could reach 6400. Otherwise, a correction down to around 6330 is likely.
US500 Market Insight US500 Market Insight
The US500 continues to demonstrate resilience amid a complex macroeconomic backdrop, trading around 6,388 at mid-session today. This represents a modest 0.40% recovery from the previous close of 6,299, signaling improving investor sentiment despite ongoing market headwinds.
Fundamental Outlook: Market Resilience Amid Volatility
After a stretch of choppy trading sessions driven by mixed U.S. economic data and escalating tariff concerns, the index has regained its footing above the psychologically important 6,300 support level. This bounce reflects investor confidence in the broader market’s fundamentals, particularly in the face of global policy uncertainties.
Strong Corporate Earnings as a Key Driver
Earnings season has delivered notable upside surprises, particularly in the technology, consumer discretionary, and financial sectors. Positive forward guidance and robust profit margins have underpinned the index’s strength, helping offset negative sentiment from trade related headlines and slowing global demand in select sectors.
Dovish Federal Reserve Expectations
Markets are increasingly pricing in a more accommodative stance from the Federal Reserve, even as policymakers continue to stress a data dependent approach. With inflation surprising on the upside and NFP data coming out softer, this is reinforcing expectations for possible rate cuts later in 2025. This has eased pressure on equities and boosted appetite for risk assets.
Technical Outlook: Bullish Continuation
From a technical perspective, the US500 remains in a well defined long-term uptrend. Maintaining price action above 6,300 strengthens the case for further gains, with 6,400–6,500 seen as the next potential resistance zone. Keep watching for consolidation above 6,300 to confirm breakout momentum.
Key Risks and Market Sensitivities
Despite the positive bias, risks remain. The index remains highly sensitive to global trade developments, particularly US-China and US-EU tariff disputes. In addition, any shift in Fed tone or unexpected inflation data could trigger renewed volatility.
Conclusion
The US500’s current recovery reflects a careful balance of strong earnings, improving rate outlook, and technical support. While bullish sentiment persists, the path forward will likely remain data driven and headline sensitive, requiring traders to remain nimble. A sustained break above 6,400 could open the door to new highs later this quarter, but near-term volatility should not be discounted.
Analysis by Terence Hove, Senior Financial Markets Strategist at Exness
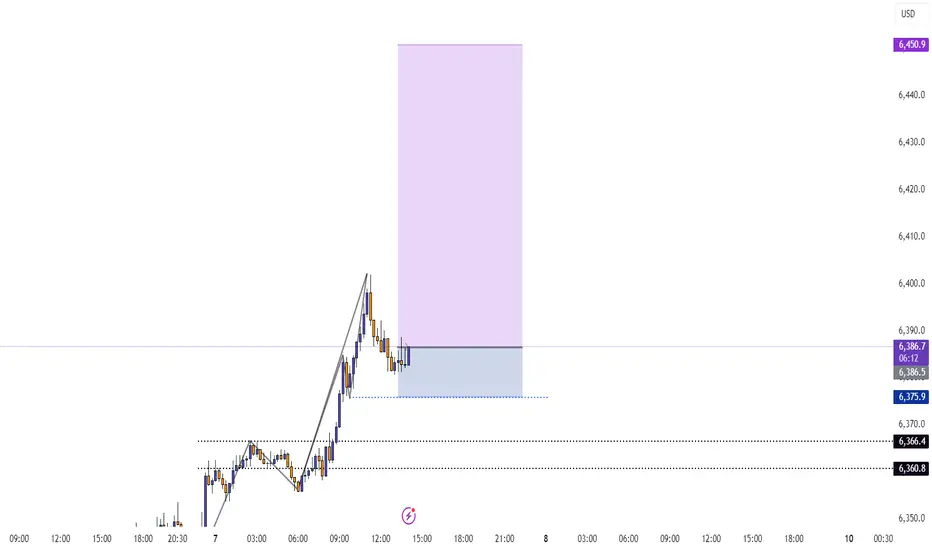
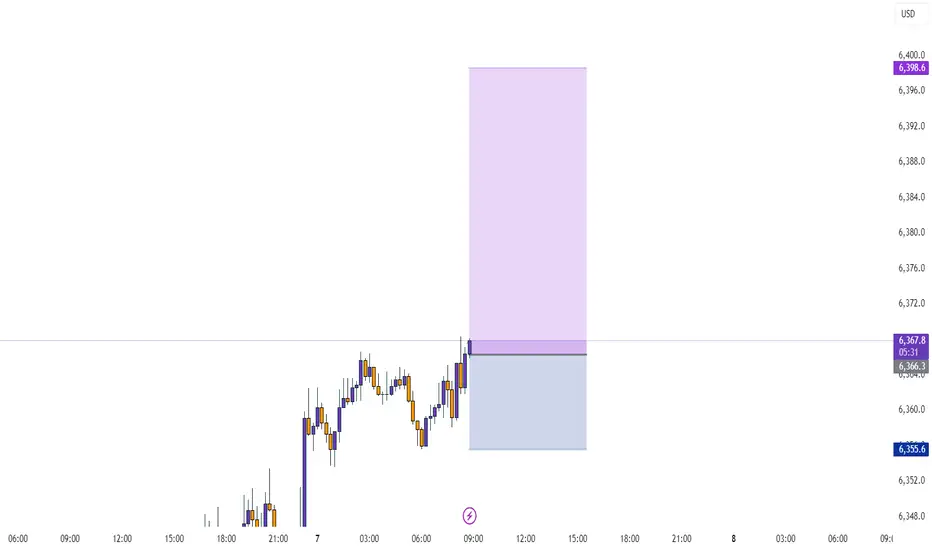
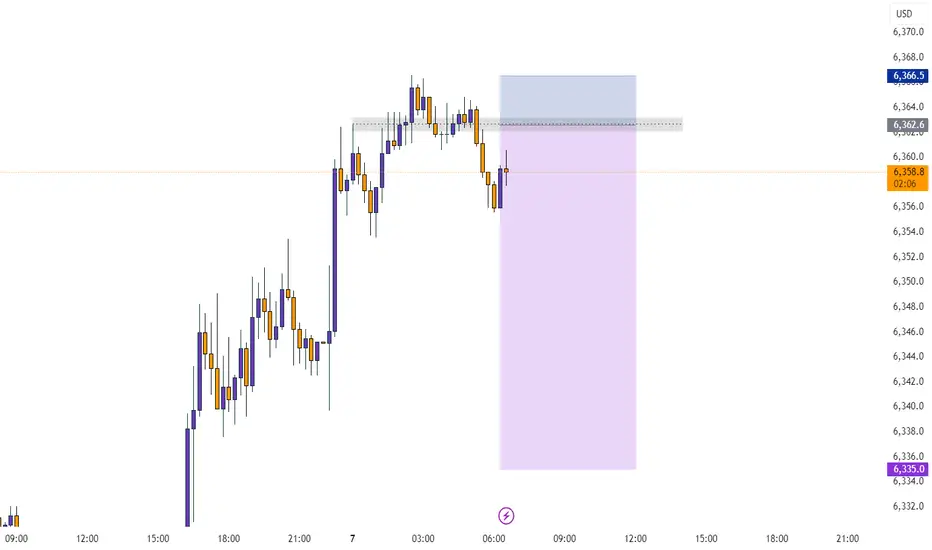
SPX BUY SPOT 8/61h had a unicorn setup I seen forming yesterday. Today I got on just after 7:30 am and saw price inside POI/IPA. All it did was WICK that gap, not fill it. I went against the 4h and 1h candles both being bearish because price reacted to the OPEN of the FVG. This makes it risky because we could still fill and sweep below that wick. Just had a little FOMO this morning once the reaction happened. No major news until tomorrow. I love the sweet spot where price is. Perfect HL area on 1 hour even tho we can sweep lower again, we shall see!
