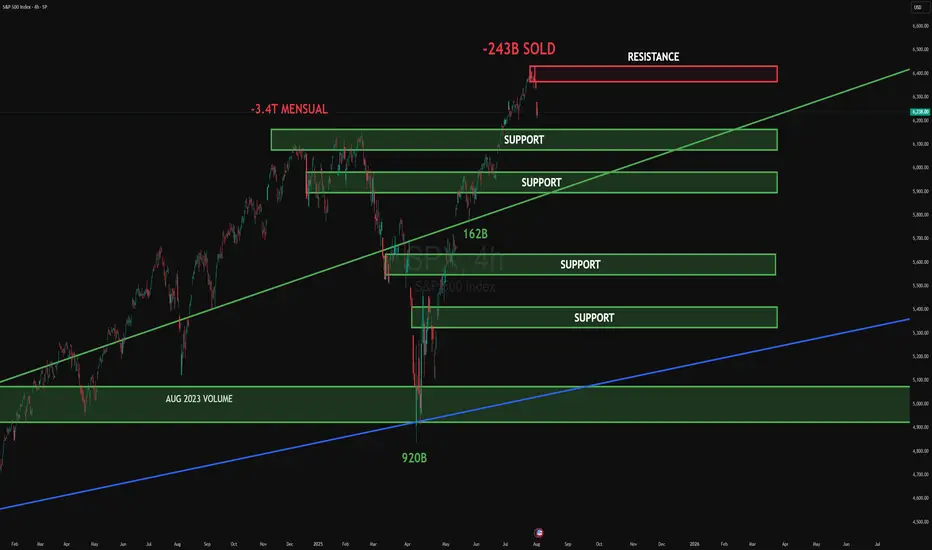
SPX CORRECTIONThe S&P 500 Index (SPX) faced strong rejection at the upper resistance zone near 6,400, where -243B was sold, signaling aggressive institutional distribution. This area aligns with the broader -3.4T monthly level, confirming it as a significant ceiling.
Multiple support levels lie below. The first key zone near 6,200 is being tested. If broken, deeper liquidity pockets are visible around 6,000 and 5,700, where 162B was previously absorbed. Further down, the high-volume August 2023 level near 5,000 remains a macro support with 920B of institutional activity.
Upside target (if reclaimed): 6,400
Downside target (if breakdown continues): 5,700 → 5,000
#SPX #globaltrade #investment #investing #stockmarket #wealth #realestate #markets #economy #finance #money #forex #trading #price #business #currency #blockchain #crypto #cryptocurrency #airdrop #btc #ethereum #ico #altcoin #cryptonews #Bitcoin #ipo
USA500 trade ideas
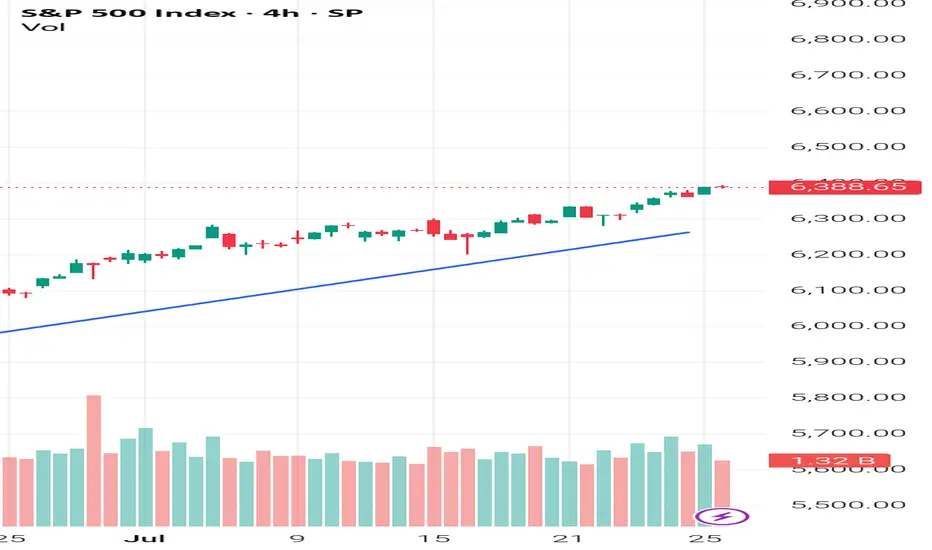
Bearish Engulfing on Risk. Average quarterly downside since 2023 open is 4.07%. Is a retest of near the yearly open on order over the month of August? Markets are no longer pricing in a Fed rate cut in September. Will that be the near term bearish fuel?

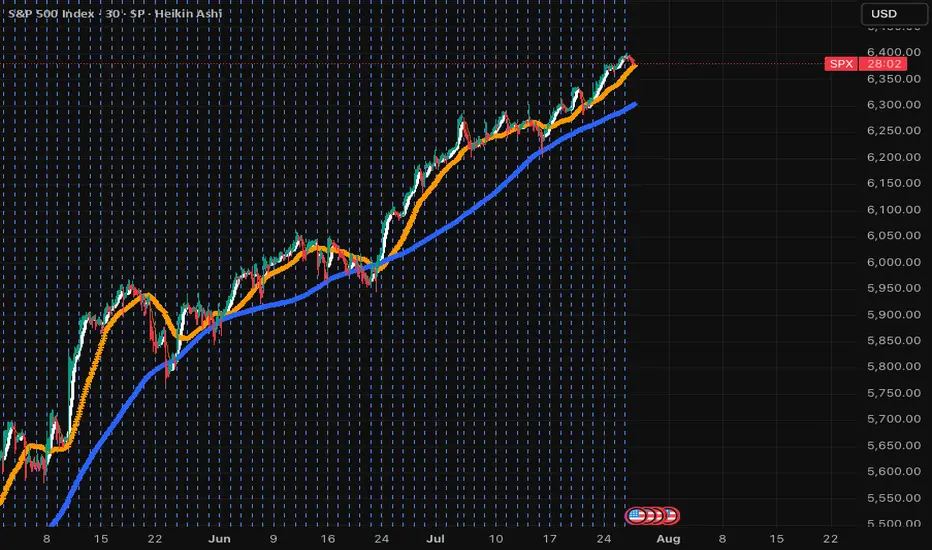
SPX500 NEARING AN IMPORTANT FIB. EXTENSION RESISTANCEIn this weekend's analysis I find the SPX500 to remain BULLISH for next few days as we have strong closings outside the upper KC band and also touching the upper Bollinger band on the higher time frames from Daily to Monthly charts. It's also important to note that declining volume bars is NOT supporting the monthly rally, while MACD, RSI divergences are also sounding warning sirens that it's near a major correction territory which I have measure as the fib extension 0.618 from the October, 2022 base or support on the monthly chart. As signaled last week that we could be getting a capitulation candle soon to the fib target. Once we get a reversal candle on the 4 Hours it will confirm that the intermediate tops is achieved on the SPX500 and a correction is highly probable. So our trade thesis is Bullish until we get a confirmed bearish signal on either the 4H or 1D timeframe with Stop loss at 6377 level. Thanks for visiting my publication and trade idea on the SPX500. Cheers and happy trading to everyone.

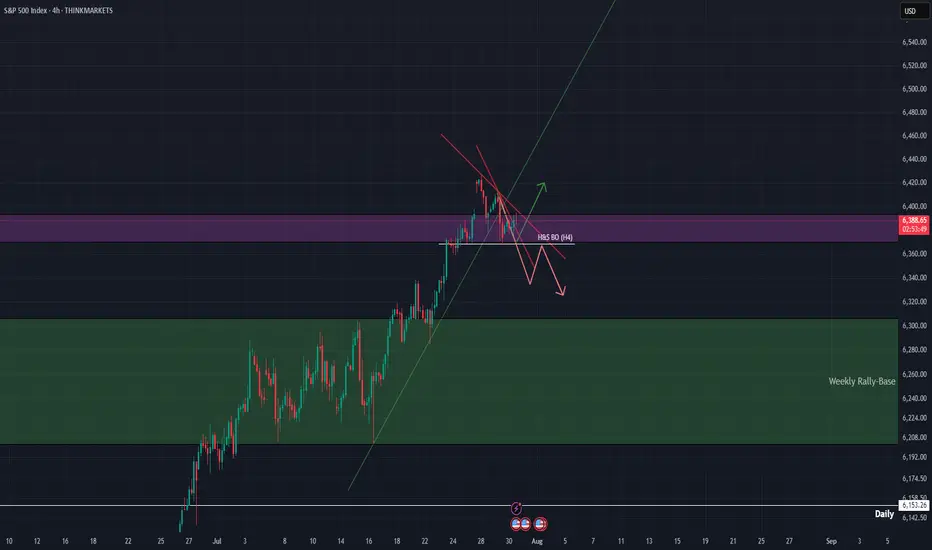
SPX500 AnalysisThis analysis is based on the 4-Hour timeframe, reversal trading, and trend formation.
If the price breaks below the white line (H&S breakout point) and closes, then my H&S pattern is complete, and I will short on its retest. I will post updates about this trade soon!

SPX500 Buy analysis/ideaThis trade is based on the 4-hour chart and executed using reversal trading, trend formation and an update on the analysis I posted on this instrument yesterday.
Complete explanation in the video!

S&P500 uptrend pause supported at 6355The S&P 500 slipped -0.12% after initially rising +0.3%, as Fed Chair Powell’s cautious “wait-and-see” stance on rate cuts dampened sentiment. The metals and mining sector dragged the index lower, falling nearly -4% after the U.S. announced surprise copper tariff details—excluding refined metal until 2027—leading to a sharp -20% drop in COMEX copper futures.
However, market sentiment rebounded overnight, driven by strong tech earnings. Meta surged +11.5% post-market on upbeat Q3 guidance and rising AI-driven ad revenues, while Microsoft rose over +8% thanks to better-than-expected Azure cloud growth and a $30 billion AI infrastructure investment.
Conclusion:
Despite short-term pressure from the Fed’s tone and commodity weakness, strong AI-driven earnings from major tech firms are likely to support a positive bias for the S&P 500 in the near term, especially in the tech-heavy growth segments. Broader gains may depend on upcoming inflation data and Fed clarity.
Key Support and Resistance Levels
Resistance Level 1: 6470
Resistance Level 2: 6500
Resistance Level 3: 6545
Support Level 1: 6355
Support Level 2: 6315
Support Level 3: 6282
This communication is for informational purposes only and should not be viewed as any form of recommendation as to a particular course of action or as investment advice. It is not intended as an offer or solicitation for the purchase or sale of any financial instrument or as an official confirmation of any transaction. Opinions, estimates and assumptions expressed herein are made as of the date of this communication and are subject to change without notice. This communication has been prepared based upon information, including market prices, data and other information, believed to be reliable; however, Trade Nation does not warrant its completeness or accuracy. All market prices and market data contained in or attached to this communication are indicative and subject to change without notice.
FOMC rate decision 30-07-2025FOMC announced no change to interest rate, but the new tariffs is the major player for the upcoming quarter, we shall see its effect on the economy and corporates earnings soon, then the fed can make better judgment whether to lower interest rate or not.
Disclaimer: This content is NOT a financial advise, it is for educational purpose only.

S&P Market Update – Signs of a Short-Term Correction?Although the S&P remains in an uptrend, recent price action suggests that momentum may be fading.
📉 Key Observations:
A Key Day Reversal occurred at 6409 – a potential warning signal.
We're seeing RSI divergence: price made a new high, but RSI didn’t follow suit.
The market is grinding higher, but without conviction.
📊 What to Watch:
The 15-day EMA, currently at 6317, is acting as near-term support. A close below this level could trigger a short-term correction.
Initial downside targets: 6147–6100, the previous highs from late 2024 and early 2025.
✅ To negate this bearish bias, the market would need to break above 6409 and continue higher with stronger momentum.
Stay alert — the technicals are flashing red flags. Always manage risk accordingly.
Disclaimer:
The information posted on Trading View is for informative purposes and is not intended to constitute advice in any form, including but not limited to investment, accounting, tax, legal or regulatory advice. The information therefore has no regard to the specific investment objectives, financial situation or particular needs of any specific recipient. Opinions expressed are our current opinions as of the date appearing on Trading View only. All illustrations, forecasts or hypothetical data are for illustrative purposes only. The Society of Technical Analysts Ltd does not make representation that the information provided is appropriate for use in all jurisdictions or by all Investors or other potential Investors. Parties are therefore responsible for compliance with applicable local laws and regulations. The Society of Technical Analysts will not be held liable for any loss or damage resulting directly or indirectly from the use of any information on this site.

SPX500USD | Retesting All-Time HighsThe index has extended its bullish rally, printing a new local high at 6,286.5 before showing signs of slight hesitation with consecutive small-bodied candles.
Support at: 6,134.5 / 6,026.0 / 5,926.2 🔽
Resistance at: 6,286.5 🔼
🔎 Bias:
🔼 Bullish: Sustains above 6,134.5 and breaks 6,286.5 for new highs.
🔽 Bearish: Break below 6,134.5 could trigger a retracement toward 6,026.0.
📛 Disclaimer: This is not financial advice. Trade at your own risk.

SPX500 AnalysisThis analysis is based on the 4-hour timeframe, reversal trading, and trend formation. I've posted a video explaining what I think is probable to happen and why.
Tuesday 29 July: Forex Market thoughts The EUR has begun the week under pressure following the US / EUR trade deal.
EUR weakness could be out down to what they call 'sell the fact', meaning buy last week's deal rumours / sell (take profit) on the announcement. Or, more likely, it could be because it appears the US has the better side of the deal. Either way, all of lat week's EUR positivity has dissipated.
I didn't get involved in a EUR short trade yesterday, but there is a case to say it was viable.
The USD and JPY begin the week on the front foot. Possibly benefitting from 'EUR liquidity', or possibly due to 'positioning' ahead of this week's FOMC and BOJ meetings.
As things stand, with the VIX below 15 and the S&P still riding high, I maintain my view that according to market fundamentals, 'risk on' trades 'should' be viable. Which means staying patient and waiting for a turnaround, particularly on the JPY charts.
If that turnaround doesn't come, I could be forced to change my view.
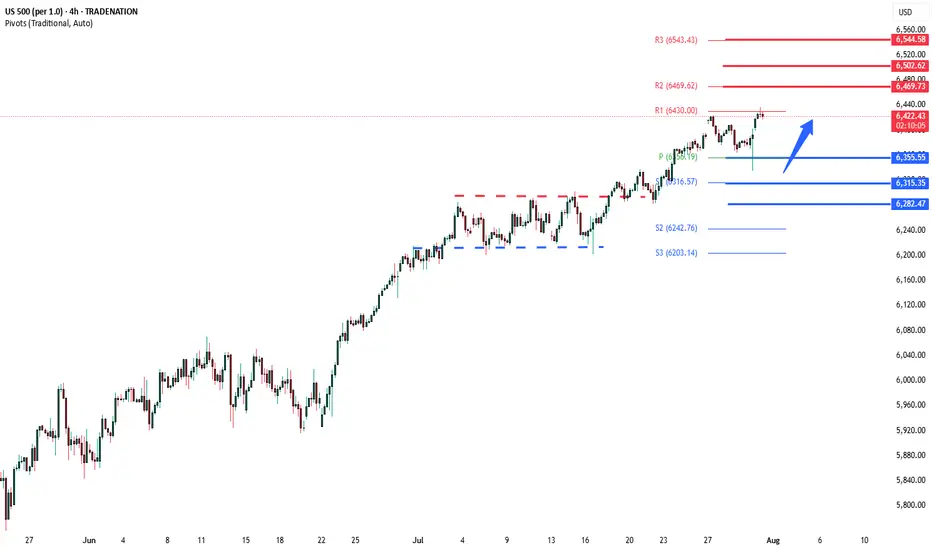
S&P500 uptrend pause supported at 6355US equities were largely subdued, with the S&P 500 inching up +0.02%, marking its sixth straight record high, the longest streak since July 2023. Despite the headline gain, over 70% of S&P 500 stocks declined, revealing weak breadth and suggesting index gains are being driven by a narrow group of large-cap tech names.
Tech led the way, with the information technology sector +0.77% and the Mag-7 rising +0.79%.
Semiconductors outperformed, as the Philadelphia Semiconductor Index climbed +1.62%, driven by AMD’s +4.32% surge.
Momentum is building ahead of key Big Tech earnings: Microsoft and Meta report tomorrow; Apple and Amazon follow Thursday.
Meanwhile, traders are staying cautious ahead of a busy macro week:
FOMC decision (Wednesday),
Core PCE, Q2 GDP, ISM, and nonfarm payrolls still to come.
Geopolitical developments include a possible 90-day US-China trade truce extension and Taiwan cancelling overseas travel, which may help de-escalate tensions.
On the corporate front:
Apple's India strategy sees it surpass China as the top smartphone source for US buyers.
Harley-Davidson may sell its finance unit in a $5B deal with Pimco and KKR.
Vitol rewarded top staff with $10.6B in share buybacks—a record.
Conclusion for S&P 500 Trading
The S&P 500 continues to post record highs, but narrow leadership and weak breadth raise red flags. With tech doing the heavy lifting, near-term direction hinges on earnings from Microsoft, Meta, Apple, and Amazon. Broader market upside looks fragile ahead of critical Fed and economic data, suggesting that any disappointment could trigger a pullback. Stay cautious and watch for rotation or retracement if macro or earnings catalysts falter.
Key Support and Resistance Levels
Resistance Level 1: 6430
Resistance Level 2: 6470
Resistance Level 3: 6500
Support Level 1: 6355
Support Level 2: 6315
Support Level 3: 6280
This communication is for informational purposes only and should not be viewed as any form of recommendation as to a particular course of action or as investment advice. It is not intended as an offer or solicitation for the purchase or sale of any financial instrument or as an official confirmation of any transaction. Opinions, estimates and assumptions expressed herein are made as of the date of this communication and are subject to change without notice. This communication has been prepared based upon information, including market prices, data and other information, believed to be reliable; however, Trade Nation does not warrant its completeness or accuracy. All market prices and market data contained in or attached to this communication are indicative and subject to change without notice.

SPX500USD | Bulls Lose Steam at 6,424.5 ResistanceThe S&P 500 Index showed strong bullish momentum but is now pulling back after tagging resistance at 6,424.5. Price is currently hovering near 6,374.6, where previous structure may act as support.
Support at: 6,374.6 / 6,340.0 🔽
Resistance at: 6,424.5 🔼
🔎 Bias:
🔼 Bullish: Bounce from 6,374.6 and reclaim of 6,424.5 signals continuation.
🔽 Bearish: Break below 6,374.6 exposes 6,340.0 and lower zones.
📛 Disclaimer: This is not financial advice. Trade at your own risk.

SPX....what goes up, must go downThis is long overdue. SPX has just crossed 9SMA, next 50SMA then 200SMA. Won't be surprised if it knocks each very soon. This will be a big week and tariffs are going to start hitting; even though this was mostly artificial and Americans are paying 90% of it! When in doubt, sell and park in money market! The next dip will hit hard and deep. Don't let the small wins overshadow the deep issues in the economy. Overpriced market and many lagging indicators will soon hit and default rates that are coming out are scary! Stay safe and don't get emotional over any stock. If it dips, you can always buy it cheaper.
Bulls and Bears zone for 07-28-2025Last week 4 out of 5 sessions S&P 500 made new ATH. However they were all trading within a tight range.
Level to watch: 6434---6436

Weekly Review: Forex fundamental analysis The week starting Monday 21 July was another week of positive sentiment, the S&P continues to hit all time highs and the VIX remains anchored below 17.
The upbeat mood was propelled by an announcement of a tariff deal between the US and Japan. The market now thinks it's likely deals with EUROPE and CHINA will soon follow. All the while, earnings season continues to quietly slip under the radar (it's worth noting the upcoming week does have a plethora of huge companies reporting).
An election in JAPAN caused uncertainty, giving the JPY a bout of strength at the beginning of the week. I then found it difficult to decide if the US / JAPAN trade deal would be positive or negative for the JPY, ultimately the overall positive risk tone prevailed and the JPY ended the week softly.
It was also a week of two halves for the USD, the interest rate battle between the president and chair Powell continues to cause uncertainty. The FOMC meeting and the upcoming slue of reg flag US data will be very interesting. And could determine the underlying bias for the USD for the rest of the summer.
The EUR and GBP were prominent throughout the week, a 'hawkish hold' from the ECB, combined with positive PMI data and hopes of a trade deal, all contributed to positive sentiment for the EUR.
On the opposite end of the scale, the GBP ended the week bruised, weakened by another bout of 'soft data'. Which opened the door to potential 'relative fundamental' GBP short trades.
Finally, 'fairly hawkish' comments from the RBA'S BULLOCK keeps the AUD high on my to long list.
On a personal note, it was a week of two trades. I perhaps was a little bold in thinking the JPY post election strength was overdone, entering an AUD JPY long which stopped out. You might often think it's frustrating when a trade stops out, but then eventually hits the original profit target. Personally, I take the positive view that at least my original bias was proved correct.
The week was saved on Friday with a EUR GBP long, post GBP retail sales data and trying to take advantage of the positive EUR sentiment.
*As I write, it appears a US /EUR tariff deal is very close, which backs up thoughts of 'risk on' trades to begin the new week.
Trade 1: AUD JPY -1
Trade 2: EUR GBP +1.5
Total = +0.5%
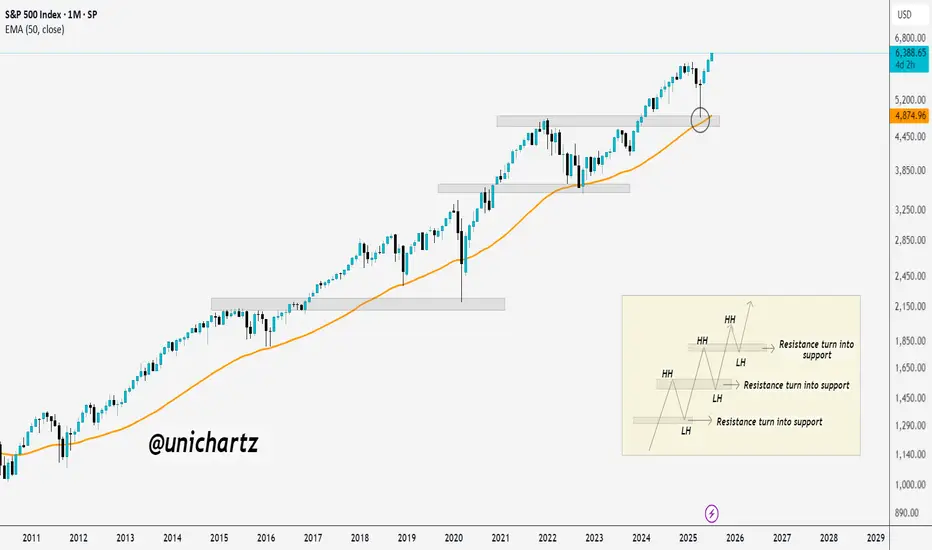
New All-Time Highs for S&P 500 – No Resistance AheadThe S&P 500 is officially in price discovery mode, printing new all-time highs with clean higher highs and higher lows.
Each old resistance flipped into strong support—textbook bullish market structure.
As long as this trend holds, there's no ceiling in sight. Bulls are fully in control.
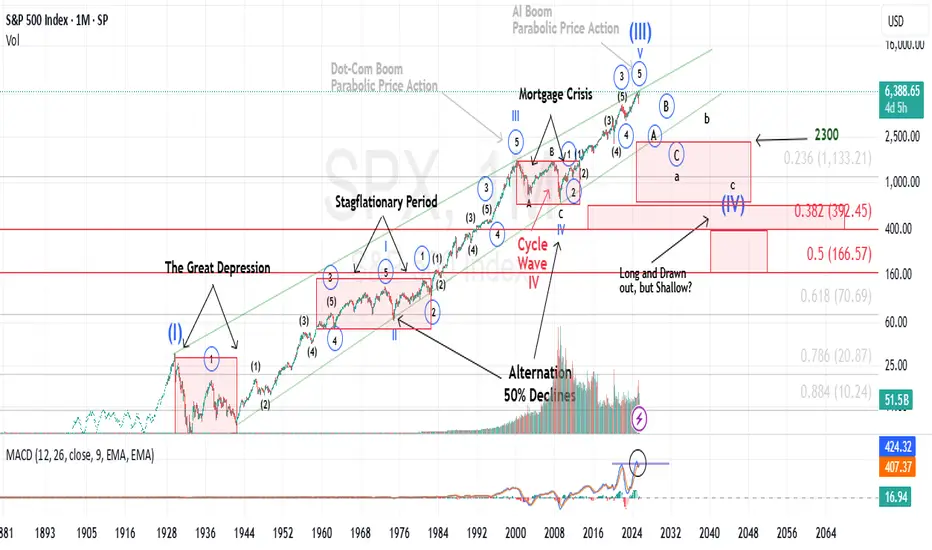
History does not repeat itself, however it tends to rhymeIt’s widely accepted that Mark Twain once said (or wrote) that “history does not repeat itself, however it tends to rhyme”.
Historical Parallels to a Super Cycle Wave (I) Top in U.S. Equities
The road to a major market top is often paved with echoing patterns from the past, and today's landscape bears an uncanny resemblance to pivotal historical events that preceded economic upheaval.
The 1918 Spanish Flu—though less economically damaging in the U.S. than elsewhere, still triggered a 1.5% drop in GDP and a 2.1% decline in consumer spending. The resulting economic weakness, paired with rising inflation, eroded real returns on equities and short-term government bonds for years.
Then came the 1929 stock market crash, the spark that ignited the Great Depression. Driven by a perfect storm of extreme speculation, sky-high valuations, and a regulatory vacuum, the collapse revealed the systemic fragility beneath the euphoria.
Adding fuel to the fire, the Smoot-Hawley Tariff Act of 1930 slammed the brakes on global trade. By sharply raising tariffs on imports, it invited swift retaliatory measures from abroad. The result: a devastating plunge in both U.S. exports and imports, deepening the economic crisis and worsening unemployment. Smoot-Hawley has since become a textbook example of how protectionist policy can magnify economic damage.
Modern Echoes: A Cycle Repeating?
Fast forward to the present and we see unsettling similarities.
The Covid-19 pandemic serves as a modern analog to the 1918 flu, disrupting global supply chains and triggering a steep drop in GDP and consumer spending. Unlike the post-WWI period, however, inflation didn’t precede the crisis, it exploded afterward, fueled by pent-up demand and fiscal stimulus, giving rise to persistent “sticky” inflation....and NOT TRANSITORY.
In a similar inversion of sequence, the Trump-era tariffs—modern-day echoes of Smoot-Hawley, were enacted before any major equity downturn, not after. Still, their long-term impact on global trade and supply chain reliability remains a pressure point for the economy.
Most critically, speculation and valuation excess are again center stage. Just as the roaring ’20s were characterized by euphoric risk-taking, today’s U.S. equity market is trading at record-high P/E ratios, despite rising macroeconomic uncertainty and deteriorating breadth.
These historical and contemporary markers suggest we may be approaching the apex of a Super Cycle Wave (III), a turning point that, like its predecessors, may only be fully recognized in hindsight.
It is my contention, that history is currently rhyming.
Best to all,
Chris
SPX500USD is on a riseHi traders,
Last week SPX500USD started the next impulse wave 5 (grey) as I've said in my outlook.
Next week we could see more upside for this pair.
Let's see what the market does and react.
Trade idea: Wait for a small pullback and a change in orderflow to bullish on a lower timeframe to trade longs.
NOTE: the next three weeks I'm on holiday so I will not post any outlook publicly.
If you want to learn more about trading FVG's & liquidity sweeps with Wave analysis, then please make sure to follow me.
This shared post is only my point of view on what could be the next move in this pair based on my technical analysis.
Don't be emotional, just trade your plan!
Eduwave

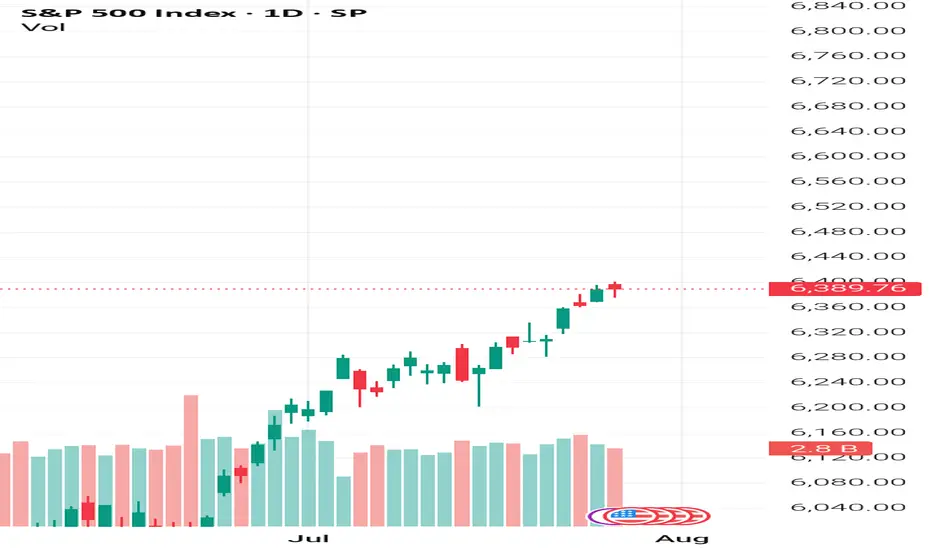
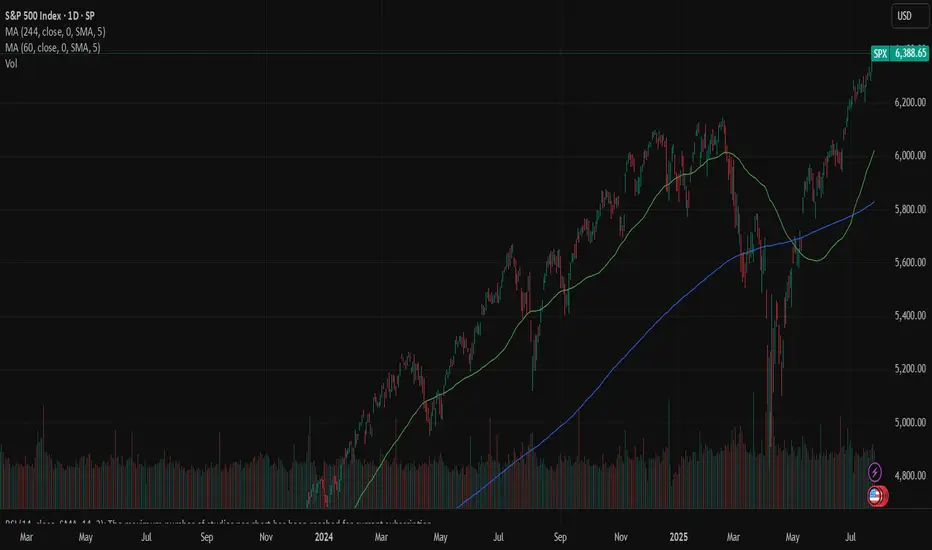
SPX: Tariffs deal (un)certainty Investors' optimism continued to hold at the U.S. equity markets another week in a row. The S&P 500 posted another weekly winning streak, supported by solid earnings of companies included in the index. The index also reached another all time highest level, with Friday's level of 6.388, gaining around 1,5% for the week.
Tech companies were once again main contributors to the surge of the index. Alphabet posted better than expected quarterly results, supporting the surge in share price of 4%. Tesla shares gained 3,5% for the week. The company reported strong vehicle delivery numbers and progress in AI-driven autonomous driving technology. Analysts are noting that 82% of all companies included in the S&P 500 index, that have already reported quarterly results, have beaten the market expectations.
Alongside strong earnings reports, recent advancements in U.S. trade negotiations have contributed to market gains. Earlier this week, President Donald Trump announced a significant trade agreement with Japan, which includes a 15% reciprocal tariff arrangement—an important step toward redefining trade terms between the two nations. Additionally, the U.S. and Indonesia have reportedly reached a framework agreement for a trade deal, reflecting a broader U.S. effort to strengthen and stabilize trade partnerships in Asia. On Friday, President Trump expressed confidence that more trade agreements will be finalized ahead of the August 1 deadline for new tariffs. One of these possible deals involves the European Union. Investors have welcomed these developments, as they help reduce tariff-related uncertainties and ease concerns about escalating trade disputes that could disrupt global supply chains and impact corporate earnings.
The week ahead brings a bunch of important macro data for the U.S. as well as the FOMC meeting, where Fed members will discuss a potential change in interest rates. Markets are currently not expecting that the Fed will make a move at this meeting. Certainly, with JOLTs, NFP, PCE data in combination with the FOMC meeting, the week ahead might bring back some higher volatility in the US equity markets, in case of any unexpected news.
Rob the Rally SPX500: Enter Before Resistance Catches You🦹♂️💰**“SPX500 Street Heist” – Thief-Style Robbery Plan for Bulls!**📈💸
(Powered by Thief Trader's Market Robbing Tactics – Scalp | Swing | Day Trade Edition)
🌍Hello, Global Money Hunters!
📣 Salaam, Bonjour, Ola, Hola, Hallo, Marhaba & Welcome to the heist floor! 🎩💼
Thief Trader is back again with a loaded plan to rob the market clean — this time targeting the mighty SPX500 / US500 🎯. Based on a fusion of technical setups, macro sentiment, and the Thief Trading System, we’ve set our sights on the next breakout vault of Wall Street.
🎯 The Gameplan – Heist the Resistance Vault
The index is entering a high-risk resistance barricade — overbought, consolidated, and heavily guarded by bearish robbers (sellers). This is the zone where the market police lurk and trend reversals often get triggered. However, smart thieves always plan with precision.
Here’s the mission briefing:
🔓Entry Zone (Break-in Point)
💥 “The vault is open — grab the bullish loot!”
Enter Long anywhere close to market price or on pullbacks near recent swing lows/highs.
Preferred timeframes: 15-min to 30-min for sniper-level accuracy.
Deploy DCA-style limit orders (layered entries for maximum control).
🛑Stop Loss (Escape Hatch)
Base SL on recent swing low candle wicks on the 4H timeframe.
Suggested: ~6250.00 — but adapt based on your risk appetite, lot size, and position stacking.
📈Target / Loot Location
🎯 Primary Take-Profit: 6450.00
Or… pull out early if you spot resistance fighters guarding the vault.
Use trailing SL to secure gains and manage getaway.
⚡Scalper’s Notice
Only Long-side allowed!
Got big capital? Jump in now.
Running low? Tag along with swing traders and follow the robbery protocol.
Always protect your bag with dynamic trailing stops.
🧠Fundamental Fuel Behind the Plan
Bullish sentiment across major indices
Macro trends, COT positioning, sentiment outlook, and intermarket analysis all greenlit
Geopolitical and Fed tone supportive — tap into real data before entering
👉 Always analyze: News, Fundamentals, Sentiment, COT reports, and macro conditions.
🚨NEWS ZONE ALERT – No Loud Moves!
Avoid entry during major economic news drops
Use trailing SLs to guard profits
Don’t let your open trades get caught in the chaos of news releases!
💥Let’s Boost the Thief Army!
Smash the BOOST button 💖 to power up the robbery crew.
Support the strategy, share the love, and stay ahead of the game using Thief Trading Style. Every trade is a step closer to freedom from financial traps. 🚀💰🎉
📌Disclaimer: This is a general market analysis for educational purposes and should not be considered personal financial advice. Please evaluate your own risk management strategy before placing trades.
📌Markets shift fast — stay flexible, stay alert, and always rob smart.
🔥Stay locked in for the next heist plan — Thief Trader signing off for now…
💸💼📈 Trade smart. Rob harder. 🤑🦹♂️📊

US500 Bulls Assemble | Breakout Heist Strategy📈🚨 MASTER HEIST PLAN: “SPX500 ROBBERY – THIEF TRADING STYLE 🔥💸” 🚨📈
(The Ultimate Long Strategy Blueprint for Smart Day/Swing Traders)
🌍 Greetings to All Market Bandits, Bullish Burglars, and Chart Snipers!
Hola! Bonjour! Ola! Hallo! Marhaba! 🙌
🦹♂️This is your friendly chart thief checking in with the latest SPX500/US500 masterplan!
This isn’t just a trade—it’s a heist 🎯. We’re not here to participate, we’re here to dominate! Welcome to the Thief Trading Style, where we map, trap, and snatch those pips with ruthless precision. 🧠🔍💰
🚀 THIEF TRADE SETUP - SPX500/US500
A mix of technical sniper entries + fundamental black ops analysis = 💸 Maximum Extraction. 💸
🎯 ENTRY PLAN: THE BREAKOUT HEIST
📍Buy Entry Zone: Wait for the clean breakout + candle close above 6270.00.
"The vault opens once we clear that wall. Let the bullish getaway begin!" 💥🚪📈
🛠️Thief Tips for Entry:
Use Buy Stop Orders above resistance levels.
OR layer in Buy Limit Orders near recent pullbacks (15/30m swing zones) using DCA Style (Dollar Cost Average layering like a pro).
Want stealth mode? Set that alert (alarm), and strike when the breakout sings. 🔔🎯
🛑 STOP LOSS – PROTECT THE LOOT
🧨Set your SL smart—beneath the nearest swing low using the 2H timeframe for stronger structure.
💬 “Look, don’t gamble. A thief knows when to run. Set that stop where I showed ya, or risk losin’ the bag.” 💼💣
❗Your SL should reflect your risk per trade, lot size, and number of entries. It’s your getaway plan—don’t mess it up.
💥 TARGETS – WHERE WE CASH OUT
🏴☠️Primary Take Profit (TP1): 6310.00
🏴☠️Secondary Take Profit (TP2): 6370.00
💹 Scalp Traders: Stick to the Long Side Only. Ride the momentum, but use trailing SL to lock it in.
🔍 THIEF FUNDAMENTAL INTEL: WHY THIS IS OUR MOMENT
Current SPX500 bullishness driven by:
✅ Positive macro & geopolitical tailwinds
✅ Institutional positioning (COT reports)
✅ Intermarket analysis showing strong correlations
✅ Momentum building with sentiment and volume
📌 Stay sharp—check all your fundamental reports, news catalysts, and sentiment tools before executing your move. Smart thieves plan every detail. 🎓📊
⚠️ NEWS RELEASE REMINDER
📢 News = Chaos. Don’t get caught in the spray:
🔒Avoid entering trades just before big announcements.
🚀 Use Trailing SL to secure profit if you're already in.
Stay agile. Stay smart. Stay rich. 💼🚁
❤️ SUPPORT THE HEIST – HIT THAT BOOST BUTTON!
👊 Liked the plan? Hit the Boost to join the elite robbery crew.
Every boost fuels the mission. Every like sharpens the strategy. Let's build a team of smart, profitable traders. 🚀💸🔥
🧠 Remember: This is general analysis – not financial advice. Manage your risk like a true thief. Stay updated. Adapt fast. Don't get caught. 🕵️♂️
🎉See you in the next Heist Plan! Keep your tools sharp, your charts cleaner, and your profit bags fatter. 🤑🔥

S&P 500 Counter-Trend Setup After Bullish Week US500Currently watching the S&P 500 (US500) closely 👀. The index has been in a strong bullish trend 📈, but I’m now evaluating a potential counter-trend opportunity.
Given the strength we’ve seen this week — possibly a “foolish rally” — there’s a chance we’ve either printed or are close to printing the high of the week 🧱. That opens the door for a retracement setup, particularly as we head into Monday’s open 🗓️.
🧠 Trade idea: If we get a bearish market structure break, I’ll be looking to enter short — targeting a 1R take profit initially, and holding a portion for a 2R–3R extension 🎯.
Friday sessions, especially after strong trends, often present clean intraday pullbacks — and when Monday’s low is set early, it can trap late buyers and fuel the move 📉.
⚠️ This is not financial advice — just sharing my thought process and trade plan.
