AUDUSD Breakout and Potential RetraceHey Traders, in today's trading session we are monitoring AUDUSD for a buying opportunity around 0.64700 zone, AUDUSD was trading in a downtrend and successfully managed to break it out. Currently is in a correction phase in which it is approaching the retrace area at 0.64700 support and resistance
Related currencies

AUDUSD Breakout Setup: Ready for Lift-Off!Hey Guys,
I’ve analyzed the AUDUSD pair for you. If the 0.65245 level breaks to the upside, my target will be 0.65416.
If it doesn’t break, I’ll be looking to buy around 0.65047 or 0.64954.
Either way, my final target remains 0.65416.
In this analysis, I’ve highlighted two key levels and shared

AUDUSD: Gold Breakout & DXY Resistance Could Fuel Bulls!!Hey Traders,
In tomorrow’s session, we’re eyeing a buying opportunity on AUDUSD around the 0.65100 zone. The pair remains in an uptrend and is currently in a correction phase, approaching a key support level at 0.65100.
We’re also keeping a bullish bias on Gold, which is attempting to break and hold

AUDUSD H4 | Bearish reversal off overlap resistanceThe Aussie (AUD/USD) is rising towards the sell entry which acts as an overlap resistance that aligns with the 61.8% Fibonacci retracement and could drop from this level to the take profit.
Sell entry is at 0.6541, which is an overlap resistance that lines up with the 61.8% Fibonacci retracement.

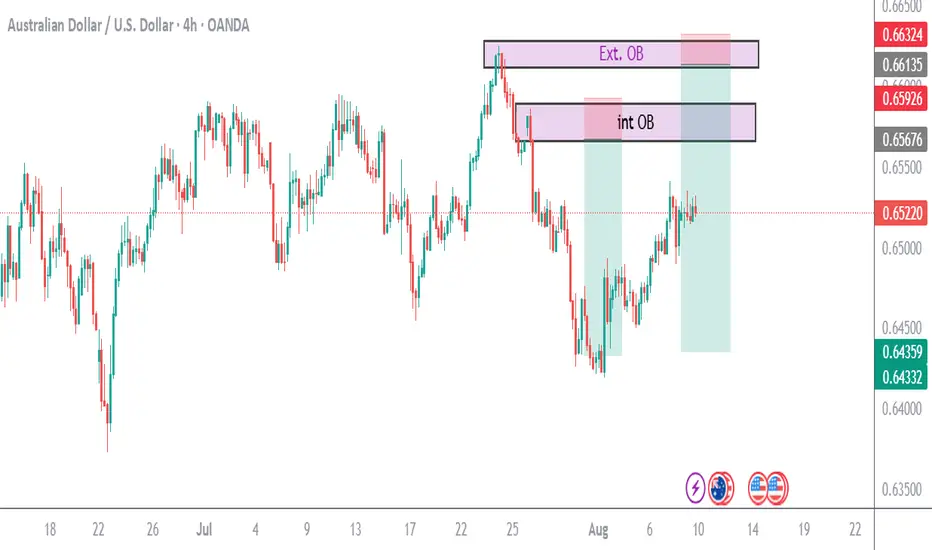
Supply in Sight: AUDUSD Gearing Up for a Reversal?Hello TradingView Family / Fellow Traders. This is Richard, also known as theSignalyst.
📈AUDUSD has been overall bullish trading within the rising channel marked in red and it is currently retesting the upper bound of the channel acting as an over-bought zone.
Moreover, the blue zone is a strong

AUDUSD: Bearish Continuation from broken supportThe current setup is a clean example of a trend continuation play. Price recently broke decisively below a structure zone, this break and retest now flips the narrative, what once was a buy zone is now an opportunity for short entries.
Following the aggressive move down, price now began pulling bac

AUDUSD will be on shorting by next week market. There is a break of structure and market structure shift to the upside whereby by next week an inducement will be formed, thus, leading to shorting of the market.
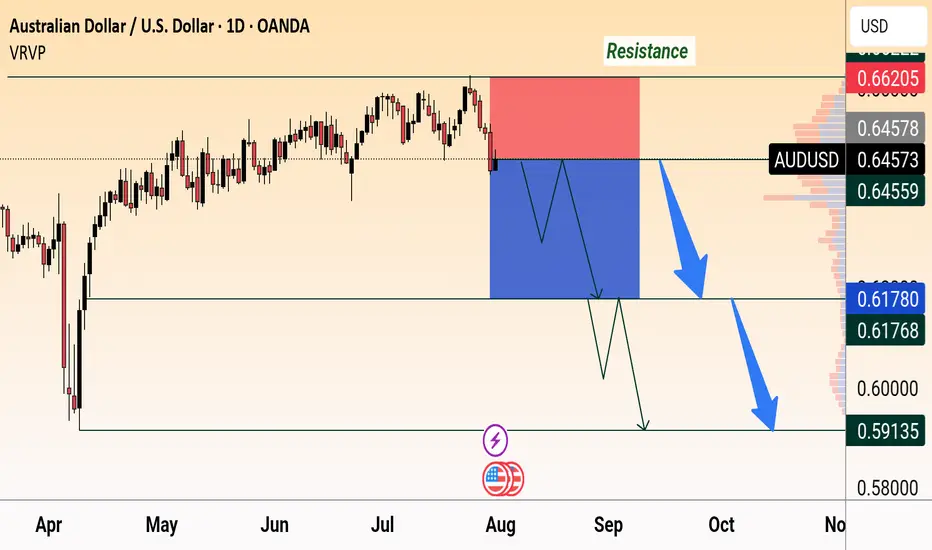
AUD/USD Bearish OutlookAUD/USD faces strong resistance at 0.6620 and is showing bearish momentum. Price is expected to drop below 0.6450 with targets near 0.6178 and 0.5913, following a possible consolidation.
AUDUSD DAILY TF SELL SHORTAUDUSD DAILY TF SELL SHORT
- In Daily TF Market Is Now Bearish our entry in Daily SIBI
- In LTF After Valid Mss Then Our entry in Valid OBI
- I Think this trade is Over Night Holding , Hold and enjoYYYYYYYYYYYY
~~KGB Priyabrat Behera~~
_ICT TRADER & ADVANCE MAPPING SMC TRADER_

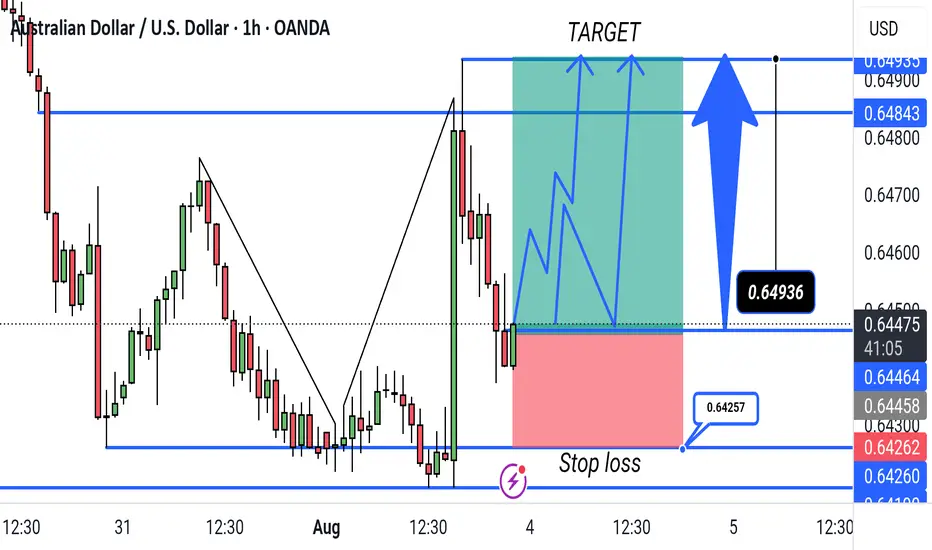
"AUD/USD Bullish Breakout Setup – 1H Timeframe. This chart shows a bullish trade setup for AUD/USD on the 1-hour timeframe. The entry is near 0.64464, with a target at 0.64843 and a stop loss at 0.64257. The trade aims to capitalize on a potential upward breakout following a support bounce.
See all ideas
Summarizing what the indicators are suggesting.
Oscillators
Neutral
SellBuy
Strong sellStrong buy
Strong sellSellNeutralBuyStrong buy
Oscillators
Neutral
SellBuy
Strong sellStrong buy
Strong sellSellNeutralBuyStrong buy
Summary
Neutral
SellBuy
Strong sellStrong buy
Strong sellSellNeutralBuyStrong buy
Summary
Neutral
SellBuy
Strong sellStrong buy
Strong sellSellNeutralBuyStrong buy
Summary
Neutral
SellBuy
Strong sellStrong buy
Strong sellSellNeutralBuyStrong buy
Moving Averages
Neutral
SellBuy
Strong sellStrong buy
Strong sellSellNeutralBuyStrong buy
Moving Averages
Neutral
SellBuy
Strong sellStrong buy
Strong sellSellNeutralBuyStrong buy
Displays a symbol's price movements over previous years to identify recurring trends.
Frequently Asked Questions
The current rate of USDAUD is 1.5327 AUD — it has decreased by −0.01% in the past 24 hours. See more of USDAUD rate dynamics on the detailed chart.
The value of the USDAUD pair is quoted as 1 USD per x AUD. For example, if the pair is trading at 1.50, it means it takes 1.5 AUD to buy 1 USD.
The term volatility describes the risk related to the changes in an asset's value. USDAUD has the volatility rating of 0.13%. Track all currencies' changes with our live Forex Heatmap and prepare for markets volatility.
The USDAUD showed a −1.49% fall over the past week, the month change is a 0.22% rise, and over the last year it has increased by 1.09%. Track live rate changes on the USDAUD chart.
Learn how you can make money on rate changes in numerous trading ideas created by our community.
Learn how you can make money on rate changes in numerous trading ideas created by our community.
USDAUD is a major currency pair, i.e. a popular currency paired with USD.
Currencies are usually traded through forex brokers — choose the one that suits your needs and go ahead. You can trade USDAUD right from TradingView charts — just log in to you broker account. Check out the list of our integrated brokers and find the best one for your needs and strategy.
When deciding to buy or sell currency one should keep in mind many factors including current geopolitical situation, interest rates, and other. But before plunging into a deep research, you can start with USDAUD technical analysis. The technical rating for the pair is sell today, but don't forget that markets can be very unstable, so don't stop here. According to our 1 week rating the USDAUD shows the sell signal, and 1 month rating is buy. See more of USDAUD technicals for a more comprehensive analysis.