AUDUSD Set To Grow! BUY!
My dear subscribers,
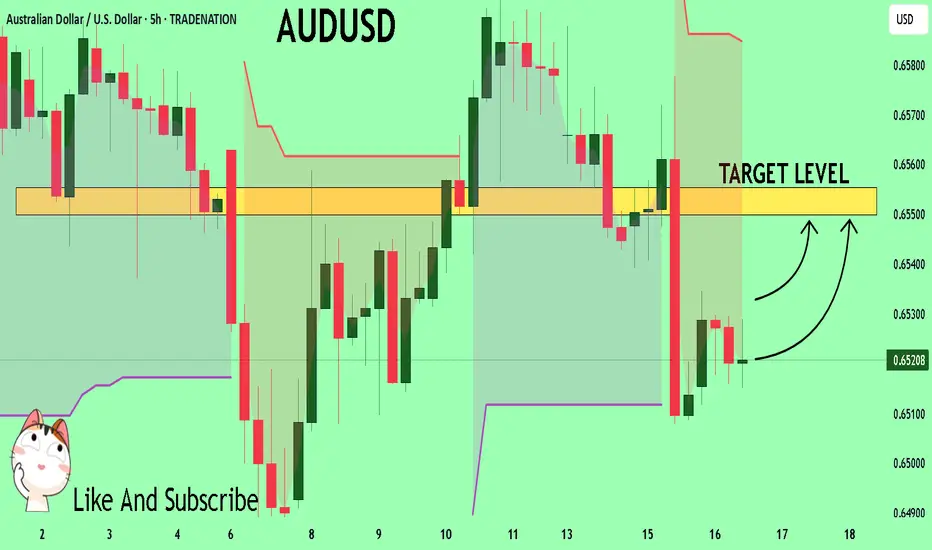
AUDUSD looks like it will make a good move, and here are the details:
The market is trading on 0.6521 pivot level.
Bias - Bullish
Technical Indicators: Both Super Trend & Pivot HL indicate a highly probable Bullish continuation.
Target - 0.6550
About Used Indicators:
The average true range (ATR) plays an important role in 'Supertrend' as the indicator uses ATR to calculate its value. The ATR indicator signals the degree of price volatility.
Disclosure: I am part of Trade Nation's Influencer program and receive a monthly fee for using their TradingView charts in my analysis.
———————————
WISH YOU ALL LUCK
USDAUD trade ideas
BUY AUDUSDWe can expect a massive reversal across all USD pairs. AUDUSD showing the best setup of all the pairs. BUY

AUD/USD BEARS WILL DOMINATE THE MARKET|SHORT
Hello, Friends!
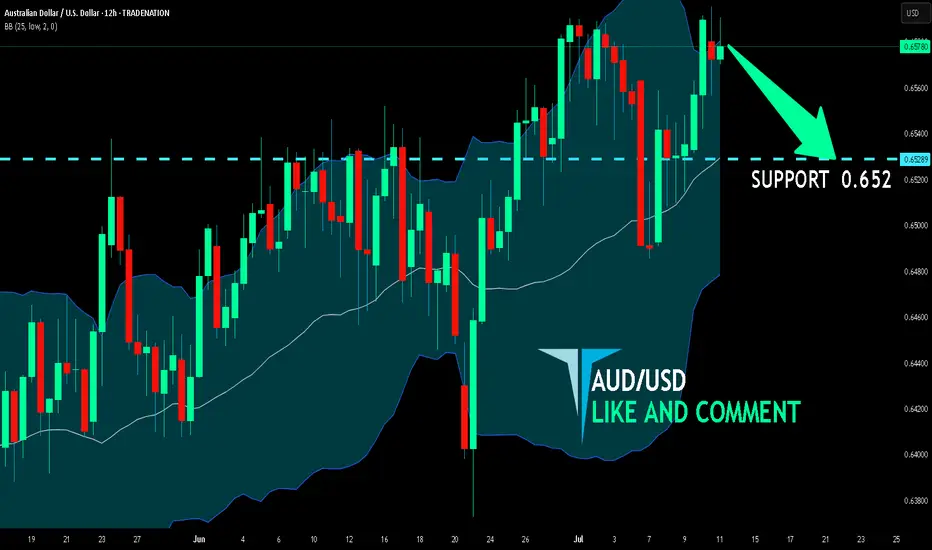
We are now examining the AUD/USD pair and we can see that the pair is going up locally while also being in a uptrend on the 1W TF. But there is also a powerful signal from the BB upper band being nearby, indicating that the pair is overbought so we can go short from the resistance line above and a target at 0.652 level.
Disclosure: I am part of Trade Nation's Influencer program and receive a monthly fee for using their TradingView charts in my analysis.
✅LIKE AND COMMENT MY IDEAS✅
Possible sell opportunity on AUDUSD After USD massive ground pick up after CPI . The USD has maintained a strong momentum. Towards the weekly support

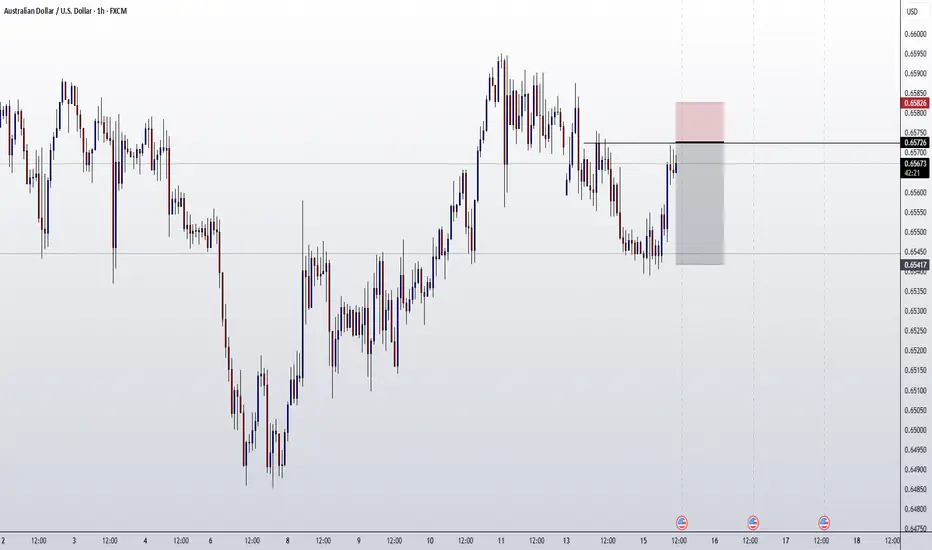
AUDUSD – Sell Into Rally as Top Formation DevelopsTrade Idea
Type: Sell Limit
Entry: 0.6560
Target: 0.6500
Stop Loss: 0.6575
Duration: Intraday
Expires: 17/07/2025 06:00
Technical Overview
Recent price action has been mixed and volatile, with signs that a top is forming.
The preferred strategy is to sell into rallies, capturing potential exhaustion near resistance.
Bespoke resistance at 0.6560 aligns perfectly with the entry, offering a high-probability area for reversal.
A move lower to 0.6500 would confirm bearish momentum and complete the expected corrective move.
Watch for upcoming key data events:
US PPI data (16/07 at 13:30 UTC), and
Australian Employment data (17/07 at 02:30 UTC), both of which could increase volatility and provide catalysts.
Key Technical Levels
Resistance: 0.6570 / 0.6590 / 0.6600
Support: 0.6520 / 0.6500 / 0.6480
Disclosure: I am part of Trade Nation's Influencer program and receive a monthly fee for using their TradingView charts in my analysis.

correctionIt is expected that there will be a fluctuation in the current support area and then a change in trend. Then the continuation of the upward trend will be likely.
A break through the support area will cause a continuation of the downward trend.

AUDUSD: Consolidation ContinuesThe AUDUSD is currently consolidating within a broad horizontal channel.
A notable bearish response to resistance has occurred, with the formation of a cup and handle pattern leading to a decline.
There is a strong likelihood that the price will soon hit the 0.6500 level.

Trend Line Tested Twice Is AUD/USD Ready to Rally?📈 AUD/USD Market Insight – Potential Bullish Breakout Ahead?
The AUD/USD pair has respected a key trend line, bouncing off it for the second time — a sign of potential strength. If the price revisits and successfully retests this trend line, we could see a bullish momentum (a pump) play out.
On the flip side, if the pair maintains its current trajectory without pulling back, focus shifts to the 0.65415–0.65455 resistance zone. A clean breakout above this range could open the doors for a move higher — potentially targeting swing highs and key liquidity zones.
🚀 Watch closely — the next move could be significant.
🔎 Always DYOR (Do Your Own Research). This is not financial advice.

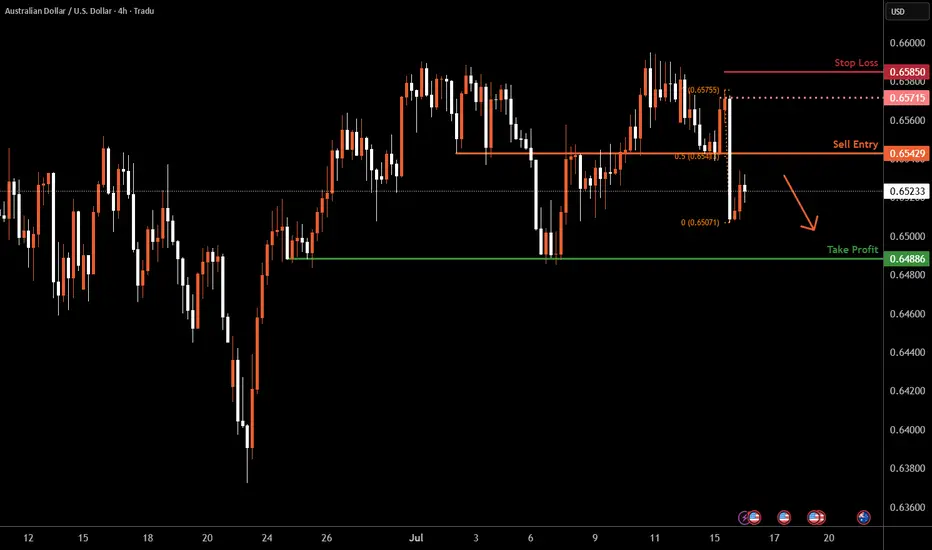
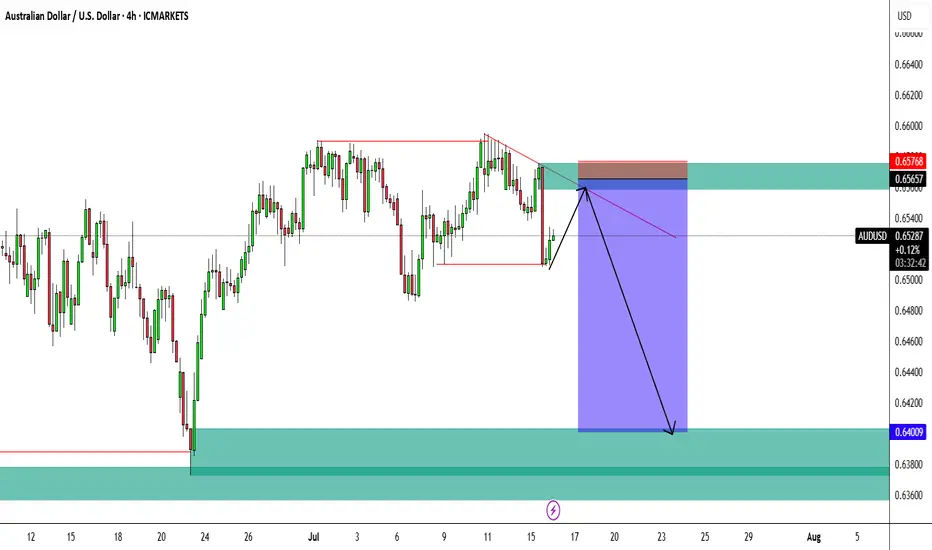
Aussie H4 | Overlap resistance at 50% Fibonacci retracementThe Aussie (AUD/USD) is rising towards an overlap resistance and could potentially reverse off this level to drop lower.
Sell entry is at 0.6542 which is an overlap resistance that aligns with the 50% Fibonacci retracement.
Stop loss is at 0.6585 which is a level that sits above a swing-high resistance.
Take profit is at 0.6488 which is a multi-swing-low support.
High Risk Investment Warning
Trading Forex/CFDs on margin carries a high level of risk and may not be suitable for all investors. Leverage can work against you.
Stratos Markets Limited (tradu.com ):
CFDs are complex instruments and come with a high risk of losing money rapidly due to leverage. 63% of retail investor accounts lose money when trading CFDs with this provider. You should consider whether you understand how CFDs work and whether you can afford to take the high risk of losing your money.
Stratos Europe Ltd (tradu.com ):
CFDs are complex instruments and come with a high risk of losing money rapidly due to leverage. 63% of retail investor accounts lose money when trading CFDs with this provider. You should consider whether you understand how CFDs work and whether you can afford to take the high risk of losing your money.
Stratos Global LLC (tradu.com ):
Losses can exceed deposits.
Please be advised that the information presented on TradingView is provided to Tradu (‘Company’, ‘we’) by a third-party provider (‘TFA Global Pte Ltd’). Please be reminded that you are solely responsible for the trading decisions on your account. There is a very high degree of risk involved in trading. Any information and/or content is intended entirely for research, educational and informational purposes only and does not constitute investment or consultation advice or investment strategy. The information is not tailored to the investment needs of any specific person and therefore does not involve a consideration of any of the investment objectives, financial situation or needs of any viewer that may receive it. Kindly also note that past performance is not a reliable indicator of future results. Actual results may differ materially from those anticipated in forward-looking or past performance statements. We assume no liability as to the accuracy or completeness of any of the information and/or content provided herein and the Company cannot be held responsible for any omission, mistake nor for any loss or damage including without limitation to any loss of profit which may arise from reliance on any information supplied by TFA Global Pte Ltd.
The speaker(s) is neither an employee, agent nor representative of Tradu and is therefore acting independently. The opinions given are their own, constitute general market commentary, and do not constitute the opinion or advice of Tradu or any form of personal or investment advice. Tradu neither endorses nor guarantees offerings of third-party speakers, nor is Tradu responsible for the content, veracity or opinions of third-party speakers, presenters or participants.
AUDUSD InsightHello to all our subscribers!
Please feel free to share your personal thoughts in the comments. Don't forget to like and subscribe!
Key Points
- The U.S. June CPI came in at 2.7%, matching market expectations, while core CPI was 2.9%, slightly below the expected 3.0%. Overall, the figures were in line with forecasts, but the prices of essential goods rose. Companies appear to be gradually passing on the rising import costs to consumers, indicating that the effects of tariffs are starting to filter through.
- U.S. President Trump announced a trade agreement with Indonesia, under which Indonesia will pay a 19% tariff on all exports to the U.S., while U.S. exports to Indonesia will be exempt from tariffs.
- President Trump also granted a 50-day grace period on sanctions against Russia.
Major Economic Events This Week
+ July 15: U.S. June Consumer Price Index (CPI)
+ July 16: U.K. June CPI, U.S. June Producer Price Index (PPI)
+ July 17: Eurozone June CPI
AUDUSD Chart Analysis
The pair continues a modest upward trend along the channel. As previously mentioned, a move toward the 0.69000 level is expected. However, there may be a brief pause around the 0.67000 resistance zone. This pullback is likely to be minor, and in the longer term, the 0.69000 level remains a potential target.

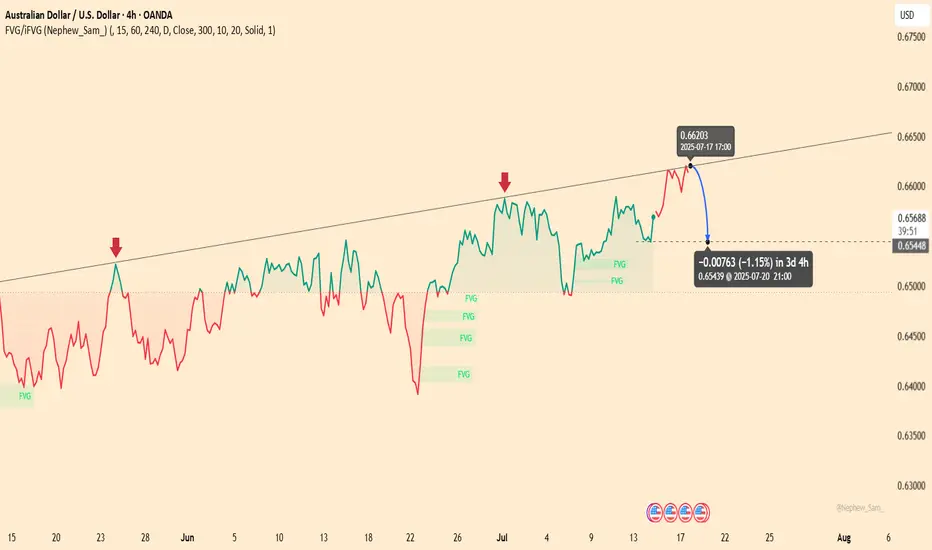
AUDUSD – Mild rebound, downside risk aheadAUDUSD is approaching a key trendline resistance after a short-term recovery. However, repeated rejections at this level in the past suggest a potential reversal is forming. The current structure mirrors previous setups – a mild rally into the trendline followed by weakness.
On the news front, recent U.S. economic data has supported the dollar, particularly stable job numbers and consumer confidence. Meanwhile, the market is awaiting the upcoming FOMC meeting minutes and Australia’s CPI report. Without a surprise boost from AUD fundamentals, the pair could face renewed downward pressure in the coming sessions.
audusd shorthello guys sorry been away for some time
Looking for shorts on audusd as I believe price took out EQH followed by bearish wick action which caused price to sell lower as seen in the recent 4hr bearish candle.
Looking for price to come back to this level and respect it hopefully if not we can look for more sells if more EQH's get taken out but if a strong move to the upside occurs, than I will look to change bias.
AUDUSD TRADE IDEA AUDUSD has pulled back to our Fibonacci level for a trade to the upside. Let's see how the market does it's thing

NZD USD shortIt has yet to be experienced, but it seems legitimate. Most likely, it could retest the flag, but if it wants to continue further down, it could present a good trade setup.

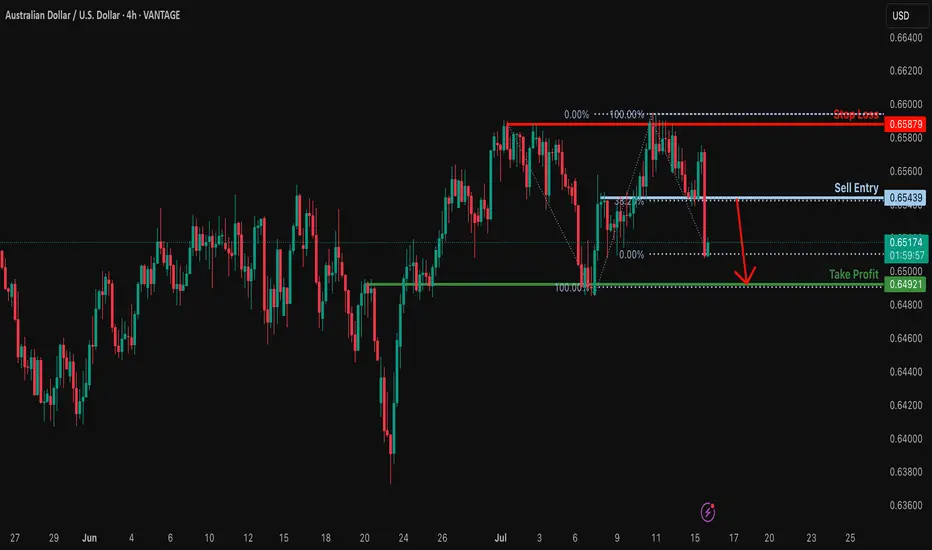
Heading into 38.2% Fibonacci resistance?AUD/USD is rising towards the resistance level which is an overlap. resistance that aligns with the 38.2% Fibonacci retracement and. could drop from this level to our take profit.
Entry: 0.6543
Why we like it:
There is n overlap resistance that aligns with the 38.2% Fibonacci retracement.
Stop loss: 0.6587
Why we like it:
There is. pullback resistance.
Take profit: 0.6492
Why we like it:
There is an overlap support level that lines up with the 100% Fibonacci projection.
Enjoying your TradingView experience? Review us!
Please be advised that the information presented on TradingView is provided to Vantage (‘Vantage Global Limited’, ‘we’) by a third-party provider (‘Everest Fortune Group’). Please be reminded that you are solely responsible for the trading decisions on your account. There is a very high degree of risk involved in trading. Any information and/or content is intended entirely for research, educational and informational purposes only and does not constitute investment or consultation advice or investment strategy. The information is not tailored to the investment needs of any specific person and therefore does not involve a consideration of any of the investment objectives, financial situation or needs of any viewer that may receive it. Kindly also note that past performance is not a reliable indicator of future results. Actual results may differ materially from those anticipated in forward-looking or past performance statements. We assume no liability as to the accuracy or completeness of any of the information and/or content provided herein and the Company cannot be held responsible for any omission, mistake nor for any loss or damage including without limitation to any loss of profit which may arise from reliance on any information supplied by Everest Fortune Group.
AUDUSD good structure for higher bullish
OANDA:AUDUSD whats next, we are have DESCENDING CHANNEL breaked, its followed by bullish push, but its not make to much in my op, at end price is make revers, its stop at end on strong sup zone (0.64900).
We are have in last day-two RBA and RBNZ today, price is start pushing looks like zone 0.64900 can be taked for valid zone, from which now expecting higher bullish push in next periods.
SUP zone: 0.65100
RES zone: 0.66300, 0.66600

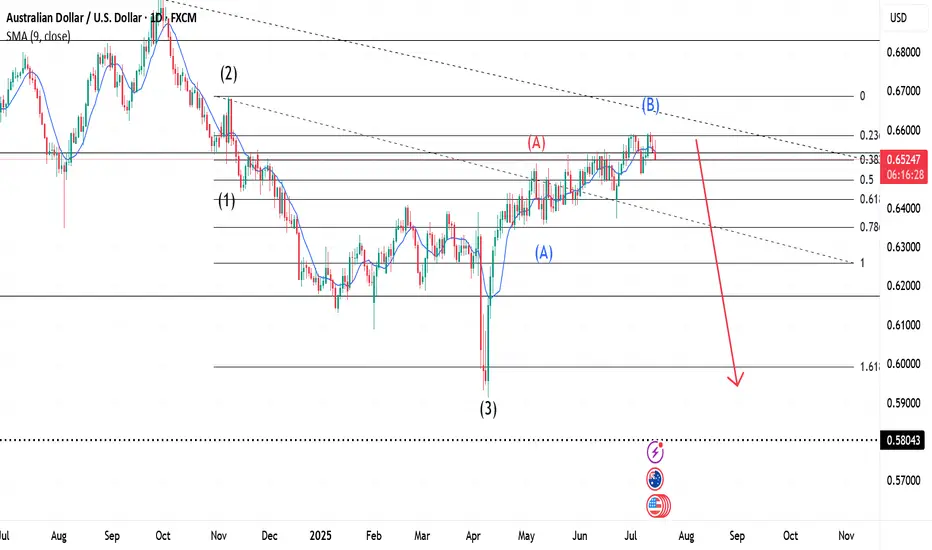
AUDSUD and Elliott Wave TheoryWe are currently on a Flat correction shown in Blue of a Zigzag which has its first wave marked in Red. We should expect a Wave C(Blue) which would be Wave B(Red), then a continuation to the upside.
AUDUSD ENTRY CHARTOn this pair, we are still BEARISH, First we have our trend still on the a DOWNTREND, also on the Hourly, we got a strong KEY LEVELs+ INDUCEMENT/IMBALANCE,we got our confirmation on the LTF already, we are waiting for Price to get us IN, we also have other additional confluence on this PAIR, So if this matches with your IDEA, you can look to join us with a good risk, also note that we have got STRONG INFLATION RATE NEWS on the DOLLAR, so be watchful. THANK YOU>
AUDUSD SHORT & LONG FORECAST Q3 D15 W29 Y25AUDUSD SHORT & LONG FORECAST Q3 D15 W29 Y25
Professional Risk Managers👋
Welcome back to another FRGNT chart update📈
Diving into some Forex setups using predominantly higher time frame order blocks alongside confirmation breaks of structure.
Let’s see what price action is telling us today! 👀
💡Here are some trade confluences📝
✅Daily Order block identified
✅4H Order Block identified
✅1H Order Block identified
🔑 Remember, to participate in trading comes always with a degree of risk, therefore as professional risk managers it remains vital that we stick to our risk management plan as well as our trading strategies.
📈The rest, we leave to the balance of probabilities.
💡Fail to plan. Plan to fail.
🏆It has always been that simple.
❤️Good luck with your trading journey, I shall see you at the very top.
🎯Trade consistent, FRGNT X


Long Audusd Risking 20pips for 50pips. I'd recommended entering double your initial lot size and tp 1 after 25 pips so that sort of makes you breakeven

CITYSTAR | AUDUSD ; SELL ANALYSE AUDUSD New Forecast👨💻👨💻
This is my personal trade and not in anyway a mandatory setup.
Note:
Follow proper risk management rules. Never risk more then 2% of your total capital. Money management is the key of success in this business...... Set your own SL & TP.
Please support this idea with a Like and COMMENT if you find it useful click "follow" on our profile if you will like these type of trading ideas delivered straight to your email in the future.
Thanks for your continued support!! lemme know your thoughts in the comment sec..

AUDUSD(20250715)Today's AnalysisMarket news:
Sources said that after Trump's latest trade tax threat, the European Central Bank will discuss a more negative scenario next week than expected in June. The ECB is still expected to keep interest rates unchanged at its meeting on July 24. Discussions on rate cuts are still postponed to September.
Technical analysis:
Today's buying and selling boundaries:
0.6557
Support and resistance levels:
0.6602
0.6585
0.6574
0.6539
0.6528
0.6511
Trading strategy:
If it breaks through 0.6557, consider buying in, the first target price is 0.6574
If it breaks through 0.6539, consider selling in, the first target price is 0.6528
