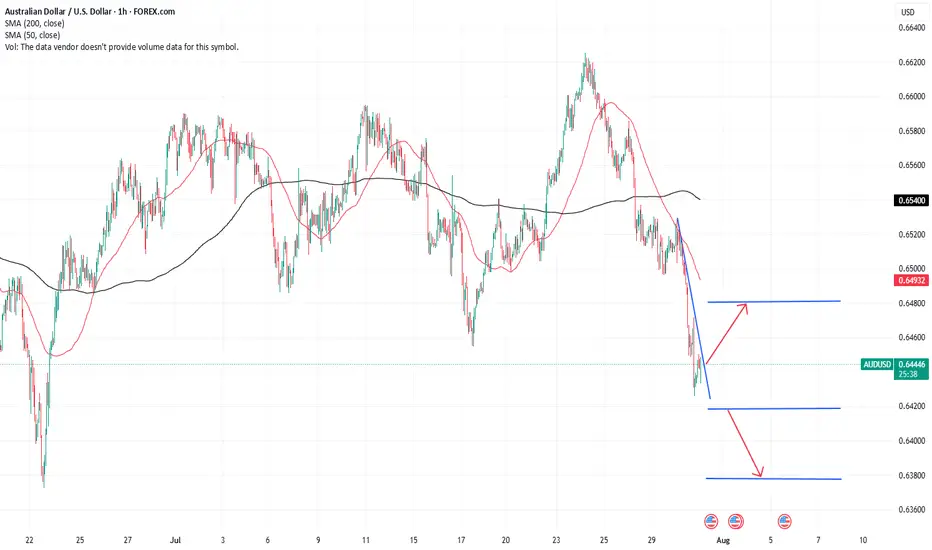
Potential bullish reversal?The Aussie (AUD/USD) has bounced off the pivot, which is a swing low support, and could rise to the 1st resistance, which acts as a pullback resistance.
Pivot: 0.6502
1st Support: 0.6468
1st Resistance: 0.6558
Risk Warning:
Trading Forex and CFDs carries a high level of risk to your capital and you should only trade with money you can afford to lose. Trading Forex and CFDs may not be suitable for all investors, so please ensure that you fully understand the risks involved and seek independent advice if necessary.
Disclaimer:
The above opinions given constitute general market commentary, and do not constitute the opinion or advice of IC Markets or any form of personal or investment advice.
Any opinions, news, research, analyses, prices, other information, or links to third-party sites contained on this website are provided on an "as-is" basis, are intended only to be informative, is not an advice nor a recommendation, nor research, or a record of our trading prices, or an offer of, or solicitation for a transaction in any financial instrument and thus should not be treated as such. The information provided does not involve any specific investment objectives, financial situation and needs of any specific person who may receive it. Please be aware, that past performance is not a reliable indicator of future performance and/or results. Past Performance or Forward-looking scenarios based upon the reasonable beliefs of the third-party provider are not a guarantee of future performance. Actual results may differ materially from those anticipated in forward-looking or past performance statements. IC Markets makes no representation or warranty and assumes no liability as to the accuracy or completeness of the information provided, nor any loss arising from any investment based on a recommendation, forecast or any information supplied by any third-party.
USDAUD trade ideas

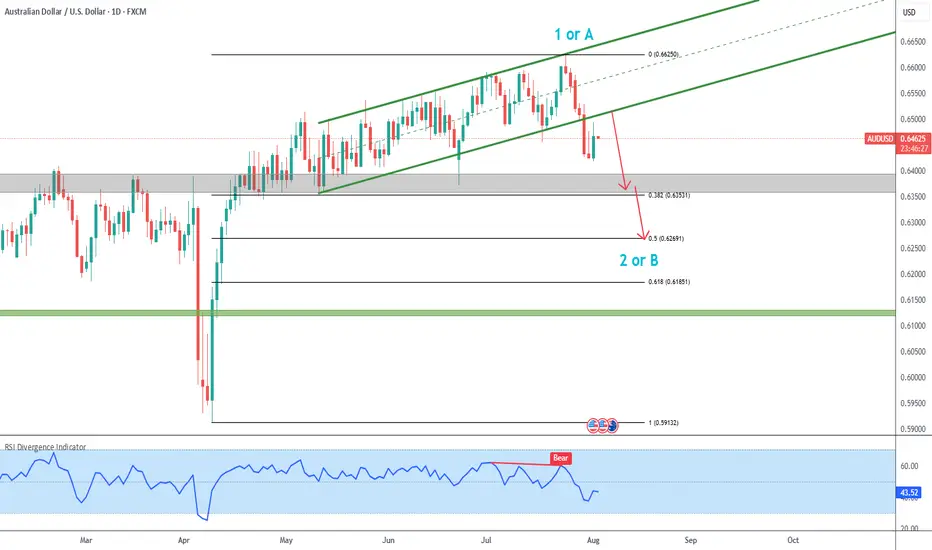
AUDUSD Correction in progress
▶️ AUDUSD has broken the green ascending channel that had been in progress since late April.
▶️ This break suggests wave 1/A likely concluded at 0.66250, supported by bearish RSI divergence on the high.
▶️ Retests of the bottom of the broken channel could offer short trade opportunities.
▶️ The initial high-probability target is the 38.2% Fibonacci retracement at 0.63531, which aligns with the start of the ascending channel.
▶️ A secondary target is the 50% retracement level at 0.62691.
AUD USD BUYAfter a healthy correction AUD showing strength with some bullish divergence. A good entry for the restarec Elliot Wave.

Potential bearish drop?The Aussie (AUD/USD) is rising toward the resistance level, which is a pullback resistance that is slightly above the 23.6% Fibonacci retracement and could reverse from this level to our take profit.
Entry: 0.6532
Why we like it:
There is a pullback resistance that is slightly above the 23.6% Fibonacci retracement.
Stop loss: 0.6580
Why we like it:
There is a pullback resistance that is slightly above the 61.8% Fibonacci retracement.
Take profit: 0.6467
Why we like it:
There is a swing low support.
Enjoying your TradingView experience? Review us!
TradingView (www.tradingview.com)
Please be advised that the information presented on TradingView is provided to Vantage (‘Vantage Global Limited’, ‘we’) by a third-party provider (‘Everest Fortune Group’). Please be reminded that you are solely responsible for the trading decisions on your account. There is a very high degree of risk involved in trading. Any information and/or content is intended entirely for research, educational and informational purposes only and does not constitute investment or consultation advice or investment strategy. The information is not tailored to the investment needs of any specific person and therefore does not involve a consideration of any of the investment objectives, financial situation or needs of any viewer that may receive it. Kindly also note that past performance is not a reliable indicator of future results. Actual results may differ materially from those anticipated in forward-looking or past performance statements. We assume no liability as to the accuracy or completeness of any of the information and/or content provided herein and the Company cannot be held responsible for any omission, mistake nor for any loss or damage including without limitation to any loss of profit which may arise from reliance on any information supplied by Everest Fortune Group.

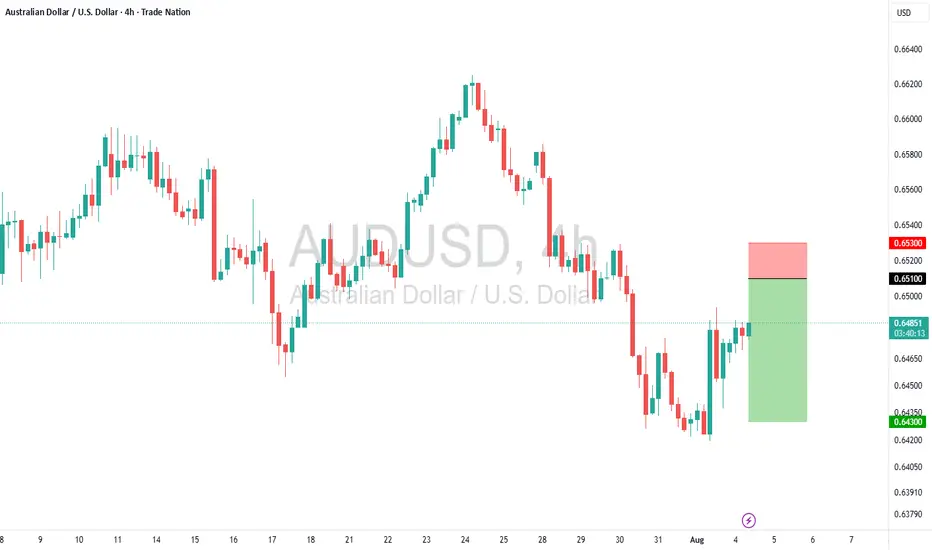
AUDUSD – Sell Into Resistance at 0.6510Trade Idea
Type: Sell Limit
Entry: 0.6510
Target: 0.6430
Stop Loss: 0.6530
Duration: Intraday
Expires: 05/08/2025 06:00
Technical Overview
Medium-term bias remains bearish despite recent intraday volatility.
A temporary move higher is anticipated, offering a setup to sell into strength.
Bespoke resistance at 0.6510 provides a strategic entry level for short positions.
The trade targets a move toward 0.6430, with potential support seen just below.
Key Technical Levels
Resistance: 0.6500 / 0.6530 / 0.6560
Support: 0.6440 / 0.6420 / 0.6400
Disclosure: I am part of Trade Nation's Influencer program and receive a monthly fee for using their TradingView charts in my analysis.
Australian inflation lower than forecast, Fed up nextThe Australian dollar is showing limited movement. In the European session, AUD/USD is trading at 0.6500, down 0.15% on the day.
Australia's inflation rate for the second quarter came in lower than expected. Headline CPI dropped to 2.1% y/y, down from 2.4% in the prior two quarters and falling to its lowest level since Q1 2021. This was just below the market estimate of 2.2%. Quarterly, CPI rose 0.7% in Q2, down from 0.9% in Q1 and below the market estimate of 0.8%.
Services inflation continued to decline and fell to 3.3% from 3.7%. The drop in CPI was driven by a sharp drop in automotive fuel costs. The RBA's key gauge for core CPI, the trimmed mean, slowed to 2.7% from 2.9%, matching the market forecast. This was the lowest level since Q4 2021.
The positive inflation report is a reassuring sign that inflation is under control and should cement a rate cut at the Aug. 12 meeting. The Reserve Bank of Australia stunned the markets earlier this month when it held rates, as a quarter-point cut had been all but certain. Bank policymakers said at that meeting that they wanted to wait for more inflation data to make sure that inflation was contained and today's inflation report should reassure even the hawkish members that a rate cut is the right move at the August meeting.
The Federal Reserve meets today and is widely expected to maintain the benchmark rate for a fifth straight meeting. Investors will be looking for clues regarding the September meeting, as the markets have priced in a rate cut at 63%, according to CME's FedWatch.
AUDUSD SHORT SETUP – BEARISH BREAK & RETEST📉 AUDUSD SHORT SETUP – BEARISH BREAK & RETEST
Price breaks below rising channel support and retests structure as new resistance. Clean rejection confirms bearish continuation bias.
🔻 Entry: 0.6495
🎯 Targets: 0.6420 → 0.6400 → 0.6370
🛑 SL: 0.6545
⏰ TF: 2H
📊 Bias: Bearish
Technical confluence aligns with momentum shift—waiting for follow-through to key demand zone.
#AUDUSD #ForexSignals #PulseTradesFX

AUSSIE H4 | Bullish riseAUD/USD has bounced off the buy entry at 0.6467, which is an overlap support, and could rise to the take-profit level.
Stop is at 0.6423, which is a swing low support.
Take profit is at 0.6541, which is a pullback resistance that aligns with the 61.8% Fibonacci retracement.
High Risk Investment Warning
Trading Forex/CFDs on margin carries a high level of risk and may not be suitable for all investors. Leverage can work against you.
Stratos Markets Limited (tradu.com ):
CFDs are complex instruments and come with a high risk of losing money rapidly due to leverage. 65% of retail investor accounts lose money when trading CFDs with this provider. You should consider whether you understand how CFDs work and whether you can afford to take the high risk of losing your money.
Stratos Europe Ltd (tradu.com ):
CFDs are complex instruments and come with a high risk of losing money rapidly due to leverage. 66% of retail investor accounts lose money when trading CFDs with this provider. You should consider whether you understand how CFDs work and whether you can afford to take the high risk of losing your money.
Stratos Global LLC (tradu.com ):
Losses can exceed deposits.
Please be advised that the information presented on TradingView is provided to Tradu (‘Company’, ‘we’) by a third-party provider (‘TFA Global Pte Ltd’). Please be reminded that you are solely responsible for the trading decisions on your account. There is a very high degree of risk involved in trading. Any information and/or content is intended entirely for research, educational and informational purposes only and does not constitute investment or consultation advice or investment strategy. The information is not tailored to the investment needs of any specific person and therefore does not involve a consideration of any of the investment objectives, financial situation or needs of any viewer that may receive it. Kindly also note that past performance is not a reliable indicator of future results. Actual results may differ materially from those anticipated in forward-looking or past performance statements. We assume no liability as to the accuracy or completeness of any of the information and/or content provided herein and the Company cannot be held responsible for any omission, mistake nor for any loss or damage including without limitation to any loss of profit which may arise from reliance on any information supplied by TFA Global Pte Ltd.
The speaker(s) is neither an employee, agent nor representative of Tradu and is therefore acting independently. The opinions given are their own, constitute general market commentary, and do not constitute the opinion or advice of Tradu or any form of personal or investment advice. Tradu neither endorses nor guarantees offerings of third-party speakers, nor is Tradu responsible for the content, veracity or opinions of third-party speakers, presenters or participants.


AUDUSD BUY
AUD/USD rises to near 0.6480 as accelerating Fed dovish bets weigh on US Dollar
The AUD/USD pair moves higher to near 0.6480 during the European trading session on Monday. The Aussie pair gains as demand for risk-perceived assets has increased, following an increase in market expectations that the Fed could resume its monetary expansion cycle in the September meeting
The AUD/USD currency pair, commonly known as the “Aussie”, represents how many US dollars (the quote currency) are needed to purchase one Australian dollar (the base currency). Alongside the New Zealand Dollar (NZD) and the Canadian Dollar (CAD), the AUD is considered a commodity currency due to Australia’s significant exports of raw materials such as precious metals, Oil, and agricultural products.
The Reserve Bank of Australia (RBA) has historically maintained higher interest rates compared to other industrialized nations. Combined with the relatively high liquidity of the AUD, this has made the AUD attractive for carry traders looking for higher yields.
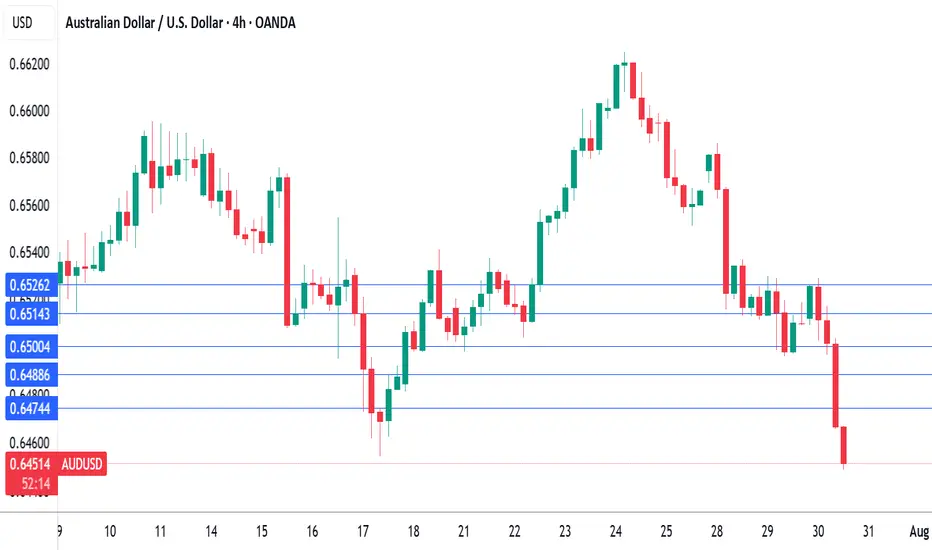
SUPPORT 0.64852
SUPPORT 0.65074
SUPPORT 0.65285
RESISTANCE 0.64498

Surely the RBA Must Cut Rates Now?The RBA defied expectations of a cut in July, despite soft trimmed mean inflation figures in the monthly CPI report. The quarterly figures have now dropped, which I suspect leaves little wriggle room to hold at 2.85% in August. I 6ake a look at the quarterly and monthly inflation prints that matter, then wrap up on AUD/USD.
Matt Simpson, Market Analyst at City Index and Forex.com

Australia inflation gauge hits 20-month high, Aussie gains grounThe Australian dollar has extended its gains on Monday. In the North American session, AUD/USD is trading at 0.6483 up 0.22% on the day. The US dollar made inroads last week against all the major currencies except the yen and gained 1.5% against the Australian dollar.
Australia's Melbourne Institute inflation guage soared 0.9% m/m in July, up sharply from 0.1% in June and marking the highest rise since Dec. 2023. The MI gauge, which provides a monthly guide to consumer inflation (official CPI is published quarterly), will no doubt raise concerns at the Reserve Bank of Australia, which has been cautious about cutting rates due to inflation worries.
Last week, CPI for the second quarter eased to 1.9%, down from 2.2% in Q1 and just below the central bank's target of 2%-3%. This cements a rate cut at the Aug. 12 meeting, after the RBA shocked the markets last month when it held rates. The markets had widely priced in a rate cut but the RBA defended its non-move, saying it wanted to see additional inflation data.
The week ended with a softer-than-expected US employment report. Nonfarm payrolls for July rose by only 73 thousand, missing the market estimate of 110 thousand. Adding to the bad news, the June and May reports were both revised sharply lower, down by a combined 258 thousand. The unemployment rate ticked higher to 4.2%, up from 4.1%.
The weak July reading and the downward revisions indicate that the labor market may be cooling more quickly than initially anticipated. The weak numbers support the case for the Fed to lower interest rates at the next rate meeting in September. The likelihood of a cut has climbed to 75%, compared to 63% on Thursday.
The soft jobs report should serve as a wake-up call regarding the effect of US tariffs on the economy, as the employment picture is worse than previously thought.

AUDUSD – Plan Ready for Both ScenariosWe're patiently waiting for price to reach our key zone. If we get a valid sell signal, we’ll take the short.
But if the market breaks above this level with strength and gives us a clean pullback, we’re ready to go long.
No guessing. No hoping. Just reacting to what the market shows us.
📌 Discipline over prediction.

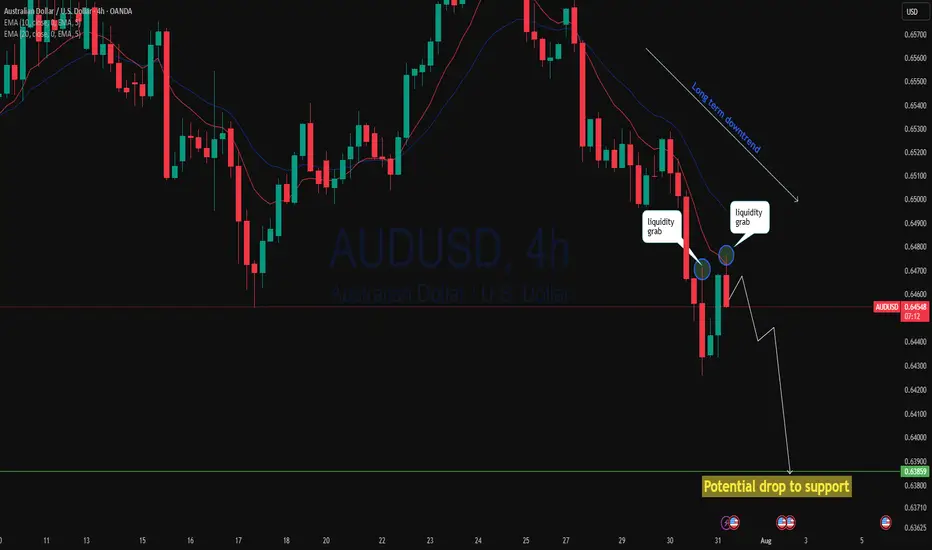
AUDUSD 2 step liquidity grab and drop?AUDUSD 4h has rejected twice from a key area after yesterday's massive breakdown with AUD negative data. Price has done a narrow pullback then this session is rejecting again with a stronger momentum could continue to drop to support. As 4h price action showing strong bearish move we may see continuation of the down trend!
AUD/USD ANALYSIS: WHERE ARE WE HEADED Good afternoon
Based on what we are saeeing with AUD/USD we see two options
1) Below .645 low then we can see a decent drop down to .635
2) If we can break the highs of .652 then a drive up to .65951 makes sense
Trade Smarter Live Better
Kris

AUDUSD – DAILY FORECAST Q3 | W31 | D30 | Y25📊 AUDUSD – DAILY FORECAST
Q3 | W31 | D30 | Y25
Daily Forecast 🔍📅
Here’s a short diagnosis of the current chart setup 🧠📈
Higher time frame order blocks have been identified — these are our patient points of interest 🎯🧭.
It’s crucial to wait for a confirmed break of structure 🧱✅ before forming a directional bias.
This keeps us disciplined and aligned with what price action is truly telling us.
📈 Risk Management Protocols
🔑 Core principles:
Max 1% risk per trade
Only execute at pre-identified levels
Use alerts, not emotion
Stick to your RR plan — minimum 1:2
🧠 You’re not paid for how many trades you take, you’re paid for how well you manage risk.
🧠 Weekly FRGNT Insight
"Trade what the market gives, not what your ego wants."
Stay mechanical. Stay focused. Let the probabilities work.
FX:AUDUSD

AUDUSD FORECASTLooking into the AUDUSD today, the market is really looking Nice. Waiting for the market to reach at the area of focus. Looking to take as a sell limit order waiting for the price to Liquidate then taking after gaining volume and power to push to the downside, it gives me the high probability to looking into this pair.

AUDUSD InsightHello to all subscribers.
Please share your personal opinions in the comments. Don’t forget to like and subscribe!
Key Points
- According to the U.S. June Job Openings and Labor Turnover Survey (JOLTS), the seasonally adjusted number of job openings was 7.437 million, a decrease of 275,000 from the previous month, falling short of the market expectation of 7.55 million.
- During high-level talks between the U.S. and China held in Stockholm, Sweden, both sides reportedly agreed to extend the tariff suspension measure for an additional 90 days.
- While the Federal Reserve is expected to hold rates steady in the July FOMC meeting, there is growing anticipation for a dovish stance suggesting a possible rate cut in September.
This Week's Major Economic Events
+ July 30: Germany Q2 GDP, U.S. ADP Nonfarm Employment Change (July), U.S. Q2 GDP, Bank of Canada rate decision, FOMC meeting results announcement
+ July 31: Bank of Japan rate decision, Germany July Consumer Price Index (CPI), U.S. June Personal Consumption Expenditures (PCE) Price Index
+ August 1: Eurozone July CPI, U.S. July Nonfarm Payrolls, U.S. July Unemployment Rate
AUDUSD Chart Analysis
The pair recently climbed above the 0.66000 level but has since reversed, giving back gains. However, both higher highs and higher lows are being established, suggesting the current pullback is part of a gradual uptrend. A continued bullish outlook is expected over the long term, with a projected high around the 0.69000 level.

AUDUSD(20250805)Today's AnalysisMarket News:
Goldman Sachs: The Federal Reserve is expected to cut interest rates by 25 basis points three times starting in September; a 50 basis point cut is possible if the unemployment rate rises further.
Technical Analysis:
Today's Buy/Sell Levels:
0.6470
Support and Resistance Levels:
0.6500
0.6489
0.6482
0.6459
0.6451
0.6440
Trading Strategy:
If the price breaks above 0.6470, consider buying, with the first target price at 0.6489. If the price breaks below 0.6459, consider selling, with the first target price at 0.6440.

XAUUSD and AUDUSD Analysis todayHello traders, this is a complete multiple timeframe analysis of this pair. We see could find significant trading opportunities as per analysis upon price action confirmation we may take this trade. Smash the like button if you find value in this analysis and drop a comment if you have any questions or let me know which pair to cover in my next analysis

AUDUSD: Great Trading Opportunity
AUDUSD
- Classic bearish pattern
- Our team expects retracement
SUGGESTED TRADE:
Swing Trade
Sell AUDUSD
Entry - 0.6475
Stop - 0.6480
Take - 0.6464
Our Risk - 1%
Start protection of your profits from lower levels
Disclosure: I am part of Trade Nation's Influencer program and receive a monthly fee for using their TradingView charts in my analysis.
❤️Please, support our work with like & comment!❤️

AUDUSD - Possible retracement/reversal to hourly 50 MA AUDUSD is making 5 week lows and is due for a retracement or possible reversal in a downtrend to a major Moving Average. Despite news of lowered interest rates reducing it's appeal, the market has likely already discounted it's lack of appeal into the recent decline.
Await confirmation of break of recent trendline as, given it's poor performance it could fall on lack of confidence to a major previous support level.
AUDUSD: Dropping To the Weekly FVG, As Expected!In this video, we will analyze the following FX market for July 31 - Aug 1st.
AUDUSD
Been waiting and watching for this move, and we've tracked it for weeks! It's happening now!
Look for it to continue until we reach the +FVG!
Enjoy!
May profits be upon you.
Leave any questions or comments in the comment section.
I appreciate any feedback from my viewers!
Like and/or subscribe if you want more accurate analysis.
Thank you so much!
Disclaimer:
I do not provide personal investment advice and I am not a qualified licensed investment advisor.
All information found here, including any ideas, opinions, views, predictions, forecasts, commentaries, suggestions, expressed or implied herein, are for informational, entertainment or educational purposes only and should not be construed as personal investment advice. While the information provided is believed to be accurate, it may include errors or inaccuracies.
I will not and cannot be held liable for any actions you take as a result of anything you read here.
Conduct your own due diligence, or consult a licensed financial advisor or broker before making any and all investment decisions. Any investments, trades, speculations, or decisions made on the basis of any information found on this channel, expressed or implied herein, are committed at your own risk, financial or otherwise.
