AUDUSD H4 I Bullish Bounce Off Based on the H4 chart analysis, the price is falling toward buy entry level at 0.6456, an overlap support.
Our take profit is set at 0.6493, a pullback resistance.
The stop loss is placed at 0.6429, a pullback support.
High Risk Investment Warning
Trading Forex/CFDs on margin carries a high level of risk and may not be suitable for all investors. Leverage can work against you.
Stratos Markets Limited (tradu.com ):
CFDs are complex instruments and come with a high risk of losing money rapidly due to leverage. 63% of retail investor accounts lose money when trading CFDs with this provider. You should consider whether you understand how CFDs work and whether you can afford to take the high risk of losing your money.
Stratos Europe Ltd (tradu.com ):
CFDs are complex instruments and come with a high risk of losing money rapidly due to leverage. 63% of retail investor accounts lose money when trading CFDs with this provider. You should consider whether you understand how CFDs work and whether you can afford to take the high risk of losing your money.
Stratos Global LLC (tradu.com ):
Losses can exceed deposits.
Please be advised that the information presented on TradingView is provided to Tradu (‘Company’, ‘we’) by a third-party provider (‘TFA Global Pte Ltd’). Please be reminded that you are solely responsible for the trading decisions on your account. There is a very high degree of risk involved in trading. Any information and/or content is intended entirely for research, educational and informational purposes only and does not constitute investment or consultation advice or investment strategy. The information is not tailored to the investment needs of any specific person and therefore does not involve a consideration of any of the investment objectives, financial situation or needs of any viewer that may receive it. Kindly also note that past performance is not a reliable indicator of future results. Actual results may differ materially from those anticipated in forward-looking or past performance statements. We assume no liability as to the accuracy or completeness of any of the information and/or content provided herein and the Company cannot be held responsible for any omission, mistake nor for any loss or damage including without limitation to any loss of profit which may arise from reliance on any information supplied by TFA Global Pte Ltd.
The speaker(s) is neither an employee, agent nor representative of Tradu and is therefore acting independently. The opinions given are their own, constitute general market commentary, and do not constitute the opinion or advice of Tradu or any form of personal or investment advice. Tradu neither endorses nor guarantees offerings of third-party speakers, nor is Tradu responsible for the content, veracity or opinions of third-party speakers, presenters or participants.
USDAUD trade ideas

Week of 6/15/25: AU AnalysisLast week took the prior week's high and showed large rejection. Expecting this week to take the weak low and liquidity from all the lows to at least the extreme of the daily swing.
Major news:
FOMC - Wednesday

Potential bearish drop?AUD/USD has reacted off the resistance level which is a pullback resistance and could drop from this level to our take profit.
Entry: 0.6498
Why we like it:
There is a pullback resistance level.
Stop loss: 0.6519
Why we like it:
There is a pullback resistance level.
Take profit: 0.6468
Why we like it:
There is a pullback support that is slightly above the 61.8% Fibonacci projection.
Enjoying your TradingView experience? Review us!
Please be advised that the information presented on TradingView is provided to Vantage (‘Vantage Global Limited’, ‘we’) by a third-party provider (‘Everest Fortune Group’). Please be reminded that you are solely responsible for the trading decisions on your account. There is a very high degree of risk involved in trading. Any information and/or content is intended entirely for research, educational and informational purposes only and does not constitute investment or consultation advice or investment strategy. The information is not tailored to the investment needs of any specific person and therefore does not involve a consideration of any of the investment objectives, financial situation or needs of any viewer that may receive it. Kindly also note that past performance is not a reliable indicator of future results. Actual results may differ materially from those anticipated in forward-looking or past performance statements. We assume no liability as to the accuracy or completeness of any of the information and/or content provided herein and the Company cannot be held responsible for any omission, mistake nor for any loss or damage including without limitation to any loss of profit which may arise from reliance on any information supplied by Everest Fortune Group.

AUDUSD - Medium term prediction - 16/06/25For AUD/USD here (0.6487) I’d peg the odds roughly at:
Rally above 0.6943 first ~60%
Drop below 0.6031 first ~40%
Why a tilt to the upside?
Higher-low structure: Since last year’s low near 0.594, price has formed progressively higher retracements (0.620 → 0.635 → 0.648).
Momentum: Daily candles have been predominantly bullish with shallow pullbacks, and there’s room before any clear overbought signals.
Mid‐range flip: The 0.6031 zone has held as support and the current range midpoint (~0.649) has been reclaimed on a sustained basis—suggesting buyers are in control through the mid‐band.

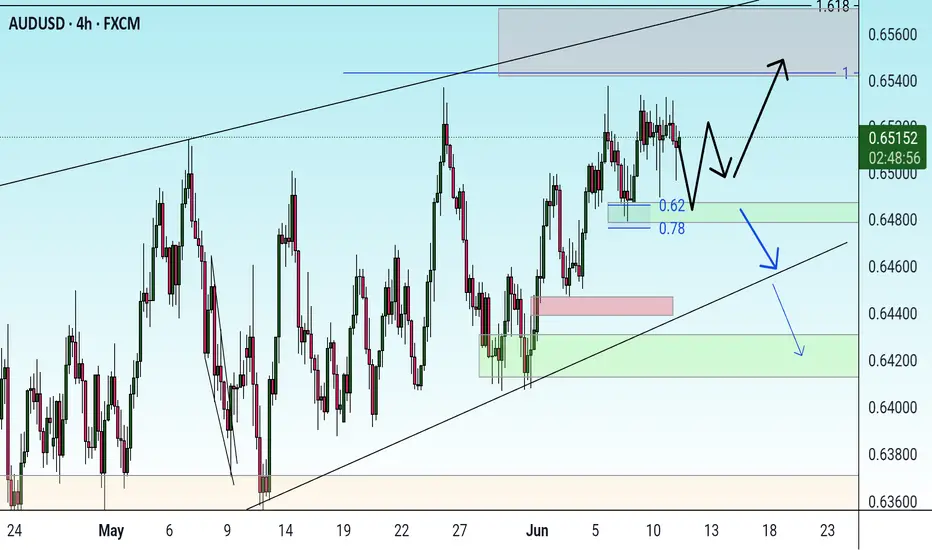
AUDUSD Coiling Near Key Resistance, Big Move Ahead?After a long period of sideways chop, AUD/USD is finally showing signs of strength. Price has been pressing against the key resistance zone, and we’re now seeing a tightening wedge breakout structure forming just beneath it.
A key moment on the chart is where sellers got trapped during that sharp downside wick. Since then, price has been recovering in a steady, controlled manner.
Now, with higher lows forming and momentum building near resistance, a parabolic move could be on the horizon if price manages to break out cleanly.
This is a classic setup where patience could pay off, the structure is bullish, and breakout confirmation may unlock strong upside potential.
DYOR, NFA

AUDUSDWe have a bullish market with a weaker dollar. Price currently retraced to our H4 demand zone after BOS but price induced some bullish moment to create some Liquidity. Now that price has mitigated both the Liquidity and Demand Zone. We should expect price continuation (Bullish)

SellSell!
AUDUSD continues to grow
A bullish trend and we are bullish
However, the bias is in the mid-range
The pair is locally overbought
So after the pair enters
The resistance area around 0.6510
On Monday we
Can lower the pair
0.6480 Take Profit
And 0.6516 Stop Loss

AUDUSD Potential UpsidesHey Traders, in the coming week we are monitoring AUDUSD for a buying opportunity around 0.64500 zone, AUDUSD is trading in an uptrend and currently is in a correction phase in which it is approaching the trend at 0.64500 support and resistance area.
Trade safe, Joe.

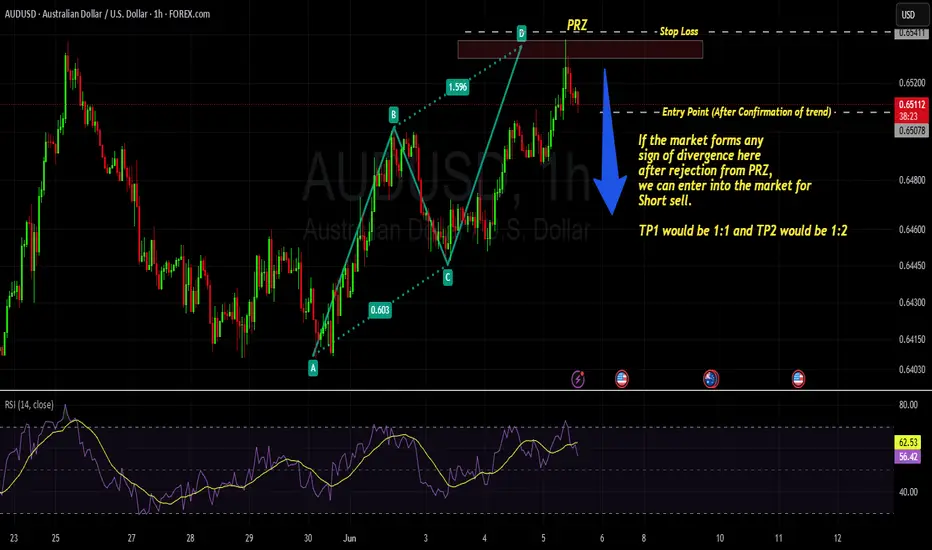
AUDUSD - AB=CD pattern - trend reversal AUDUSD has completed AB=CD pattern and it seems like market will take a reversal from here, we need to check if there is divergence. if YES, we can take entry on the 1st LH and LL followed by the break of HL.
entry and TP is planned / mentioned accordingly.
AUDNZDOn Audusd, we're in on a bullish market. we're looking at for a pullback to fibonacci levels, from anywhere between 71% to 100% for a continuation to the upside

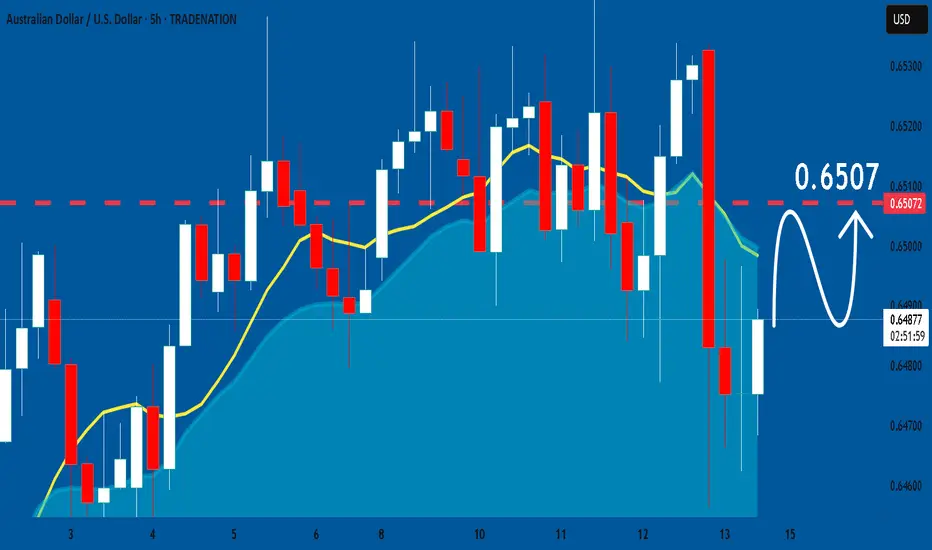
AUDUSD: Market Sentiment & Price Action
Looking at the chart of AUDUSD right now we are seeing some interesting price action on the lower timeframes. Thus a local move up seems to be quite likely.
Disclosure: I am part of Trade Nation's Influencer program and receive a monthly fee for using their TradingView charts in my analysis.
❤️ Please, support our work with like & comment! ❤️
AUD/USD at Critical Resistance — Bearish Outlook Below 0.65381. Major Resistance Zone: 0.65380
Price is currently testing a strong horizontal resistance level at 0.65380, a level that has been tested multiple times (as shown by the pink circles).
This level has acted as a historical turning point, which increases its significance.
2. Price Structure: Lower Highs and Equal Highs
The chart reveals a potential double top or distribution pattern, forming under the 0.65380 resistance.
This suggests weakening bullish momentum and increases the probability of a bearish reversal.
3. Projected Bearish Path (White Dotted Lines):
If price fails to break above 0.65380 decisively, the expected move is a stepwise decline.
The projected path targets several support levels:
0.65003
0.64647
0.64213
0.63957
Final target: 0.63627, a key support from early May.
4. Support & Resistance Zones:
Resistance Levels:
0.65380 (Major)
0.65003
Support Levels (Sequential Targets):
0.64647
0.64213
0.63957
0.63627
5. Confluence with Fundamentals:
U.S. economic events (highlighted at the bottom with calendar icons) may act as volatility triggers, potentially accelerating this move.
✅ Summary & Trading Implications:
Bias: Bearish below 0.65380
Trade Idea: Watch for rejection at resistance or break below 0.65003 for confirmation.
Bearish Targets: Gradual move toward 0.63627 with key pauses at intermediate support levels.
Invalidation: Daily close above 0.65380 would negate the bearish setup and open potential for new highs.

AUDUSDDOLLAR INDEX on a dramatic twist of reversal on friday june 13th 00;00 time asian session at demand floor 97.621.
dollar reclaims 98.360 by londom session putting pressures on EURUSD,AUDUSD ,USDJPY,GBPUSD ,NZDUSD.
3:00pm
USD
Prelim UoM Consumer Sentiment
53.5 52.2
USD
Prelim UoM Inflation Expectations
6.6%
The University of Michigan (UoM) Consumer Sentiment and Inflation Expectations data will influence the US Dollar Index (DXY) and Federal Reserve policy expectations based on whether the prints exceed or miss forecasts.
Scenario 1: Better-Than-Expected Data
Consumer Sentiment greater than 53.5 and Inflation Expectations > 6.6%:
DXY Reaction: Likely to rise as stronger sentiment and sticky inflation expectations reduce odds of near-term Fed rate cuts. Traders may price out dovish bets, supporting the dollar.
Fed Implications: Elevated inflation expectations (above 6.6%) would reinforce the Fed’s cautious stance, delaying rate cuts until late 2025 or 2026.
Key Levels: DXY could retest 99.206 –99.00 resistance.
Scenario 2: Worse-Than-Expected Data
Consumer Sentiment less than 53.5 and Inflation Expectations < 6.6%:
DXY Reaction: Likely to decline as softer sentiment and easing inflation fears boost bets on Fed rate cuts. Markets could price in a September cut more aggressively.
Fed Implications: Lower inflation expectations (e.g., 6.0–6.5%) would align with recent CPI/PPI cooling, giving the Fed confidence to ease policy sooner.
Key Levels: DXY may drop toward 97.954
Scenario 3: Mixed Data
Sentiment beats, inflation misses (or vice versa):
DXY Reaction: Range-bound or choppy. For example, higher sentiment but lower inflation could offset, keeping DXY in a range bound
Fed Implications: The Fed would emphasize the inflation component over sentiment, as price expectations directly influence policy.
Contextual Factors
Recent Trends: May’s UoM sentiment hit a 2025 low (50.8), while 1-year inflation expectations spiked to 7.3% (later revised to 6.6%). June’s data will test whether inflation fears are easing.
Fed’s Focus: The Fed views inflation expectations as critical to actual inflation trends. A sustained rise above 6% could delay cuts despite softer CPI/PPI.
Broader Risks: Trade tensions (Trump’s tariffs) and political pressure on the Fed add volatility to dollar dynamics.
Conclusion
The dollar’s reaction hinges most critically on inflation expectations. A print above 6.6% would signal lingering price pressures, bolstering the Fed’s hawkish resolve and supporting DXY. Conversely, a drop below 6.0% could accelerate dollar selling as markets bet on earlier easing. Traders should also watch for revisions to May’s inflation expectations (previously revised down from 7.3% to 6.6%), which could amplify volatility.
#audusd

correctionIt is expected that after some fluctuation and rise, a trend change will form in the specified resistance range and we will see the continuation of the downward trend.

AUDUSD shortPrice found resistance on previous resistance point, as well as 161.8% Fibonacci extension level.
#technicalanalysis #forex #audusd


Audusd 1h📅 June 11, 2025
📣 Forex Signal – AUD/USD
🧭 Timeframe, Setup & Zone:
1h (analysis), 30m (confirmation)
Price is testing a strong supply zone that has historically triggered sharp bearish reversals. This area aligns with the 88.6% Fibonacci retracement, often signaling exhaustion of bullish momentum. Candlestick structure shows weakening buying pressure, with upper shadows and diminishing volume. This sell limit setup targets a high-probability reversal zone with attractive risk-reward potential.
🎯 Setup:
Entry 0.65248
SL 0.65348 (−10.0 pips)
TP1 0.65103 (+14.5 pips) – scalping
TP2 0.64935 (+31.3 pips) – primary
TP3 0.64771 (+47.7 pips) – intraday
TP4 0.64586 (+66.2 pips) – swing
TP5 0.63945 (+130.3 pips) – extended
(RR: 1:1.4 / 3.1 / 4.8 / 6.6 / 13.0)
📊 Indicators (30m):
• RSI shows momentum flattening near the overbought zone, signaling potential reversal
• Stochastic is in overbought territory, preparing a bearish crossover – early signal of seller dominance
📰 Fundamentals & Sentiment:
• AUD remains under pressure from weak export data and concerns over China’s economic slowdown
• USD is steady ahead of tonight’s US CPI release – stronger inflation could boost USD demand
• Short-term sentiment favors USD strength, especially with supportive data
📌 Summary:
The entry zone is a key technical supply area, backed by bearish signals from both price action and indicators. With market sentiment leaning toward USD strength, this setup is ideal for a calculated sell limit strategy targeting both intraday and swing potential.
⚙️ Risk Management:
• Entry is active only upon touching 0.65248
• Max risk: 1–2% of total account balance
• Consider partial profit-taking starting at TP2
#audusd #sell

AUDUSD → Correction after a false breakout before growthFX:XAUUSD continues to rise amid uncertainty surrounding the dollar, which continues to consolidate. The currency pair is preparing to test resistance at 0.6537
The dollar is stuck in place due to market uncertainty. At the same time, the Australian dollar is strengthening and is ready to test the liquidity zone
Within the current trend, the currency pair is heading towards resistance and the liquidity zone. We opened far away, and as we move towards the target, the potential for further growth may end. A false breakout of 0.6537 could trigger a correction
Resistance levels: 0.6537
Support levels: 0.6509, 0.6479
A sharp move towards resistance without the possibility of further growth could cause a false breakout of 0.6537. Price consolidation below this level could trigger a correction before growth.
Best regards, R. Linda!

Sniper Smart money AUDUSD
💼 Pending Orders – AUD/USD
🟢 Buy Stop Order (Bullish Scenario – Breakout to the Upside)
Order Type: Buy Stop
Entry Price: 0.6515 (mid-zone of 0.6510–0.6520)
Stop Loss: 0.6494
Take Profit 1: 0.6545
Take Profit 2: 0.6575
Comment: Expecting a breakout above resistance with bullish continuation.
---
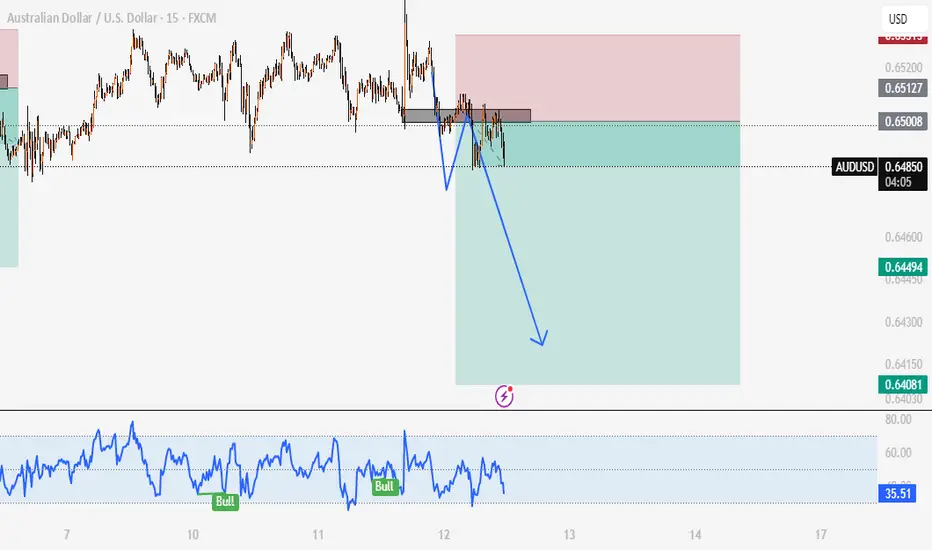
🔴 Sell Stop Order (Bearish Scenario – Breakdown Below Support)
Order Type: Sell Stop
Entry Price: 0.6489 (below the 0.6496 key support)
Stop Loss: 0.6506
Take Profit: 0.6444
Comment: If support breaks, a fast bearish move is likely.
---
📌 Risk Management Tip:
Risk per trade: 1–2% of account balance
Adjust position size according to SL/TP distance
Talion-promosale

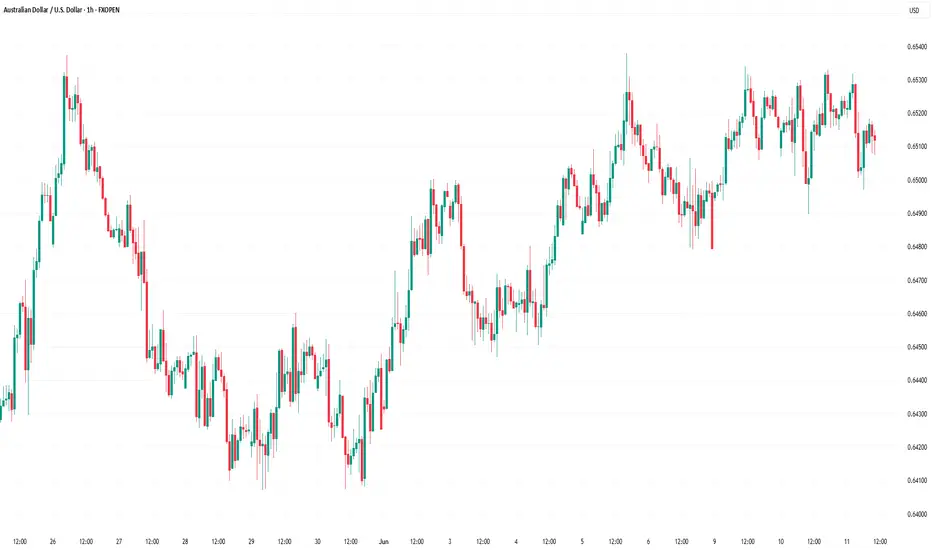
AUD/USD Aims Steady IncreaseAUD/USD Aims Steady Increase
AUD/USD started a decent increase above the 0.6450 and 0.6500 levels.
Important Takeaways for AUD USD Analysis Today
- The Aussie Dollar rebounded after forming a base above the 0.6400 level against the US Dollar.
- There is a connecting bullish trend line forming with support at 0.6510 on the hourly chart of AUD/USD at FXOpen.
AUD/USD Technical Analysis
On the hourly chart of AUD/USD at FXOpen, the pair started a fresh increase from the 0.6450 support. The Aussie Dollar was able to clear the 0.6500 resistance to move into a positive zone against the US Dollar.
There was a close above the 0.6500 resistance and the 50-hour simple moving average. Finally, the pair tested the 0.6535 zone. A high was formed near 0.6533 and the pair recently started a consolidation phase.
There was a move below the 0.6520 level. The pair dipped below the 23.6% Fib retracement level of the upward move from the 0.6489 swing low to the 0.6533 high.
On the downside, initial support is near the 0.6510 level. There is also a connecting bullish trend line forming with support at 0.6510. It is close to the 50% Fib retracement level of the upward move from the 0.6489 swing low to the 0.6533 high.
The next major support is near the 0.6480 zone. If there is a downside break below the 0.6480 support, the pair could extend its decline toward the 0.6450 level.
Any more losses might signal a move toward 0.6420. On the upside, the AUD/USD chart indicates that the pair is now facing resistance near 0.6535. The first major resistance might be 0.6550. An upside break above the 0.6580 resistance might send the pair further higher.
The next major resistance is near the 0.6600 level. Any more gains could clear the path for a move toward the 0.6650 resistance zone.
This article represents the opinion of the Companies operating under the FXOpen brand only. It is not to be construed as an offer, solicitation, or recommendation with respect to products and services provided by the Companies operating under the FXOpen brand, nor is it to be considered financial advice.

Check the trend A corrective and fluctuating trend is expected to form. Then there is a possibility of a trend change and the start of an uptrend. If the price breaks the green support zone, a continuation of the downtrend is likely.