AUD/USD Sentiment Sours (But There May Better Shorts)Asset managers increased their net-short exposure last week - and as these are 'real money' accounts, they are a group of traders worth listening to. But as always, timing as key, and there may be better setups for bears than AUD/USD over the near term. Today I pick out for AUD crosses to consider.
Matt Simpson, Market Analyst at City Index and Forex.com
USDAUD trade ideas

AUDUSD Testing Resistance—Clean Setup, Clear RiskPrice is approaching a familiar resistance zone and showing signs of exhaustion. I’m positioned for a short here, with a tight stop above recent highs. If price rejects cleanly, I’ll be targeting a drop back toward the moving average zone below.
Risk-to-reward lines up. Now we wait to see if the reaction holds.

AUDUSD Losing Bullish StrengthHi there,
AUDUSD appears stagnant around the 0.64556 level, which keeps the price confined within a bearish range.
The low point at 0.63928 supports bullish momentum toward the current high, but that high is losing bullish strength.
I anticipate a bearish continuation down to 0.64046, with a target bias of 0.63561.
Happy trading! Hope you have a great and fruitful week.
K.
Not trading advice

AUD's appeal boosted by rallying metals and yuan Following the dovish RBA rate cut on Tuesday, the AUD/USD has bounced back. The US dollar has fallen across the board, while the Aussie has been boosted by rallying prices of precious metals and a firmer yuan.
While equity markets have been relatively subdued, the commodities space has seen some notable action — particularly in precious metals. Platinum and palladium have each surged more than 10% this week, while silver is showing renewed strength after breaking out of a prolonged consolidation phase and climbing above its bearish trend line. Gold is also on the move, rising for the third consecutive session and reclaiming the $3,300 level.
With the AUD being sensitive to metals prices, this is clearly a bullish signal.
The AUD/USD itself has been consolidating its recent gains, as it potentially gears up for a breakout. Today it has more than made up for yesterday's mild losses that were driven in part by a dovish RBA. With resistance at 0.6460 broken, the AUD/USD could be heading to 0.6500 and beyond in the days ahead. Watch out for a breakout in this pair.
By Fawad Razaqzada, market analyst with FOREX.com

AUDUSD pair moving to bullish trend sooonAUDUSD chart showing divergence and I am taking my trade after candles created double bottom and I am booking my trade.

AudUsd Trade IdeaAU is currently sitting at a level that price has respected before. 15m shows price flipping from bullish to bearish but than flips back to bullish. I'll need to see the break and retest below 64370 in order to execute shorts on this pair. That would confirm price respecting the level of resistance once more and expect price to tap back into 63900. We'll see what happens.

IF THE SHOE FITS... AUDUSD SHORT FORECAST Q2 W21 D21 Y25AUDUSD SHORT FORECAST Q2 W21 D21 Y25
Professional Risk Managers👋
Welcome back to another FRGNT chart update📈
Diving into some Forex setups using predominantly higher time frame order blocks alongside confirmation breaks of structure.
Let’s see what price action is telling us today!
💡Here are some trade confluences📝
✅4H Order Block
✅Tokyo ranges to be filled
✅15' order block identified
✅Weekly 50 EMA
✅Daily 50 EMA
🔑 Remember, to participate in trading comes always with a degree of risk, therefore as professional risk managers it remains vital that we stick to our risk management plan as well as our trading strategies.
📈The rest, we leave to the balance of probabilities.
💡Fail to plan. Plan to fail.
🏆It has always been that simple.
❤️Good luck with your trading journey, I shall see you at the very top.
🎯Trade consistent, FRGNT X

AUDUSDascending channel with a three touch structure ..first touch middle section and the last touch to complete the move.

possibility of uptrendIt is expected that after some fluctuation and correction, the resistance level will be broken and the upward trend will continue.
If the price breaks the support levels and the support trend line, the continuation of the downward trend will be likely.


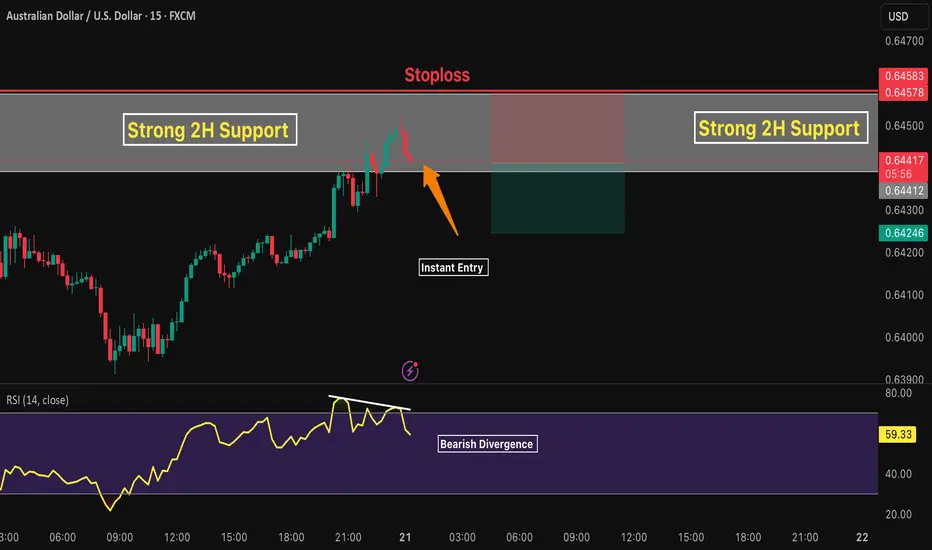
AUDUSD 15M 1: Bearish Divergence
2: Strong Resistance zone on 2H Timeframe.
3: Risk Reward Ratio 1:1
4: Entry point based on Cambist 15M
5: We could see an short term Downtrend
6: Stoploss placed above the Resistance zone
audusd sell signal. Don't forget about stop-loss.
Write in the comments all your questions and instruments analysis of which you want to see.
Friends, push the like button, write a comment, and share with your mates - that would be the best THANK YOU.
P.S. I personally will open entry if the price will show it according to my strategy.
Always make your analysis before a trade

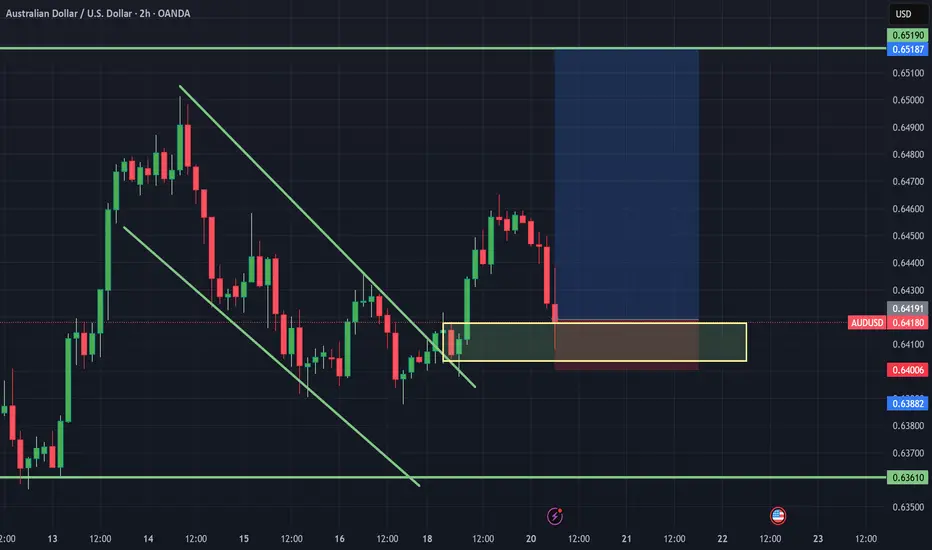
AU WAITING GAMEWill see how this one plays out. I believe we could start to see bullish push from the monthly support marked in blue. This should hold strong for longs.

Bearish reversal off pullback resistance?The Aussie (AUD/USD) is rising towards the pivot which is a pullback resistance and could reverse to the 1st support which acts as a pullback support.
Pivot: 0.6433
1st Support: 0.6391
1st Resistance: 0.6458
Risk Warning:
Trading Forex and CFDs carries a high level of risk to your capital and you should only trade with money you can afford to lose. Trading Forex and CFDs may not be suitable for all investors, so please ensure that you fully understand the risks involved and seek independent advice if necessary.
Disclaimer:
The above opinions given constitute general market commentary, and do not constitute the opinion or advice of IC Markets or any form of personal or investment advice.
Any opinions, news, research, analyses, prices, other information, or links to third-party sites contained on this website are provided on an "as-is" basis, are intended only to be informative, is not an advice nor a recommendation, nor research, or a record of our trading prices, or an offer of, or solicitation for a transaction in any financial instrument and thus should not be treated as such. The information provided does not involve any specific investment objectives, financial situation and needs of any specific person who may receive it. Please be aware, that past performance is not a reliable indicator of future performance and/or results. Past Performance or Forward-looking scenarios based upon the reasonable beliefs of the third-party provider are not a guarantee of future performance. Actual results may differ materially from those anticipated in forward-looking or past performance statements. IC Markets makes no representation or warranty and assumes no liability as to the accuracy or completeness of the information provided, nor any loss arising from any investment based on a recommendation, forecast or any information supplied by any third-party.

AUD/USD Struggles at Resistance- Moment of Truth for the BullsAussie has held below resistance for nearly five-weeks now with multiple breakout attempts failing at the 52-week moving average.
Weekly resistance now stands with the 2025 high-close / 50% retracement of the September decline at 6429/45 and is backed again by the yearly moving average, currently near ~6485. Critical resistance is eyed with the July close low / 61.8% retracement at 6511/50 and a breach / close above this threshold is needed to fuel the next leg of the advance towards the 2019 low at 6671.
Weekly support rests with the 38.2% retracement of the yearly range / 2025 low-week close at 6286/91. Note that the median-line converges on this zone over the next few weeks and a weekly close below would be needed to suggest a more significant high is in place. Subsequent support seen at 6143/79- a region defined by the 61.8% retracement and the 2024/2022 swing lows.
Bottom line : The Australian Dollar rally has been halted at resistance and the focus is on a breakout of this multi-week range just below. From a trading standpoint, losses would need to be limited to 6285 IF price is heading higher on this stretch with a close above the 52-week moving average needed to fuel the next leg of the advance.
-MB

Head and Shoulders An incomplete Head and Shoulders pattern appears to be forming, along with a prolonged consolidation. It can be assumed that if the price breaks above the consolidation range with a candlestick close and confirms with a retest, a strong upward movement may be expected. However, if there are any significant fundamental shifts in the market, the opposite scenario may occur.

AUDUSD: Bullish Forecast & Bullish Scenario
The recent price action on the AUDUSD pair was keeping me on the fence, however, my bias is slowly but surely changing into the bullish one and I think we will see the price go up.
Disclosure: I am part of Trade Nation's Influencer program and receive a monthly fee for using their TradingView charts in my analysis.
❤️ Please, support our work with like & comment! ❤️

AUDUSD Rejected From Supply Zone – Bearish Slide Incoming?The Aussie dollar (AUDUSD) is showing signs of weakness after repeated rejections at the 0.6470 supply zone. Price has struggled to break this area, forming a solid distribution pattern on the 1H chart. With momentum fading, the pair now looks poised for a potential downside move.
Technical Overview:
Strong Supply Zone: 0.6470 (marked by heavy distribution and LuxAlgo’s visible range)
Current Price: 0.6412
First Target (Support): 0.6221
Second Target (Demand Zone): 0.5986–0.5900
Bias: Bearish unless price breaks and closes above 0.6470 with strength
Confluences Supporting Bearish Outlook:
Prolonged sideways structure near supply = likely distribution
Multiple failed breakout attempts above 0.6470
AUD under pressure from commodity softness + stronger USD
Clean downside levels: 0.6221 (minor support), 0.5986 (major demand)
Trade Setup Idea:
Entry Zone: 0.6410–0.6440 (on rejection candles or breakdown)
Stop Loss: Above 0.6480
Targets:
1. TP1 – 0.6221
2. TP2 – 0.5986
R:R Potential: ~3R if both targets hit
Macro Watch:
Upcoming US data releases could fuel USD strength (FOMC, CPI)
Aussie impacted by China economic data and commodity demand outlook
---
Will AUDUSD collapse from here or surprise us with a breakout? Let me know your outlook in the comments!
---
#AUDUSD #Forex #BearishSetup #TechnicalAnalysis #LuxAlgo #PriceAction #SupplyAndDemand #TrendReversal #SwingTrading #VolumeProfile #USDEvents #ShortTrade

AUD/USD🔹Symbol: AUD/USD
🔹Price: 0.64550
🔹Stop loss: 0.64849
🔹Take profit 1: 0.64217
🔹Take profit 2: 0.63975
🔹Take profit 3: 0.63620
📊Check your chart before entering.
♦️Check before use to make sure there is no important news.

Recap: Predict 3 Pairs!! Today we will be going over the video I made yesterday and we will be looking at the trade I took and other opportunities on the other 2 Piars.

AUDUSD CASH RATE ON FOCUSHi Traders,
Here we looking for some Analysis for incoming cash rate and monetary policy statement on FX:AUDUSD .
The Reserve Bank of Australia is expected to cut interest rates by 25 basis points at its latest meeting from 4.10% previously to 3.85%. The governor's dovish follow-up remarks will weigh on the Aussie dollar.
Have a safe trade!!

AUDUSD BUY NOW!!!!AUDUSD price took out the buyside liquidity with a retest back into the demand zone and price made a sharp liquidity sweep am in now on buy holding till new highs above the BSL is created......
Aussie H4 | Falling toward an overlap supportThe Aussie (AUD/USD) is falling towards an overlap support and could potentially bounce off this level to climb higher.
Buy entry is at 0.6336 which is an overlap support.
Stop loss is at 0.6255 which is a level that lies underneath a pullback support and the 38.2% Fibonacci retracement.
Take profit is at 0.6499 which is a multi-swing-high resistance.
High Risk Investment Warning
Trading Forex/CFDs on margin carries a high level of risk and may not be suitable for all investors. Leverage can work against you.
Stratos Markets Limited (tradu.com):
CFDs are complex instruments and come with a high risk of losing money rapidly due to leverage. 63% of retail investor accounts lose money when trading CFDs with this provider. You should consider whether you understand how CFDs work and whether you can afford to take the high risk of losing your money.
Stratos Europe Ltd (tradu.com):
CFDs are complex instruments and come with a high risk of losing money rapidly due to leverage. 63% of retail investor accounts lose money when trading CFDs with this provider. You should consider whether you understand how CFDs work and whether you can afford to take the high risk of losing your money.
Stratos Global LLC (tradu.com):
Losses can exceed deposits.
Please be advised that the information presented on TradingView is provided to Tradu (‘Company’, ‘we’) by a third-party provider (‘TFA Global Pte Ltd’). Please be reminded that you are solely responsible for the trading decisions on your account. There is a very high degree of risk involved in trading. Any information and/or content is intended entirely for research, educational and informational purposes only and does not constitute investment or consultation advice or investment strategy. The information is not tailored to the investment needs of any specific person and therefore does not involve a consideration of any of the investment objectives, financial situation or needs of any viewer that may receive it. Kindly also note that past performance is not a reliable indicator of future results. Actual results may differ materially from those anticipated in forward-looking or past performance statements. We assume no liability as to the accuracy or completeness of any of the information and/or content provided herein and the Company cannot be held responsible for any omission, mistake nor for any loss or damage including without limitation to any loss of profit which may arise from reliance on any information supplied by TFA Global Pte Ltd.
The speaker(s) is neither an employee, agent nor representative of Tradu and is therefore acting independently. The opinions given are their own, constitute general market commentary, and do not constitute the opinion or advice of Tradu or any form of personal or investment advice. Tradu neither endorses nor guarantees offerings of third-party speakers, nor is Tradu responsible for the content, veracity or opinions of third-party speakers, presenters or participants.
