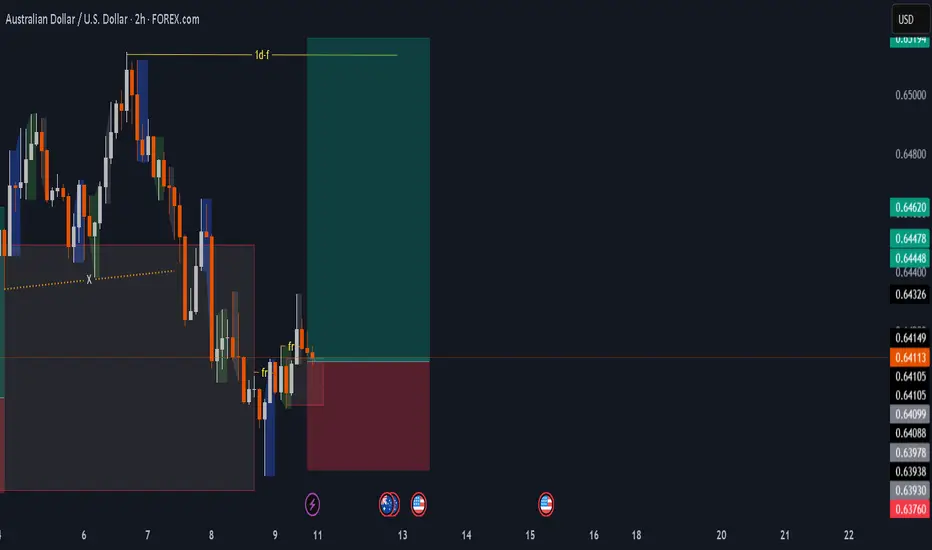
AUDUSD Bullish IdeaBullish Continuation
No prominent divergence
Entry at Fib level 0.382 = 0.64117
SL at previous HL = 0.63694
TP at 0.64843
Manage your risk reward accordingly
USDAUD trade ideas

AUDUSD Chart using support & Ressitance techniqueTaking my trading in AUDUSD chart using support and resistance technique.

AUDUSD Buy Setup- coming up next, look for AU buy
- enter only if entry setup given
- Refine entry with smaller SL for better RR, if you have the strategy
- try don't miss this
"I Found the Code. I Trust the Algo. Believe Me, That’s It."

short trade
🟥 Sellside Trade Log
📉 Pair: AUD/USD
🏷️ Type: Intraday | Tokyo Session AM
🧠 Setup: Breakdown from Ascending Channel
🆔 Trade ID: #AUDUSD
📅 Date: Monday, 12th May 2025
🕐 Time: 1:00 AM
🔹 Entry Price: 0.64382
🔹 Profit Target: 0.63714 (-1.04%)
🔹 Stop Loss: 0.64630 (+0.39%)
🔹 Risk-Reward Ratio: 2.69
🔍 Reasoning:
Sellside trade based on a breakdown below an ascending channel. Price failed to sustain support near the upper boundary and broke below the channel, signalling a shift in market structure. This setup confirmed the potential for a move lower, with entry positioned near the breakdown point, targeting the next level of support below the channel.

AUDUSD The Target Is UP! BUY!
My dear followers,
I analysed this chart on AUDUSD and concluded the following:
The market is trading on 0.6385 pivot level.
Bias - Bullish
Technical Indicators: Both Super Trend & Pivot HL indicate a highly probable Bullish continuation.
Target - 0.6401
About Used Indicators:
A super-trend indicator is plotted on either above or below the closing price to signal a buy or sell. The indicator changes color, based on whether or not you should be buying. If the super-trend indicator moves below the closing price, the indicator turns green, and it signals an entry point or points to buy.
Disclosure: I am part of Trade Nation's Influencer program and receive a monthly fee for using their TradingView charts in my analysis.
———————————
WISH YOU ALL LUCK

AUD/USD - Potential Buy Reentry H1 TFTechnical analysis based on Basic BBMA strategies( Bollinger Band and Moving Average). This is just a potential market projection where the market price can go. Trade wisely and good luck.

AUD/USD On the weekly timeframe, AUD/USD approached a previously tested resistance zone around 0.63926, marked by prior price interactions. On the 1-hour chart, the price broke out above this level, signaling bullish momentum. On the 15-minute chart, a backtest of the breakout level occurred, with the price retesting the 0.63926 zone, now acting as support, before continuing upward.
Trade Plan:
Entry: Entered a buy trade at 0.64072 after the backtest confirmation.
Take Profit (TP): Targeting 0.64352, aligning with the next significant resistance level.
Stop Loss (SL): Placed at 0.63926, just below the breakout level, to protect against a false breakout.
Risk-Reward Ratio (RR): The distance to TP is 280 pips (0.64352 - 0.64072), and the distance to SL is 146 pips (0.64072 - 0.63926), yielding an RR of approximately 1:1.9.
This AUD/USD trade capitalizes on a breakout and backtest strategy, offering a structured setup with a favorable risk-reward ratio for potential upside.

Market Analysis: AUD/USD Ready to Climb AgainMarket Analysis: AUD/USD Ready to Climb Again
AUD/USD is attempting a fresh increase from the 0.6370 support.
Important Takeaways for AUD/USD Analysis Today
- The Aussie Dollar found support at 0.6370 and recovered higher against the US Dollar.
- There was a break above a key bearish trend line with resistance at 0.6410 on the hourly chart of AUD/USD at FXOpen.
AUD/USD Technical Analysis
On the hourly chart of AUD/USD at FXOpen, the pair formed a base above 0.6420. The Aussie Dollar started a decent increase above the 0.6450 resistance against the US Dollar, as mentioned in the previous analysis.
The pair even cleared 0.6500 before there was a minor pullback. The recent low was formed at 0.6370 and the pair is again rising. The bulls pushed the pair above the 23.6% Fib retracement level of the downward move from the 0.6514 swing high to the 0.6370 low.
Besides, there was a break above a key bearish trend line with resistance at 0.6410. The pair is now consolidating above the 50-hour simple moving average. On the upside, the AUD/USD chart indicates that the pair is now facing resistance near the 0.6440 zone.
The first major resistance might be 0.6460 and the 61.8% Fib retracement level of the downward move from the 0.6514 swing high to the 0.6370 low. An upside break above the 0.6460 resistance might send the pair further higher. The next major resistance is near the 0.6515 level. Any more gains could clear the path for a move toward the 0.6550 resistance zone.
If not, the pair might correct lower. Immediate support sits near the 0.6410 level. The next support could be 0.6370. If there is a downside break below the 0.6370 support, the pair could extend its decline toward the 0.6320 zone. Any more losses might signal a move toward 0.6300.
This article represents the opinion of the Companies operating under the FXOpen brand only. It is not to be construed as an offer, solicitation, or recommendation with respect to products and services provided by the Companies operating under the FXOpen brand, nor is it to be considered financial advice.

Sell at 0.643Trading Journal Entry –
Trade Setup:
Currently executing a market sell as price is trading at an important resistance zone.
Rationale:
Analysis on the higher timeframes (H4/Daily) reveals that price is testing a major resistance area, previously respected as a strong turning point in the past. This level has acted as a key supply zone, where sellers have consistently entered the market and driven price lower. The current approach into this zone lacks strong bullish momentum, and there are early signs of rejection wicks and bearish candles forming at the top.
Additionally, the broader market context suggests the recent rally may be a corrective move within a longer-term downtrend. This adds confluence to the idea that the resistance zone could once again act as a ceiling, prompting a potential move to the downside.

Possibility of uptrend It is expected that the price will consolidate above the support level, then the upward trend will likely continue. Otherwise, if the support level is broken, the downward trend will continue to the next support levels.

12/05/2025 - AUDUSD - BEARISHBasis of Trade
Fundamental Bias: Bearish
H4 Bias: Bearish
H1 Bias: Bearish

Bullish continuation?The Aussie (AUD/USD) is falling towards the pivot and could bounce to the pullback resistance.
Pivot: 0.6331
1st Support: 0.6266
1st Resistance: 0.6497
Risk Warning:
Trading Forex and CFDs carries a high level of risk to your capital and you should only trade with money you can afford to lose. Trading Forex and CFDs may not be suitable for all investors, so please ensure that you fully understand the risks involved and seek independent advice if necessary.
Disclaimer:
The above opinions given constitute general market commentary, and do not constitute the opinion or advice of IC Markets or any form of personal or investment advice.
Any opinions, news, research, analyses, prices, other information, or links to third-party sites contained on this website are provided on an "as-is" basis, are intended only to be informative, is not an advice nor a recommendation, nor research, or a record of our trading prices, or an offer of, or solicitation for a transaction in any financial instrument and thus should not be treated as such. The information provided does not involve any specific investment objectives, financial situation and needs of any specific person who may receive it. Please be aware, that past performance is not a reliable indicator of future performance and/or results. Past Performance or Forward-looking scenarios based upon the reasonable beliefs of the third-party provider are not a guarantee of future performance. Actual results may differ materially from those anticipated in forward-looking or past performance statements. IC Markets makes no representation or warranty and assumes no liability as to the accuracy or completeness of the information provided, nor any loss arising from any investment based on a recommendation, forecast or any information supplied by any third-party.

Week of 5/11/25: AUDUSD AnalysisDaily is bullish, so in the future price possibly will trend up.
In the meantime 4h and 1h are bearish but has reached a critical daily demand zone at the extreme of daily structure.
So far 1h internal is bullish, so we are still looking for longs cautiously until structure is broken.
Major news:
China trade talks - Monday
CPI - Tuesday
PPI/Unemployment - Thursday

AUDUSD LONG FORECAST Q2 W20 D12 Y25AUDUSD LONG FORECAST Q2 W20 D12 Y25
Professional Risk Managers👋
Welcome back to another FRGNT chart update📈
Diving into some Forex setups using predominantly higher time frame order blocks alongside confirmation breaks of structure.
Let’s see what price action is telling us today!
💡Here are some trade confluences📝
✅Daily order block rejection
✅15’ order block identified
✅Tokyo ranges to be filled
✅Intraday bullish breaks of structure to be confirmed
🔑 Remember, to participate in trading comes always with a degree of risk, therefore as professional risk managers it remains vital that we stick to our risk management plan as well as our trading strategies.
📈The rest, we leave to the balance of probabilities.
💡Fail to plan. Plan to fail.
🏆It has always been that simple.
❤️Good luck with your trading journey, I shall see you at the very top.
🎯Trade consistent, FRGNT X

Potential bearish drop?AUD/USD is reacting off the resistance level which is an overlap resistance that lines up with the 38.2% Fibonacci retracement and could drop from this level to our take profit.
Entry: 0.6431
Why we like it:
There is an overlap resistance that lines up with the 38.2% Fibonacci retracement.
Stop loss: 0.6349
Why we like it:
There is a pullback support level.
Take profit: 0.6349
Why we like it:
There is a pullback support level.
Enjoying your TradingView experience? Review us!
Please be advised that the information presented on TradingView is provided to Vantage (‘Vantage Global Limited’, ‘we’) by a third-party provider (‘Everest Fortune Group’). Please be reminded that you are solely responsible for the trading decisions on your account. There is a very high degree of risk involved in trading. Any information and/or content is intended entirely for research, educational and informational purposes only and does not constitute investment or consultation advice or investment strategy. The information is not tailored to the investment needs of any specific person and therefore does not involve a consideration of any of the investment objectives, financial situation or needs of any viewer that may receive it. Kindly also note that past performance is not a reliable indicator of future results. Actual results may differ materially from those anticipated in forward-looking or past performance statements. We assume no liability as to the accuracy or completeness of any of the information and/or content provided herein and the Company cannot be held responsible for any omission, mistake nor for any loss or damage including without limitation to any loss of profit which may arise from reliance on any information supplied by Everest Fortune Group.

AUDUSD Short Sell Entry To Support (Next Week)AUDUSD: Short sell entry, i expect retracement of sell side wicks down to the nearest significant level, circled on the left.

AUDUSD Bearish Breakout – Macro and Technicals AlignAUDUSD has broken below a rising wedge formation on the 4H chart, signaling a bearish continuation. With the Reserve Bank of Australia pausing rates and weak local data weighing on sentiment, while the Federal Reserve maintains a hawkish hold due to sticky labor costs, this trade sets up well both technically and fundamentally. I'm watching for downside continuation toward 0.6379 and potentially 0.6350. The bearish bias is invalidated on a move above 0.6475.
🔍 Technical Analysis
Structure: Price broke down from a rising wedge and continues forming bear flags — each followed by further selling pressure.
Current Price Action:
Rejected sharply at ~0.6475 (last swing high)
Confirmed breakout with downside momentum
Key Support Levels:
0.6379 – minor structural support
0.6350 – major support zone from April
Resistance / Invalidation:
Above 0.6475 – would break the bearish structure and negate the setup
Bias: Bearish — clean structure, breakout momentum, and sustained lower highs
🌏 Fundamental Context
🇦🇺 Bearish AUD Drivers:
Weak domestic data:
Building Approvals: -8.8% vs -1.7% forecast
RBA on hold:
No rate hike in sight; cautious due to housing and China concerns
China slow-down:
PBOC cut rates and reduced reserve requirements — signals broader economic softness
🇺🇸 Bullish USD Drivers:
Fed holding firm:
Benchmark rate held at 4.25–4.50%
Labor costs surged +5.3% q/q
Productivity dropped -0.4%, reinforcing inflation concerns
Market repricing rate cuts:
Cuts now expected later in 2025 or even 2026
Political pressure from Trump:
Despite attacks on Jerome Powell, Fed appears unmoved
Trump teasing a “major trade deal” — potentially USD-positive if credible
🎯 Trade Setup
Entry Area: Watching 0.6420–0.6435 as a pullback zone for potential shorts
Target Levels:
First target: 0.6379
Second target: 0.6350
Stop Loss: Placed above 0.6475 (last swing high) to protect against false breakouts
Trade Thesis:
Technical structure supports downside continuation
Macro fundamentals favor USD strength and AUD weakness
Clean reward-to-risk if structure holds
🧭 Conclusion
AUDUSD setup is supported by a strong confluence of technical breakdown and macro divergence. With the Fed staying firm and the RBA cautious amid weak data, the fundamentals validate the bearish trend. As long as price stays below 0.6475, the outlook remains bearish, with 0.6379 and 0.6350 as the next logical levels. Caution around U.S. data releases or trade deal news is advised, but the path of least resistance remains downward.

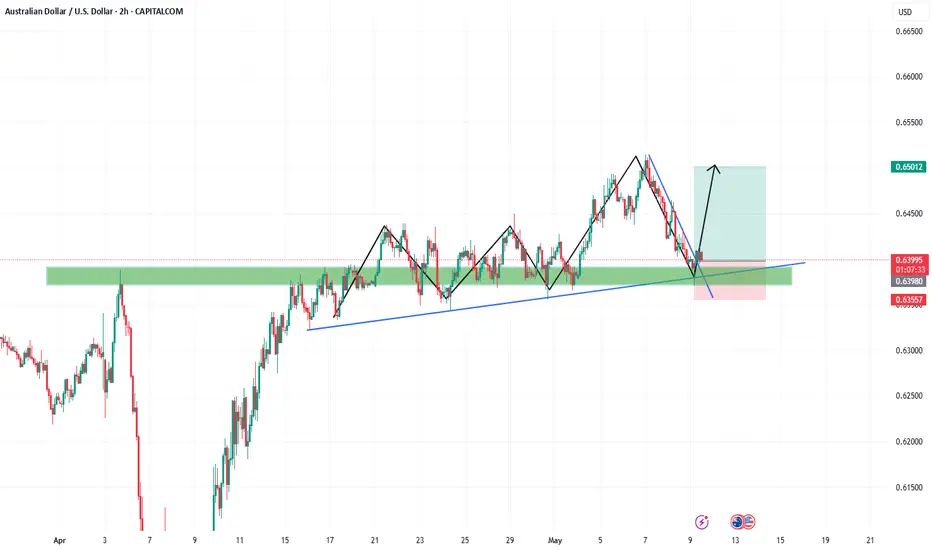
AUDUSDTHe overall structure of AUDUSD is bullish in 1d.
And the fractals structure is bullish as well in 1d .
2hr gave dble fractals break after price tapping on 1d supply .
So there is high chances price will go up. 1st entry which is shown is swing
another setup I will look for will be in 15 min
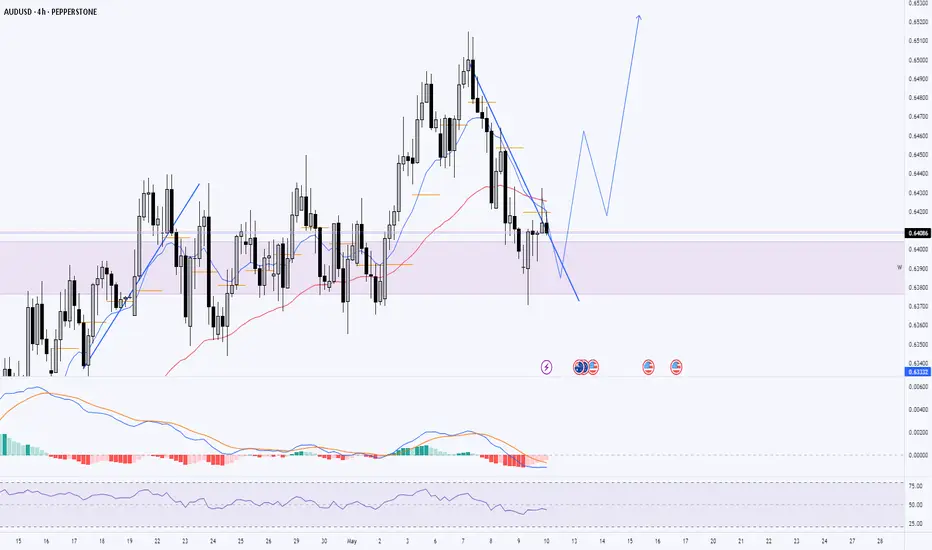
AUDUSD Buy Trade IdeaOverview:
AUDUSD has broken above a key weekly resistance level and is now holding above it, turning the level into support. This suggests a potential shift in higher timeframe structure.
Daily Chart:
The daily chart shows a clear breakout above the weekly resistance zone, followed by a healthy retracement back to retest the new support. Price action is respecting this level so far, reinforcing bullish bias.
4H Chart:
Despite the higher timeframe bullish structure, the 4H chart remains in a short-term downtrend. However, selling momentum is showing signs of exhaustion—with smaller candles, wicks to the downside, and slowing RSI/MACD signals.
I will wait for a trendline break or a higher low formation to confirm the end of this pullback before entering a buy.
Plan:
✅ Bias: Bullish
🔍 Entry: After confirmation of 4H downtrend break
🎯 Targets: Next resistance zones on daily
📉 Invalidation: If price closes back below weekly support
AUDUSD BEARISH(SELL) TECHNICAL SCENARIO.AUD/USD Market Analysis Scenario
Pair: AUD/USD
Bias: Bearish
Entry Consideration: Upon confirmation of rejection or reversal near the resistance zone.
Key Levels
Resistance: 0.64960 (critical supply zone)
1st Target: 0.64200
Final Target: 0.63800
Technical Scenario
The AUD/USD pair is currently trading below a strong resistance at 0.64960, which has acted as a key reversal zone in the recent past. Price action near this level indicates a potential bearish reversal pattern, such as a bearish engulfing, double top, or rejection wicks on higher time frames (H4 or D1).
If the pair fails to break above 0.64960, we can expect a downward movement toward the first support target at 0.64200, where minor demand might provide temporary consolidation. If bearish momentum continues, the pair could head further down to the final target at 0.63800, a previous swing low and stronger demand area.

AUDUSD: Channel Down aiming higher.AUDUSD is neutral on its 1D technical outlook (RSI = 53.946, MACD = 0.004, ADX = 53.336) trading between the 1D MA200 and 1D MA50. It is now on the middle (0.5 Fibonacci level) of the long term Channel Down and every bullish wave touched at least the 0.236 Fib. The trade is long, TP = 0.66200.
## If you like our free content follow our profile to get more daily ideas. ##
## Comments and likes are greatly appreciated. ##


AUDUSD BUY/LONGBy utilizing Fibonacci retracement levels, historical patterns, , we can formulate a hypothesis that the market might follow a similar trajectory if bullish sentiment prevails.