AUDUSD BEARISH Technically:
AUDUSD printing bearish divergence
AUDUSD printing double top
AUDUSD respecting bearish trendline
USDAUD trade ideas

check the trendConsidering the price behavior at the current resistance level, possible scenarios have been identified. As long as the price fluctuates above the 38.2% level, the upward trend is likely to continue.

AUDUSD V-Reversal: Short-Term Dip Before the Next Push?AUDUSD’s sharp V-shaped recovery suggests another pullback toward the channel low before bulls step back in — momentum still favors upside after a healthy reset.

AUDUSD - BULL FLAG (Bullish)🧠 Technical Overview
Pair: AUD/USD
Timeframe: 4H
Current Price: ~0.63864
General Structure:
Strong prior uptrend leading into a consolidation phase.
Price is forming a classic bull flag pattern (bullish continuation).
Fibonacci extension levels are plotted from the recent impulse leg to project targets.
🔥 Pattern Analysis
Bull Flag:
Parallel, downward-sloping channel following a strong bullish move, indicating healthy retracement.
Price is currently testing the upper boundary of the flag (~0.6394).
Breakout Plan:
Break and close above the flag resistance would confirm bullish continuation.
Immediate target lies at 0.6508 (previous structure high and 1.0 Fibonacci extension).
Higher Fibonacci extension targets are located at:
1.618 Fib ≈ 0.6553
2.0 Fib ≈ 0.6573
2.618 Fib ≈ 0.6622
🔍 Indicators
(Indicators not shown in the image, but inferred from price action):
A breakout supported by higher volume would strengthen confirmation.
RSI pushing above 60 would further confirm bullish momentum.
🧩 Summary
Bias: Bullish
Key triggers:
A strong breakout and close above 0.6394–0.6400.
Retest and continuation move would offer a more conservative entry.
Risk:
Caution required if breakout occurs on low volume.
Invalidation of the setup if price falls below 0.6380 (flag base) or decisively below 0.6318 (key structural support).
✍️ Quick Trade Plan Example
Setup Details
Entry Break and close above 0.6400
Stop Loss Below 0.6380 (or tighter below 0.6368)
Take Profit 1 0.6508
Take Profit 2 0.6553
Take Profit 3 0.6622
Final tip:
If price breaks out impulsively, aggressive entries can be considered. If the breakout is slow and grinding, it would be safer to wait for a pullback and a confirmed bullish rejection.

Buy audusdStrong buy expected
More bullish correction coming
Monthly still following the zone and breksing all high levels on daily chart

AUDUSD Short Idea R/R 3,67Buyers are not strong enough and Tariff tension is a little bit lower.
My bias is now to short.
EP 0,64085
SL 0,64887
TP1 0,62047
TP2 0,60711
R/R 3,67
The TP1 is hte Fibo 0,5.
The TP 2 is the Imbalance and also close to the 0,786 Fibolevel.

AUDUSDAUD/USD Trade Directional Bias and Central Bank Impact
Current AUD/USD Overview (April 2025)
AUD/USD is will face 0.65362 a critical resistance zone which is also a break of demand floor ,after the weekly candle breaks 0.63675 that has capped gains throughout 2025. The pair faces mixed signals from central bank policies, technical levels, and geopolitical risks. Below is a breakdown of key drivers:
Central Bank Leaders and Policy Outlook
RBA Michele Bullock Cautiously dovish: Held rates at 4.10% in April but signaled openness to cuts if inflation eases. Prioritizes data dependency amid U.S. tariff uncertainty, RBA next meeting will be 7 May 2025 ) Rate cuts (expected in May/July) could weaken AUD.
Fed Jerome Powell Under political pressure: Trump criticizes Powell for "keeping rates too high." Markets price in 2025 rate cuts if U.S. inflation cool.the next fed meeting will be 14–15 May 2025 (Next FOMC) ,if feds remains Dovish ,Fed shifts would weaken USD, boosting AUD/USD.
Key Economic Calendar Events
RBA Meetings (7 May, 18 June, 6 August)
A 25 bps cut is 80% priced for May and fully priced for July.
Bullock’s cautious tone suggests cuts depend on inflation and tariff impacts.
U.S. Inflation Data (10 May, 12 June)
Softer CPI/PPI could accelerate Fed rate cuts, weakening USD.
U.S.-China Trade Developments
Escalating tariffs (e.g., Trump’s 10% levy on Australian imports) risk AUD downside, but de-escalation could boost risk sentiment.
Conclusion
AUD/USD’s bias leans cautiously bullish if Fed dovishness outweighs RBA easing, but bearish risks persist from tariff tensions and RBA cuts. Key levels to watch:
Monitor speeches by Bullock (RBA) and Powell (Fed), along with U.S. inflation data and RBA meeting outcomes, for directional cues.

My Thoughts #002Here is an idea 💡
I just think the pair is set to push Lower...
Because the pair then went and made a Choch and meaning that we are moving from bullish pattern to bearish pattern
Anything could invalidate my set up
So use proper risk management
Let's do the most

AUDUSD in SHORT POSITION.Entered short position after spotting a prominent bearish divergence.
.Confirmed double top formation for added confluence.
.Market has already formed Lower High (LH) and/or Lower Low (LL).
.Conditions aligned and ready for short positioning.

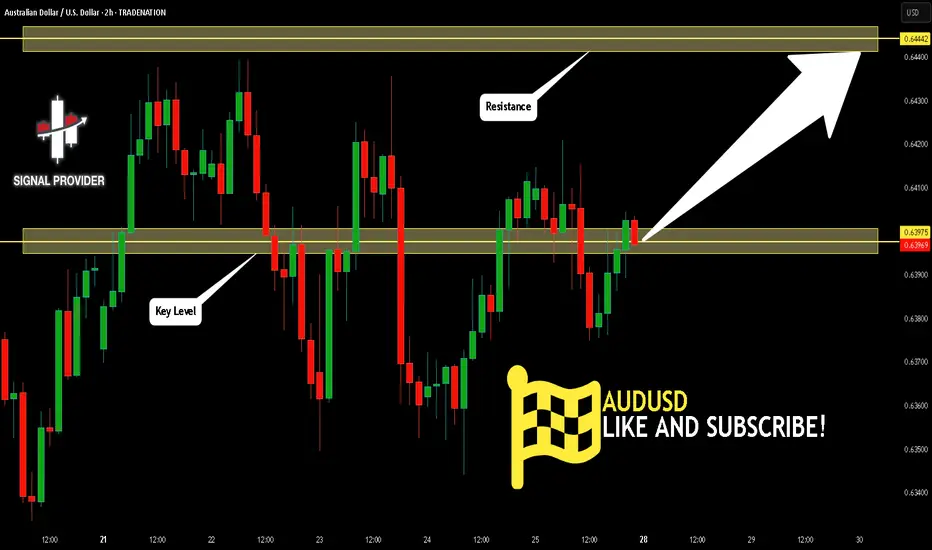
AUDUSD Will Move Higher! Buy!
Take a look at our analysis for AUDUSD.
Time Frame: 2h
Current Trend: Bullish
Sentiment: Oversold (based on 7-period RSI)
Forecast: Bullish
The market is testing a major horizontal structure 0.639.
Taking into consideration the structure & trend analysis, I believe that the market will reach 0.644 level soon.
P.S
The term oversold refers to a condition where an asset has traded lower in price and has the potential for a price bounce.
Overbought refers to market scenarios where the instrument is traded considerably higher than its fair value. Overvaluation is caused by market sentiments when there is positive news.
Disclosure: I am part of Trade Nation's Influencer program and receive a monthly fee for using their TradingView charts in my analysis.
Like and subscribe and comment my ideas if you enjoy them!
AUDUSD: B+ tradeA page from my trading journal. Please take it with a grain of salt, as I’m still learning and growing 🌟
B+ -> A only if 4H gives a strong bear reversal bar + trendline break

AUUSD Weekly Forecast
"AUUSD Weekly Forecast
Get ready for a potential swing trade!
Waiting for:
Sell-side liquidity to be taken
Stop hunt to play out
Then, we'll be looking for a LONG-TERM BULLISH reversal!
Stay tuned for updates and get ready to ride the trend!
#AUDUSD #WeeklyForecast #SwingTrade #TradingView #MarketAnalysis"

AUD/USD For Bearishyou can go short now
or
wait for pull-back near by entry point and then go short
general trend is up trend
current phase is pull-back
AUD under pressure
have fun :)

AUDUSD INTRADAY bullish breakout AUDUSD maintains a bullish bias, supported by the prevailing upward trend. Recent intraday movement indicates a corrective pullback toward a key consolidation zone, offering a potential setup for trend continuation.
Key Support Level: 0.6355 – previous consolidation range and pivotal support
Upside Targets:
0.6470 – initial resistance
0.6500 and 0.6550 – extended bullish targets on higher timeframes
A bullish breakout from 0.6355 would suggest continuation of the uptrend, confirming buying momentum.
However, a decisive reversal and daily close below 0.6355 would invalidate the bullish structure, opening the door for further retracement toward 0.6310, with additional support at 0.6235 and 0.6195.
Conclusion
AUDUSD remains bullish above 0.6355. A bounce from this level supports further gains. Traders should watch for confirmation signals before positioning for the next move.
This communication is for informational purposes only and should not be viewed as any form of recommendation as to a particular course of action or as investment advice. It is not intended as an offer or solicitation for the purchase or sale of any financial instrument or as an official confirmation of any transaction. Opinions, estimates and assumptions expressed herein are made as of the date of this communication and are subject to change without notice. This communication has been prepared based upon information, including market prices, data and other information, believed to be reliable; however, Trade Nation does not warrant its completeness or accuracy. All market prices and market data contained in or attached to this communication are indicative and subject to change without notice.

AUDUSD(20250425)Today's AnalysisMarket news:
Federal Reserve-①Hamack: If economic data is clear, the Fed may cut interest rates in June
②Waller: It will take until July to get a clearer understanding of how tariffs affect the economy. If tariffs lead to higher unemployment, interest rate cuts may be initiated. ③The Atlanta Fed GDPNow model predicts that the US GDP growth rate in the first quarter will be -2.5%. ④Kashkari: The frequent announcements from Washington have brought challenges to policymakers and everyone.
Technical analysis:
Today's buying and selling boundaries:
0.6387
Support and resistance levels:
0.6454
0.6429
0.6413
0.6361
0.6344
0.6319
Trading strategy:
If the price breaks through 0.6413, consider buying, the first target price is 0.6429
If the price breaks through 0.6387, consider selling, the first target price is 0.6361

AUDUSD BEARISH SETUP SELL!!!Based of my analysis on the pair I see it going lower, as I have confirmed with a few factors which I would state now..
First of all you can clearly observe a head and shoulder chart pattern in formation..
Second being a FVG zone was respected and price didn't close above the zone...
Third being the creation of new lower highs and lower lows..
#FOREXPAID
#PIPSPAYTHEBILLS
#FXSTORM

AUDUSD SHORT FORECAST 5' ORDER BLOCK Q2 W17 D25 Y25 AUDUSD SHORT FORECAST Q2 W17 D25 Y25
Professional Risk Managers👋
Welcome back to another FRGNT chart update📈
Diving into some Forex setups using predominantly higher time frame order blocks alongside confirmation breaks of structure.
Let’s see what price action is telling us today!
💡Here are some trade confluences📝
✅Weekly 50 EMA
✅Intraday bearish breaks of structure
✅Tokyo ranges to be filled
✅5' order block point of interest
✅Previous daily candle bearish close
🔑 Remember, to participate in trading comes always with a degree of risk, therefore as professional risk managers it remains vital that we stick to our risk management plan as well as our trading strategies.
📈The rest, we leave to the balance of probabilities.
💡Fail to plan. Plan to fail.
🏆It has always been that simple.
❤️Good luck with your trading journey, I shall see you at the very top.
🎯Trade consistent, FRGNT X

AUDUSD SHORT FORECAST Q2 W17 D25 Y25AUDUSD SHORT FORECAST Q2 W17 D25 Y25
Professional Risk Managers👋
Welcome back to another FRGNT chart update📈
Diving into some Forex setups using predominantly higher time frame order blocks alongside confirmation breaks of structure.
Let’s see what price action is telling us today!
💡Here are some trade confluences📝
✅Weekly 50 EMA
✅Intraday bearish breaks of structure
✅Tokyo ranges to be filled
✅Daily highs rejection
✅Previous daily candle bearish close
🔑 Remember, to participate in trading comes always with a degree of risk, therefore as professional risk managers it remains vital that we stick to our risk management plan as well as our trading strategies.
📈The rest, we leave to the balance of probabilities.
💡Fail to plan. Plan to fail.
🏆It has always been that simple.
❤️Good luck with your trading journey, I shall see you at the very top.
🎯Trade consistent, FRGNT X

AUDUSD - ShortLooking at targeting the low of the 4HR FVG.
Price swept the liquidity and broke to the downside, created a 1hr fvg (very small). Entry should have been on that FVG but missed the gap and watched the retraced and saw a 5min break in structure and FVG.
Pretty identical set up to the last one i posted this week on this pair

check the trendThe correction trend is expected to continue to the specified support levels. Then there is a possibility of a trend change and the start of an upward trend.

Long on USD/AUDI am longing USD/AUD from 1.5750
Target 1 - 1.6050
Target 2 - 1.63
I believe we have completed an Elliot wave structure and expect to see upside from this location.
In addition, the stochastic RSI on the daily time frame is oversold.

AUDUSD Trade Setup – Bearish Continuation in Play?Been monitoring AUDUSD closely since yesterday’s drop following the US news.
Price action has shown a solid bearish impulse, and I'm now anticipating a continuation to the downside. I'm particularly eyeing the 0.63877 USD zone for a bearish retest.
🔍 Plan:
Waiting for a confirmation candle around the 0.63877 area.
Watching the 9AM (UK time) candle close for signs of rejection.
Potential short setup after 10AM, aligning with the fresh H4 candle opening.
Patience is key — looking to trade only with confirmation.
📌 These are my personal views — not financial advice.

AUDUSD is now in Bearish Mode.AUDUSD is in Bearish Mode as it has started printing LH and LL. good time for short trade.
