USDCAD Forecast: Key Levels in SightFollowing softer Canadian CPI data, the Bank of Canada held interest rates steady at 2.75%, sending USDCAD toward the 1.3820 support level — an area that aligns with the November 2024 lows and a key resistance zone extending back to the highs of September 2022.
The 1.3820 low aligns with the 0.272 Fibonacci retracement of the uptrend from May 2021 to January 2025. This support also coincides with RSI levels not seen since 2021.
A sustained hold and reversal from this zone may push the pair toward 1.4040, 1.4150, 1.4350, and eventually 1.4500. On the downside, a firm break below 1.3820 could open losses toward 1.3670, 1.3570,1.3430, and 1,3270.
Written by Razan Hilal, CMT
USDCAD.PRO.OTMS trade ideas

USDCAD FORCAST BULLISH 100PIPSThe USDCAD pair could be poised for a 100-pip bullish move based on current technical and fundamental factors. Here’s the analysis:
Key Reasons for a Bullish Outlook:
Technical Setup:
Support Holding: If USDCAD is bouncing off a key support level (e.g., 1.3500 or 1.3600), a rebound toward 1.3700-1.3750 (+100 pips) is possible.
RSI/Oversold Bounce: If the RSI was near 30 (oversold), a reversal could trigger a short-term rally.
Break of a Downtrend Line: A breakout above a descending trendline could signal bullish momentum.
Fundamental Drivers:
Stronger USD: If the Fed maintains a hawkish stance (delaying rate cuts), the USD could strengthen.
Weaker CAD: If oil prices decline (CAD is oil-linked) or Canadian economic data disappoints, USDCAD could rise.
Price Action & Key Levels:
Entry Zone: 1.3600-1.3650 (if holding as support).
Target: 1.3700-1.3750 (+100 pips).
Stop Loss: Below 1.3550 (if support breaks).
Trade Plan:
Buy Zone: 1.3600-1.3650
Take Profit: 1.3700-1.3750 (+100 pips)
Stop Loss: 1.3550 (50-pip risk)
Risk-Reward Ratio: 1:2 (favorable).
Caution:

A break down from the current zone, aim the unmitigated!Expecting price to play around the current zone or a possible reversal to the upside is expected to grab liquidity, a shift to the down side afterwards, targeting the unmitigated low where the bulls are waiting.

Daily Price Action: USDCAD Thursday 4/17/2025In this video, we will be looking into the potential price action of USDCAD.

USDCAD 1D ChartThis is the 1 D chart of usdcad, I am publishing this chart for further informational analysis. Ideally, further analysis will use smart money concepts, ICT, and wick candle analysis.

USDCAD 4HR ChartThis is the 4 hr chart of usdcad, I am publishing this chart for further informational analysis. Ideally, further analysis will use smart money concepts, ICT, and wick candle analysis.

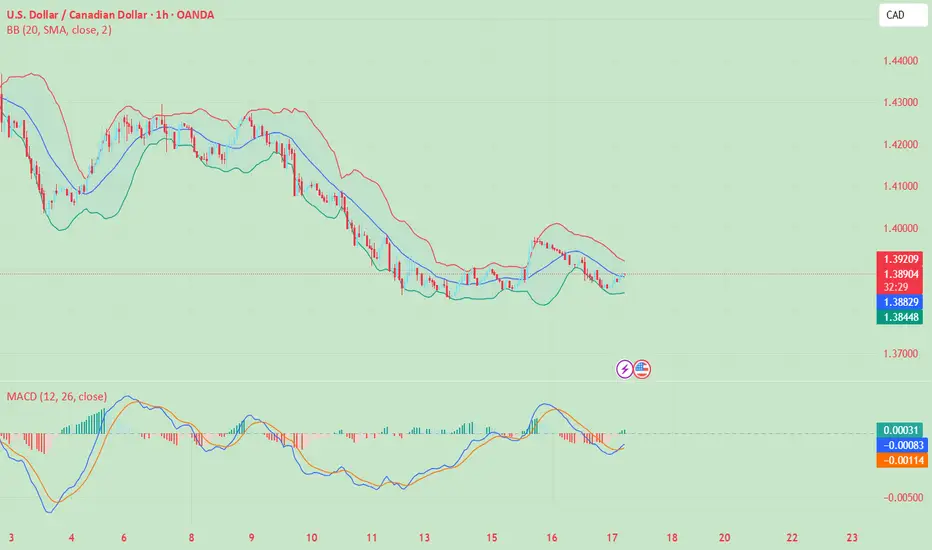
USDCAD us in Reversal USDCAD is showing the Reversal signs on daily chart it is testing the 0.618 fib level and the 1hr TFM is showing the divergence so it can go on the long side for some time

USD/CAD H4 | Potential bearish continuation?USD/CAD could rise towards a swing-high resistance and potentially reverse off this level to drop lower.
Sell entry is at 1.3969 which is a swing-high resistance.
Stop loss is at 1.4070 which is a level that sits above the 50.0% Fibonacci retracement and a pullback resistance.
Take profit is at 1.3839 which is a swing-low support.
High Risk Investment Warning
Trading Forex/CFDs on margin carries a high level of risk and may not be suitable for all investors. Leverage can work against you.
Stratos Markets Limited (tradu.com):
CFDs are complex instruments and come with a high risk of losing money rapidly due to leverage. 63% of retail investor accounts lose money when trading CFDs with this provider. You should consider whether you understand how CFDs work and whether you can afford to take the high risk of losing your money.
Stratos Europe Ltd (tradu.com):
CFDs are complex instruments and come with a high risk of losing money rapidly due to leverage. 63% of retail investor accounts lose money when trading CFDs with this provider. You should consider whether you understand how CFDs work and whether you can afford to take the high risk of losing your money.
Stratos Global LLC (tradu.com):
Losses can exceed deposits.
Please be advised that the information presented on TradingView is provided to Tradu (‘Company’, ‘we’) by a third-party provider (‘TFA Global Pte Ltd’). Please be reminded that you are solely responsible for the trading decisions on your account. There is a very high degree of risk involved in trading. Any information and/or content is intended entirely for research, educational and informational purposes only and does not constitute investment or consultation advice or investment strategy. The information is not tailored to the investment needs of any specific person and therefore does not involve a consideration of any of the investment objectives, financial situation or needs of any viewer that may receive it. Kindly also note that past performance is not a reliable indicator of future results. Actual results may differ materially from those anticipated in forward-looking or past performance statements. We assume no liability as to the accuracy or completeness of any of the information and/or content provided herein and the Company cannot be held responsible for any omission, mistake nor for any loss or damage including without limitation to any loss of profit which may arise from reliance on any information supplied by TFA Global Pte Ltd.
The speaker(s) is neither an employee, agent nor representative of Tradu and is therefore acting independently. The opinions given are their own, constitute general market commentary, and do not constitute the opinion or advice of Tradu or any form of personal or investment advice. Tradu neither endorses nor guarantees offerings of third-party speakers, nor is Tradu responsible for the content, veracity or opinions of third-party speakers, presenters or participants.

USDCAD - Bank of Canada keeps interest rates unchanged!The USDCAD pair is below the EMA200 and EMA50 on the 4-hour timeframe and is in its descending channel. The continuation of the downward movement of this pair will provide us with a buying position with a good risk-reward ratio. If the correction continues, we can sell within the specified supply zone.
On Wednesday, oil prices climbed by approximately 1%, driven by renewed optimism in the markets regarding potential trade talks between the United States and China. However, lingering concerns about the trade war’s negative effects on global energy demand limited further gains in oil prices.Initially, oil prices declined, but market sentiment shifted after Bloomberg reported—citing an anonymous source—that China was seeking greater respect from the Trump administration before agreeing to new negotiations. The same source also stated that China had requested a new outreach from the U.S. to initiate the discussions.
Giovanni Staunovo, an analyst at UBS, commented that easing trade tensions between the two nations could help reduce constraints on economic growth and energy demand, potentially exerting downward pressure on oil prices.
Meanwhile, the International Energy Agency (IEA) reported that global oil demand is expected to rise by just 730,000 barrels per day this year—well below both its previous projections and those of OPEC.
In a new report, the Fitch rating agency warned that the intensifying global trade war has significantly weakened the outlook for economic growth. According to the report, China’s economic growth will fall below 4% in both this year and the next, while the eurozone is projected to grow by less than 1%.
Fitch further estimates that global economic growth in 2025 will fall below 2%, marking the weakest performance since 2009 (excluding the COVID-19 pandemic period).
Despite the sharp decline in the U.S. growth outlook, Fitch expects the Federal Reserve to delay any interest rate cuts until Q4 of 2025. Conversely, deeper rate cuts are anticipated for the European Central Bank and emerging market economies.
In the energy sector, Fitch lowered its short-term oil price forecast due to risks stemming from weaker demand and trade disruptions but left its natural gas price forecast unchanged.
Additionally, the Bank of Canada maintained its policy rate at 2.75%. Highlights from the Bank’s monetary statement include:
• Tariffs and logistical challenges are driving price increases.
• New U.S. trade policies have heightened uncertainty, slowed growth, and sparked inflation fears.
• The Bank supports economic growth with inflation control but urges caution due to elevated domestic risks.
• Both upside risks (higher costs) and downside risks (weaker growth) to inflation are under close watch.
• Beginning in April, the removal of carbon taxes and cheaper oil are expected to temporarily lower inflation for about a year.
• The recent rise in inflation reflects renewed commodity price growth and the end of temporary sales tax relief.
• Due to high uncertainty related to U.S. trade tariffs, the Bank is refraining from issuing an economic forecast.
• The output gap in Q1 2025 was estimated between 0% and -1%.
• Annualized GDP growth for the same quarter was 1.8%, down from the January forecast of 2%.
• Two scenarios are under consideration: one involving tariff reduction via agreement, and another involving a prolonged global trade war.
• In the first scenario, Canadian and global growth temporarily decline, inflation drops to 1.5%, and later returns to the 2% target.
• In the second, the global economy slows sharply, inflation surges, and Canada enters a severe recession. Inflation surpasses 3% by mid-2026 before returning to the 2% target.
• In both scenarios, the neutral interest rate is estimated to be around the midpoint of the 2.25%–3.25% range.

USD/CAD Breakout patten USD/CAD M30 – Potential Buying Opportunity
The USD/CAD pair on the M30 timeframe is showing a potential bullish setup following the formation of a breakout pattern. This indicates a likely shift in momentum to the upside, increasing the chances of further gains in the coming hours.
Possible Long Trade Setup:
Entry:
Consider entering a long position around the trendline of the breakout pattern (watch for confirmation such as bullish candles or rejection wicks).
Target Levels:
1st Resistance: 1.4034
2nd Resistance: 1.4131
---
If you found this analysis helpful, please hit the like button and drop a comment to show your support!
Your engagement inspires me to share more quality setups and market insights.
Best regards,
JAMES_GOLD_MASTER_MQL5
Thank you!

Who's with me on USDCAD sells?A downtrend continuation.
USDCAD is bearish, we can see the trend from the higher timeframe down to the 15 minutes.
It broke a structure, created an imbalance. We're currently waiting for price to take out liquidity and trigger our orders

USDCAD 30M CHART PATTERNThis chart shows a technical analysis setup for the USD/CAD pair on the 30-minute timeframe.
Key Elements:
Descending Channel: The price is in a downtrend, forming lower highs and lower lows within a clearly defined downward channel.
Double Bottom Pattern (Orange Circle): Suggests a potential bullish reversal, but not confirmed unless the neckline is broken.
Stop Loss Level: Marked just above the recent lower high within the channel—logical risk management in case the trend reverses.
Take Profit Zone: Located at a horizontal support level, where price has previously

USD/JPY(20250417)Today's AnalysisMarket news:
U.S. import prices fell 0.1% in March from the previous month, the first month-on-month decline since September last year.
Technical analysis:
Today's buying and selling boundaries:
143.10
Support and resistance levels:
144.08
143.72
143.48
142.72
142.48
142.11
Trading strategy:
If the price breaks through 143.10, consider buying, the first target price is 143.48
If the price breaks through 142.72, consider selling, the first target price is 142.48
USD/CAD(20250417)Today's AnalysisMarket news:
U.S. import prices fell 0.1% in March from the previous month, the first month-on-month decline since September last year.
Technical analysis:
Today's buying and selling boundaries:
1.3923
Support and resistance levels:
1.4050
1.4002
1.3972
1.3875
1.3844
1.3797
Trading strategy:
If the price breaks through 1.3972, consider buying, with the first target price at 1.4002
If the price breaks through 1.3923, consider selling, with the first target price at 1.3875

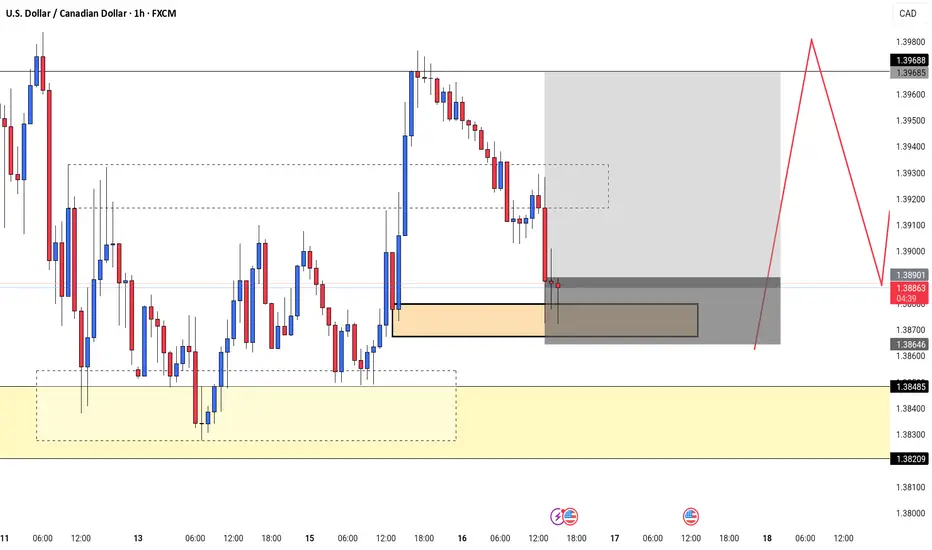
USDCAD LONG BEFORE SHORTPrice take a down movement until the demand zone on 1.38625 maybe it will be a great trade today.
Stay with my analysis yesterday and keep on beliver in analysis than forecasting.
Zone buy: 1.38625 - 1.38499
SL: 1.38390
TP: 1.39688

USDCAD LONGReason buy as we can see we have the inverse head and shoulder pattern, have the breakout and yah we have strong demand zone and that area that need to collect
USD/CAD For Bullish as pull-backyou can go long now
general trend is down trend
current phase is pull-back
have fun :)

USDCAD 1 Hr ChartAttached is the 15 minute chart for USDCAD, posting for further utilization. I'm interested in smart money concepts and ict

USDCAD 15 M ChartAttached is the 15 minute chart for USDCAD, posting for further utilization. I'm interested in smart money concepts and ict

USDCAD Bear Flag pattern still in play, POST BOCIntraday Update: The USDCAD slipped to bear flag support following the interest rate decision. The market was trading short CAD in hopes of a cut, and was disappointed. A break of the 1.3830 level would open up channel support at 1.3760. The BOC presser is ongoing at time of writing.

USDCAD Long IdeaUSDCAD form a breakdown from a tringle with MMC (Mirror Market structure ) it will repeat it self and and gonna go up again in the triangle.
#USDCAD

USDCADTook the first wave of USDCAD and rode that successfully and we've have been given a re-entry for yet another long position. The pair is on some recovery as it makes it's way to the downside on the overall timeframe so entry has to be calculated carefully.
Trump's Tax tariffs, some friction with Canada, lingering war between Russia, the EU and Ukraine really having some effects on this pair
We would ride this pair all the way to the upside carefully so, brace up!

USDCAD INTRADAY bearish below 1.4060The USDCAD pair is exhibiting a bearish sentiment, reinforced by the ongoing downtrend. The key trading level to watch is at 1.4060, which represents the current intraday swing low and the falling resistance trendline level.
In the short term, an oversold rally from current levels, followed by a bearish rejection at the 1.4060 resistance, could lead to a downside move targeting support at 1.3825, with further potential declines to 1.3700 and 1.3540 over a longer timeframe.
On the other hand, a confirmed breakout above the 1.4060 resistance level and a daily close above that mark would invalidate the bearish outlook. This scenario could pave the way for a continuation of the rally, aiming to retest the 1.4160 resistance, with a potential extension to 1.4270 levels.
Conclusion:
Currently, the USDCAD sentiment remains bearish, with the 1.4060 level acting as a pivotal resistance. Traders should watch for either a bearish rejection at this level or a breakout and daily close above it to determine the next directional move. Caution is advised until the price action confirms a clear break or rejection.
This communication is for informational purposes only and should not be viewed as any form of recommendation as to a particular course of action or as investment advice. It is not intended as an offer or solicitation for the purchase or sale of any financial instrument or as an official confirmation of any transaction. Opinions, estimates and assumptions expressed herein are made as of the date of this communication and are subject to change without notice. This communication has been prepared based upon information, including market prices, data and other information, believed to be reliable; however, Trade Nation does not warrant its completeness or accuracy. All market prices and market data contained in or attached to this communication are indicative and subject to change without notice.
