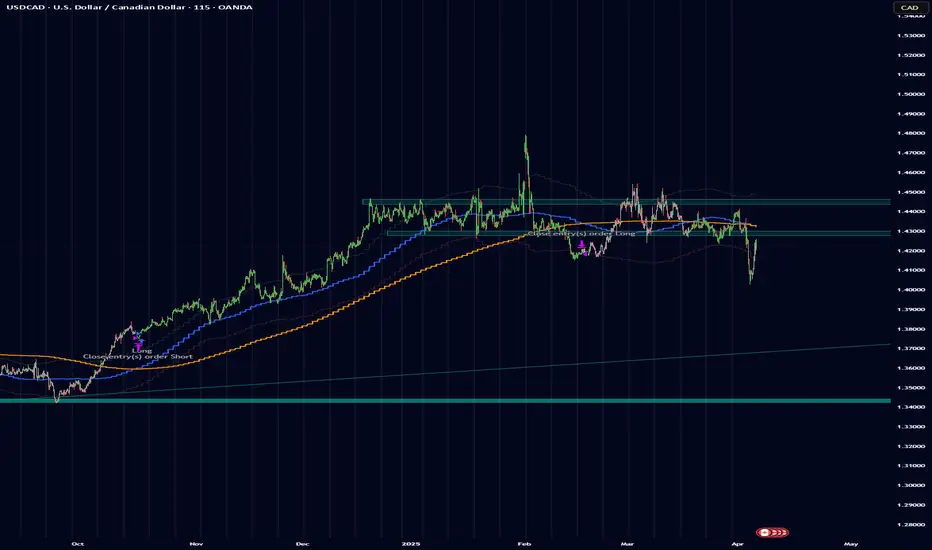
USDCAD SHORT Market structure bearish on HTFs 3
Entry at Daily AOi
Weekly Rejection at AOi
Daily Rejection At AOi
Daily EMA retest
Previous Structure point Daily
Around Psychological Level 1.42500
H4 EMA retest
H4 Candlestick rejection
Rejection from Previous structure
Levels 5.89
Entry 105%
REMEMBER : Trading is a Game Of Probability
: Manage Your Risk
: Be Patient
: Every Moment Is Unique
: Rinse, Wash, Repeat!
: Christ is King.
USDCAD.PRO.OTMS trade ideas

USDCAD SELL/SHORTBy utilizing Fibonacci retracement levels, historical patterns, , we can formulate a hypothesis that the market might follow a similar trajectory if bearish sentiment prevails.

USDCAD BUY BIASUSDCAD - Price rejected our daily OB and we expect more continuation to the upside long term but we should also remember fundamentals could be an issue.

USDCAD: Bulls Will Push Higher
Looking at the chart of USDCAD right now we are seeing some interesting price action on the lower timeframes. Thus a local move up seems to be quite likely.
Disclosure: I am part of Trade Nation's Influencer program and receive a monthly fee for using their TradingView charts in my analysis.
❤️ Please, support our work with like & comment! ❤️

USD/CAD Bearish Setup: Trendline Rejection & Supply Zone Trade📉 Trendline & Market Structure
🔵 Descending Trendline: The price has respected this trendline multiple times (🔴 red dots mark rejection points). This confirms a bearish structure.
📦 Supply Zone (Sell Area)
🟦 Blue Zone (Supply Zone): This is a strong resistance area where sellers may push the price down.
🚀 Price Rejected Here: Market reaction suggests potential bearish momentum.
⚠️ Stop Loss & Target 🎯
❌ Stop Loss (1.42308): If the price breaks above, the bearish setup is invalid.
🎯 Target (1.40437): Marked with a blue arrow 📉 indicating a downward move.
✅ Trade Plan
🔽 Sell Entry: Inside the supply zone
🛑 Stop Loss: Above the supply zone
🎯 Take Profit: At the lower blue level
This setup suggests a high-risk reward ratio favoring short positions. 📊 Keep an eye on the trendline and market reaction!

USDCAD BUY OPPORTUNITY!Price just provided a buy opportunity around the current price of 1.41998 as we previously published, the right Time to buy is now.
Our target profit is 1.43928


USDCAD 1H TimeFrame BuyUSDCAD started bullish movements and now after a correction ready for next bullish movements

USDCAD Technical and COT AnalysisOur analysis is based on multi-timeframe top-down analysis & fundamental analysis.
Based on our view the price will fall to the monthly level.
DISCLAIMER: This analysis can change anytime without notice and is only for assisting traders in making independent investment decisions. Please note that this is a prediction, and I have no reason to act on it, and neither should you.
Please support our analysis with a like or comment!
Let’s master the market together. Please share your thoughts and encourage us to do more by liking this idea.

USDCAD downside target 1.3900On the daily chart, USDCAD fell back after testing the resistance near 1.430. The current market is running below the downward trend line. The current support below is around 1.4027. If it falls below, it will continue to fall. The support below is around 1.3900. At present, you can pay attention to the short-selling opportunities in the 1.4200-1.4220 area.

Potential Sell (1H Scalp)Here's my 3 point confluence analysis.. I could be wrong so any additional tips on the comments are welcomed
1. USDCAD was on a small uptrend until it broke the trendline then consolidated sideways.
2. After breaking the trendline a reversal pin bar has formed indicating a downward but this wasn't enough to support the idea
3. after a sell order block formed followed by two FVG I'm confident that it set to move the previous low or to the discount area.
--------------------------------------------
Entry strategy (Enter on Pullback)
--------------------------------------------
Since the stochastics indicator on the hourly is showing it is oversold my TRADE ENTRY is a pull back into the red oderblock & wait for stochastic indicator to be overbought to enter or a rejection of the orderblock
note: the trade could just keep going down without doing a pullback

Bearish drop off 61.8% Fibonacci resistance?The Loonie (USD/CAD) has rejected off the pivot which has been identified as a pullback resistance and could drop to the 1st support which acts as a pullback support.
Pivot: 1.4275
1st Support" 1.4061
1st Resistance: 1.4402
Risk Warning:
Trading Forex and CFDs carries a high level of risk to your capital and you should only trade with money you can afford to lose. Trading Forex and CFDs may not be suitable for all investors, so please ensure that you fully understand the risks involved and seek independent advice if necessary.
Disclaimer:
The above opinions given constitute general market commentary, and do not constitute the opinion or advice of IC Markets or any form of personal or investment advice.
Any opinions, news, research, analyses, prices, other information, or links to third-party sites contained on this website are provided on an "as-is" basis, are intended only to be informative, is not an advice nor a recommendation, nor research, or a record of our trading prices, or an offer of, or solicitation for a transaction in any financial instrument and thus should not be treated as such. The information provided does not involve any specific investment objectives, financial situation and needs of any specific person who may receive it. Please be aware, that past performance is not a reliable indicator of future performance and/or results. Past Performance or Forward-looking scenarios based upon the reasonable beliefs of the third-party provider are not a guarantee of future performance. Actual results may differ materially from those anticipated in forward-looking or past performance statements. IC Markets makes no representation or warranty and assumes no liability as to the accuracy or completeness of the information provided, nor any loss arising from any investment based on a recommendation, forecast or any information supplied by any third-party.

USDCAD Quick Trading Insight: Selling Opportunity AheadAnalyzing USDCAD using the EASY Trading AI strategy strongly indicates a short-term bearish move. Current analytics suggest entering a Sell order at 1.42422. The selected targets are strategically placed at a Take Profit level of 1.41816 with a Stop Loss set at 1.4299. This bearish perspective aligns with patterns identified by EASY Trading AI, predicting market correction following recent overextensions. Traders should closely monitor entry accuracy and maintain strict adherence to risk parameters.

USD/CAD 4H Time Frame AnalysisUSD/CAD 4H Time Frame Analysis
On the 4-hour time frame, USD/CAD has been in a prolonged consolidation phase following an uptrend. However, during this consolidation, we observed a subtle shift in market momentum toward the downside.
Two key support levels have been identified:
1.41800 – First major key level
1.39000 – Next significant support level
These levels will serve as crucial zones for observing future price action.
Recently, a breakout occurred below the first major key level (1.41800), triggering pending sell orders from retail traders anticipating further downside. This move also signaled a Change of Character (CHOCH) in the market structure. However, before a full bearish move unfolded, market makers stepped in to absorb liquidity, hunting stop-losses to create more efficient trade flow within the liquidity zone.
Now that liquidity has been collected, institutional traders are beginning to position themselves for a continuation to the downside. This is often when smart money—large, informed investors—start executing their strategies after a prolonged price build-up.
Trading Strategy:
Sell Limit: 1.41660 (upon pullback or retest of broken support)
Stop Loss: 1.43000 (above the liquidity zone)
Take Profit: 1.38920 (next major key support level)
We'll wait for a retest of the 1.41660 zone to confirm entry, following smart money concepts and liquidity dynamics.
Fundamental Outlook:
Recent Positive Developments Supporting CAD:
April 8, 2025: Canada has been largely exempted from the U.S.'s newly imposed 10% import tariffs. While Canadian exports in steel, aluminum, and autos remain under existing tariffs, the broader exemption has helped support CAD strength, reflecting confidence in Canada's trading stability.
April 7, 2025: The Canadian dollar gained 0.1%, trading around 1.42 per USD (70.42 U.S. cents). This appreciation stems from investor optimism regarding Canada's insulation from global tariff pressures, positioning the CAD more favorably compared to its peers.
Recent Negative Developments Impacting USD:
U.S. CPI (m/m): Forecast shows a decline to -0.1% from the previous 0.2%, suggesting weakening inflation momentum, which could influence the Federal Reserve’s monetary policy stance.
Unemployment Claims: Expected to rise from 219K to 223K, signaling potential softening in the labor market, which may add downside pressure to the USD.
📌 Disclaimer:
This analysis is for informational and educational purposes only and should not be considered financial advice. Trading involves substantial risk, and past performance is not indicative of future results. Always conduct your own research and consult with a financial professional before making any investment decisions.

Pullback-Confirmed Reversal with Structural RhythmSetup Type: Timing Synchronization Short Setup
Setup Overview
USD/CAD recently staged a short-term pullback against a dominant downtrend. The reflexive bounce met resistance and stalled. As of April 7 (Monday), price action has entered a clean sideways consolidation, confirming the hesitation required by the Timing Synchronization Rule. Tuesday’s session (April 8) becomes the key trigger window for re-entry in the direction of the original impulse—short.
COT & Sentiment Snapshot
• CAD sentiment recovering mildly amid crude oil stabilization
• USD momentum cooling post-rate expectations
• Leveraged funds mildly long USD, but waning positioning
• Open interest flattens—market indecision post-pullback
Market Structure & Technical Breakdown
• Downtrend impulse → Friday pullback (April 4)
• Monday (April 7) = confirmed consolidation day (neutral candle)
• Key structure: price stalling at prior rejection zone
• Clean technical symmetry unfolding
✅ Entry window opens April 8 on structural breakdown
🟡 Short only if price confirms break of consolidation zone
Behavioral Finance Layer
🧠 “The market must rest in proportion to how it moved.” – Watts
• Traders positioned aggressively long on Friday now trapped
• Monday's indecision fuels hesitation
• Tuesday’s breakdown = phase shift into emotional unwind
• Weak hands exiting as confirmation builds
Reflexivity Risk Model
• Phase 1: Pullback (April 4 – impulse bounce)
• Phase 2: Sideways pause (April 7)
• Phase 3: Short re-entry trigger (April 8)
• Phase 4: Position unwind + continuation phase

USD/CAD – Breakdown Retest Offering Strategic Short OpportunityWeek of: April 7–11, 2025
Bias: Bearish
Trade Duration: 2–5 Days
Status: Breakdown Confirmed – Retesting from Below
Current Reflexivity Phase: Phase 3 – Crowd Denial / Re-Entry Trap
Strategy Type: Structural Breakdown + Sentiment Dislocation
Execution Style: Reactive, not predictive
🧠 Strategic Thesis
USD/CAD has broken decisively below its prior 2-week base and is now retesting that structure from below. The pair is showing textbook behavior of distribution > breakdown > retest—a setup that often leads to emotional unwinds when conviction collapses.
Though USD sentiment remains firm, the structure disagrees—and price is leading positioning.
🔍 Structure Breakdown Highlights
Clear break beneath consolidation range
Retest is unfolding in low-momentum fashion (no bullish drive)
Lower highs persist on multiple timeframes
No fresh demand seen on the retest so far
Ideal short continuation trigger if rejection holds
📊 COT & Sentiment Snapshot
Leveraged Funds: Still long USD/CAD, but have begun reducing size
Commercials: Gradual CAD accumulation underway
Open Interest: Rises on down moves, fades on up moves — shows weak demand conviction
Retail Sentiment: Still bullish on USD, ignoring structural breakdown
Institutional Bias: Quiet rotation toward CAD strength
📌 Translation: Belief in USD remains, but smart money is already moving. This dislocation is your edge.
🧠 Behavioral Finance Triggers
“Crowds trust the story. Price tells the truth.”
Anchoring to old bullish setups
Late buyers still entering on dips
Retest becomes a re-entry trap for overconfident longs
If rejection confirms, emotional exits fuel momentum
🔄 Reflexivity Model – Phase Breakdown
Phase Description
Phase 1: USD/CAD long crowd builds on USD strength narrative
Phase 2: Structure breaks below key base – already completed
Phase 3: Now Active – Crowd in denial, price retesting from below
Phase 4: Flush and capitulation if retest fails, triggering stop cascades
✅ Current Phase: 3 – Re-Entry Trap / Denial Before Exit
🛠️ Execution Plan
Entry: Wait for clean rejection candle or lower-high after retest
Risk Management: Invalidate if structure is reclaimed and price sustains above the broken zone
Exit Plan: Scale out as price moves into areas of prior demand or volume voids
Trade Style: Tactical, reactive — confirm behavior before acting
Expected Duration: 2–5 trading days if follow-through holds
🕰️ Execution Timeline
Monday: Monitor the retest — don’t rush entry
Tuesday–Wednesday: Best window for rejection and short setup
Thursday–Friday: Manage open exposure, secure gains or trail
✅ Strategic Summary
This is not a top call — the top is already in
Structure has changed, but belief lags
The crowd is doubling down — structure is calling their bluff
Let rejection confirm, then lean into the unwind
“You don’t need to predict. Just follow the failure.”
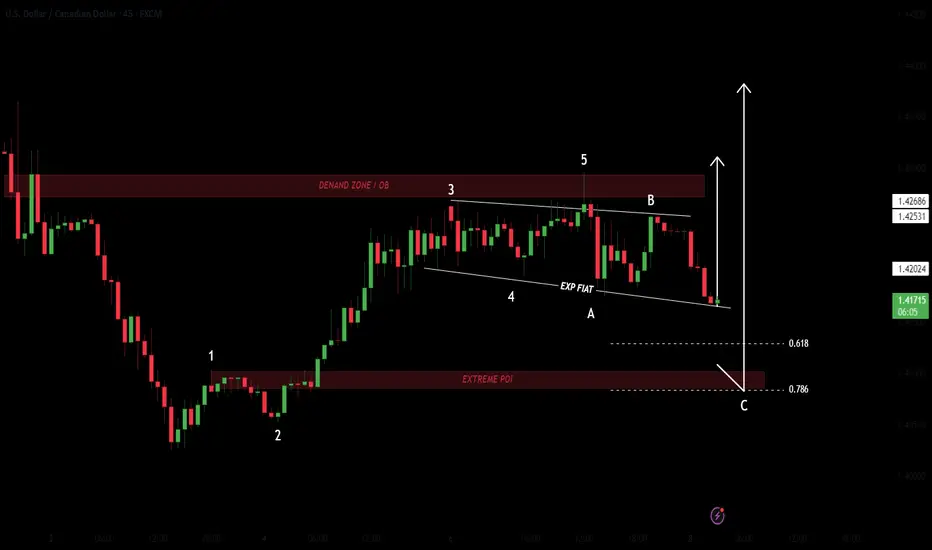
USDCADUSDCAD
- Break of Structure
- Completed " 12345 " Impulsive Waves and " AB " Corrective Waves
- Point of Interest
- Order Block
- Exp FIAT as an corrective pattern in Short Time Frame
Tue 8th Apr 2025 USD/CAD Daily Forex Chart Buy SetupGood morning fellow traders. On my Daily Forex charts using the High Probability & Divergence trading methods from my books, I have identified a new trade setup this morning. As usual, you can read my notes on the chart for my thoughts on this setup. The trade being a USD/CAD Buy. Enjoy the day all. Cheers. Jim

USD/CAD(20250408)Today's AnalysisToday's buying and selling boundaries:
1.4240
Support and resistance levels:
1.4356
1.4312
1.4284
1.4195
1.4167
1.4124
Trading strategy:
If the price breaks through 1.4240, consider buying, the first target price is 1.4284
If the price breaks through 1.4195, consider selling, the first target price is 1.4167

USDCADsupply zone & make a liq swap
so, i think this will continue bear
the major trend also bear
disclaimer
this is not a signal
i just try to share what i learn
thanksyou

USDCADWe can attempt to short USDCAD from specified level as it break HL , also bearish divergence occur indicate that it moves downward.
SL , TP mention in chart.

Canadian dollar slides as Canada's job growth declinesThe Canadian dollar has stabilized on Monday after declining close to 1% on Friday. In the North American session, USD/CAD is trading at 1.4225, up 0.23% on the day. It has been a roller-coaster for the Canadian dollar, which jumped 1.1% on Thursday but gave up almost all of the gains a day later.
Canada's economy shed 32.6 thousand jobs in March, the biggest decline since August 2022. This was a sharp reversal from the 1.1 thousand gain in February and much lower than the market estimate of 12 thousand. The unemployment rate rose to 6.7% from 6.6% and the participation rate ticked lower to 65.2% from 65.3%.
The employment data points to weakness in the labor market and the economic chill from the latest US tariffs could lead to further deterioration of the employment landscape.
Businesses are holding back on investment and hiring due to the economic uncertainty and the plunge in oil prices will hurt the economy, as Canada is a major oil producer.
US nonfarm payrolls surprised on the upside with a gain of 228 thousand, up from a revised 117 thousand in February and above the market estimate of 135 thousand. This was the strongest nonfarm payroll reading in three months.
The positive employment report was overshadowed by the latest round of US tariffs which have sent the financial markets tumbling lower. There are increasing fears that the US tariffs and expected counter-tariffs could upend the US economy and tip it into a recession.
Investors are hoping that the Trump administration will reduce the tariffs or at least announce negotiations will take place with targeted countries. So far, however, Trump has sounded defiant and said that the tariffs will stay in place.
