USDCAD bearish strong
OANDA:USDCAD trend based trade, after strong events in last periods here strong bearish expectations for this week.
SUP zone: 1.45500
RES zone: 1.40500, 1.39600
USDCAD.PRO.OTMS trade ideas


UsdCad Trade IdeaI personally took some shorts on UC with price coming back up into a major level of support that is now currently being used as resistance. With smaller time frames shifting structure at a major level and giving me a solid bearish candle confirmation after the retest, we could expect price to dump back down to 1.41553

DONT FORGET TO CONTINUE SELLING USDCADThis chart is bearish, any retracement is a sell
Dont miss out.

USDCAD Will Go Higher! Buy!
Take a look at our analysis for USDCAD.
Time Frame: 6h
Current Trend: Bullish
Sentiment: Oversold (based on 7-period RSI)
Forecast: Bullish
The market is testing a major horizontal structure 1.424.
Taking into consideration the structure & trend analysis, I believe that the market will reach 1.440 level soon.
P.S
Overbought describes a period of time where there has been a significant and consistent upward move in price over a period of time without much pullback.
Disclosure: I am part of Trade Nation's Influencer program and receive a monthly fee for using their TradingView charts in my analysis.
Like and subscribe and comment my ideas if you enjoy them!

USD/CAD - Long This is looking to be a clean Elliots wave pullback chart with a Batwing Pattern forming. This is all apart of a consolidation wave.
Im looking for long off this Support.
What are you doing in this market?

USDCAD Technical AnalysisFenzoFx—USD/CAD rose from 1.4025. The market outlook remains bullish if the price holds above 1.4150. In this scenario, the next bullish target will likely be the 1.4414 resistance.
A dip below 1.415 invalidates the bullish outlook with a bearish target at 1.4025.

USDCAD Continues its Bearish trend.Making LH or LL
.No any indications of reversal
.fibonacchi level 0.618 exact on entry point

USDCAD ENTRY CHART VIEWON this Pair,We are still Bearish, first market trend is still down,though the midterm trend is now Bullish, also we have a Confirmation that the CANADIAN DOLLAR is still BULLISH, with this as a Confluence alongside with the fact that price is around a Supply zone, with additional Confluence of 200ma from the 1h, we only refine the supply zone for better entry and stops.

INTRADAY BUY OPPORTUNITY IN USDCAD!Price Is currently reacting around a counter trendline in H4 timeframe. A break above the trendline insight a bullish signal . Buy upon the break of the trendline
Target is 1.43937

check the trendIt is expected that a trend change will form in the resistance area and the resistance trend line and we will see the beginning of an downward trend.

Intraday Preview: Consolidation and waiting | Prospect: +100pipsThe View:
Although the possibility of further consolidation cannot be ruled out, it is expected to remain limited in scope. Market momentum remains subdued; however, there are signs of stabilization that support the likelihood of a gradual upward trend, provided no new negative developments emerge in the external environment.
Buy Scenario:
Although the possibility of further consolidation cannot be ruled out, it is expected to remain limited in scope. Market momentum remains subdued; however, there are signs of stabilization that support the likelihood of a gradual upward move, provided no new negative developments occur in the external environment. In this context, long positions are maintained above 1.4170, with targets at 1.4300 and 1.4340 in extension.
Sell Scenario:
Despite signs of potential stabilization, a break below the 1.4170 level may trigger renewed downward pressure. In such a scenario, the likelihood of further decline increases, with the next targets seen at 1.4100 and 1.4080. The inability to hold key support levels could act as a catalyst for short-term bearish momentum.

I'm selling USDCADThe market is absolutely volatile and this is when you make the quickest gain or loose fast too.
I think UCAD will continue its downtrend . The purple lines will guide you in taking profits.
A more conservative approach will be to wait for break and retest of that hourly counter-trendline.
Either way, the trend is down

Heading into pullback resistance?The Loonie (USD/CAD) is rising towards the pivot which has been identified as a pullback resistance and could reverse to the 61.8% Fibonacci retracement.
Pivot: 1.4389
1st Support: 1.3951
1st Resistance: 1.4505
Risk Warning:
Trading Forex and CFDs carries a high level of risk to your capital and you should only trade with money you can afford to lose. Trading Forex and CFDs may not be suitable for all investors, so please ensure that you fully understand the risks involved and seek independent advice if necessary.
Disclaimer:
The above opinions given constitute general market commentary, and do not constitute the opinion or advice of IC Markets or any form of personal or investment advice.
Any opinions, news, research, analyses, prices, other information, or links to third-party sites contained on this website are provided on an "as-is" basis, are intended only to be informative, is not an advice nor a recommendation, nor research, or a record of our trading prices, or an offer of, or solicitation for a transaction in any financial instrument and thus should not be treated as such. The information provided does not involve any specific investment objectives, financial situation and needs of any specific person who may receive it. Please be aware, that past performance is not a reliable indicator of future performance and/or results. Past Performance or Forward-looking scenarios based upon the reasonable beliefs of the third-party provider are not a guarantee of future performance. Actual results may differ materially from those anticipated in forward-looking or past performance statements. IC Markets makes no representation or warranty and assumes no liability as to the accuracy or completeness of the information provided, nor any loss arising from any investment based on a recommendation, forecast or any information supplied by any third-party.

new value area high to start Mondaynew value area high to start Monday
my personal opinion is development towards resolution likely near,
but still need wait catalyst
upon resolution news published, a short may be entered due to this exhaustive move from this last momentum wave
EURO may be a better bet for more conservative entries
information created and published doesn't constitute investment advice!
NOT financial advice

USD/CAD Rejection Trade Setup – Short from Supply Zone with RisiTimeframe: 30 Minutes (M30)
Indicators:
EMA 30 (Red): 1.41932
EMA 200 (Blue): 1.42196
🧠 Trade Setup: Potential Short Opportunity
📍 Current Price: 1.42252
📌 Key Levels:
Entry Point (Supply Zone): 1.42582
Strong resistance zone, overlapping with EMA 200 and a previous consolidation zone.
Price has entered a rising wedge pattern—a potential bearish reversal signal.
Stop Loss: 1.42987
Placed just above the supply zone to avoid premature exit due to a false breakout.
Take Profit (EA Target Point): 1.40379
Aligns with previous demand zone, solid support level.
⚖️ Risk-to-Reward Breakdown:
Risk: ~335 pips
Reward: ~2047 pips
R:R Ratio: ~1:6 — Excellent risk-to-reward ratio for a swing short.

USDCAD TRADE SETUPWait for retest the entry level then take trade for Sell otherwise skip this setup

Potential bearish drop?USD/CAD is reacting off the resistance level which is a pullback resistance that is slightly below the 61.8% Fibonacci retracement.
Entry: 1.4250
Why we like it:
There is a pullback resistance level that is slightly below the 61.8% Fibonacci retracement.
Stop loss: 1.4335
Why we like it:
There is a pullback resistance level that lines up with the 71% Fibonacci retracement.
Take profit: 1.4061
Why we like it:
There is a pullback support level.
Enjoying your TradingView experience? Review us!
Please be advised that the information presented on TradingView is provided to Vantage (‘Vantage Global Limited’, ‘we’) by a third-party provider (‘Everest Fortune Group’). Please be reminded that you are solely responsible for the trading decisions on your account. There is a very high degree of risk involved in trading. Any information and/or content is intended entirely for research, educational and informational purposes only and does not constitute investment or consultation advice or investment strategy. The information is not tailored to the investment needs of any specific person and therefore does not involve a consideration of any of the investment objectives, financial situation or needs of any viewer that may receive it. Kindly also note that past performance is not a reliable indicator of future results. Actual results may differ materially from those anticipated in forward-looking or past performance statements. We assume no liability as to the accuracy or completeness of any of the information and/or content provided herein and the Company cannot be held responsible for any omission, mistake nor for any loss or damage including without limitation to any loss of profit which may arise from reliance on any information supplied by Everest Fortune Group.

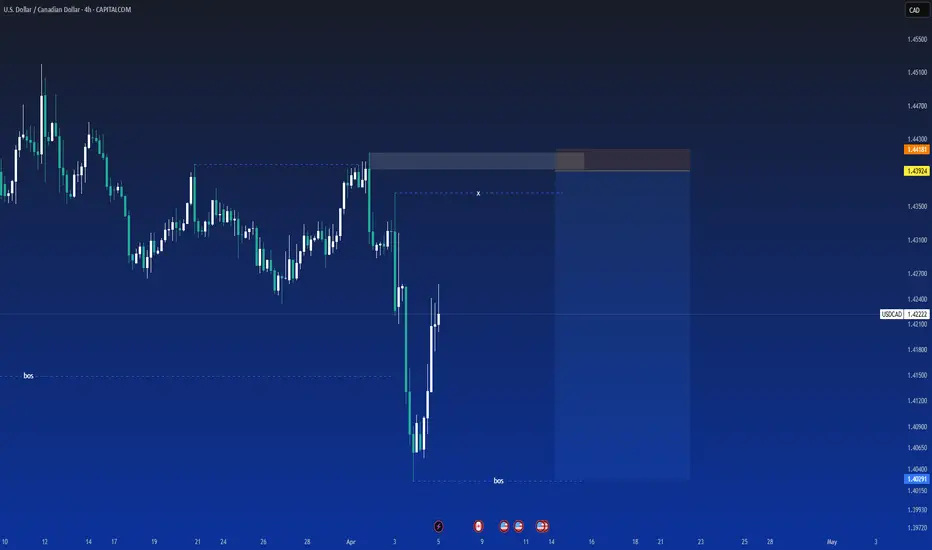
USDCAD - Hunting for Bullish Entries?The USD/CAD pair has experienced a notable correction from the 1.4400 resistance level, with price currently being at the 1.4215 area. If a correction happens like the one highlighted by the arrows, traders may find an attractive buying opportunity on smaller timeframes, aligning with the larger bullish trend that's been in place since February. The recent pullback could provide an ideal entry for those looking to capitalize on the prevailing uptrend, targeting a potential move back toward the orange horizontal resistance at 1.4400. However, caution is warranted – should price sharply break below the blue support box with conviction, the bullish thesis would be invalidated, suggesting instead a strategy of selling any minor retracements as the pair could then accelerate to the downside. This critical juncture demands close monitoring of price action for confirmation of either scenario in the coming sessions.
Disclosure: I am part of Trade Nation's Influencer program and receive a monthly fee for using their TradingView charts in my analysis.

USDCAD, Bearish Bias, Fundamentally and TechnicallyFundamental Analysis
1. Endogenous and Exogenous factors indicates bearish trend in USDCAD.
2.USD is getting weaker in previous months while CAD is stronger
3. Seasonality also shoes bullish trend in CAD in April and Bearish in USD
4. COT report of USD indicates continuous reduction in long positions by NON-COM
5. Sentiments of USD and CAD are both bearish due to Tariffs but CAD will improve in coming days.
Technical Analysis.
1. Weekly chart shows Bearish RSI divergence with consolidation Box
2. Daily chart shows breakdown of consolidation box with Head and Shoulder pattern with retracement/retest
3. Entry of short sell in 2 parts
i. Enter at current price with 1% risk
ii. Enter at 1.43769
4. Stoploss above right shoulder 1.45597
5. Initial target at weekly support 1.39497

USD_CAD SHORT SIGNAL|
✅USD_CAD is going up now
But a strong resistance level is ahead
Thus I am expecting a pullback
And a move down so we can
Enter a short trade with the
TP of 1.4171 and the SL of 1.4280
SHORT🔥
✅Like and subscribe to never miss a new idea!✅
Disclosure: I am part of Trade Nation's Influencer program and receive a monthly fee for using their TradingView charts in my analysis.

USD/CAD "The Loonie" Forex Bank Heist Plan (Scalping/Day Trade)🌟Hi! Hola! Ola! Bonjour! Hallo! Marhaba!🌟
Dear Money Makers & Robbers, 🤑💰✈️
Based on 🔥Thief Trading style technical and fundamental analysis🔥, here is our master plan to heist the USD/CAD "The Loonie" Forex Bank. Please adhere to the strategy I've outlined in the chart, which emphasizes short entry. Our aim is the high-risk Green Zone. Risky level, oversold market, consolidation, trend reversal, trap at the level where traders and bullish robbers are stronger. 🏆💸Book Profits Be wealthy and safe trade.💪🏆🎉
Entry 📈 : "The vault is wide open! Swipe the Bearish loot at any price - the heist is on!
however I advise to Place sell limit orders within a 15 or 30 minute timeframe most recent or swing, low or high level.
Stop Loss 🛑: Thief SL placed at 1.43600 (scalping / Day Trade Basis) Using the 2H period, the recent / swing high or low level.
SL is based on your risk of the trade, lot size and how many multiple orders you have to take.
Target 🎯: 1.41300 (or) Escape Before the Target
🧲Scalpers, take note 👀 : only scalp on the Short side. If you have a lot of money, you can go straight away; if not, you can join swing traders and carry out the robbery plan. Use trailing SL to safeguard your money 💰.
USD/CAD "The Loonie" Forex Bank Heist Plan (Scalping / Day Trade) is currently experiencing a bearishness,., driven by several key factors.
📰🗞️Get & Read the Fundamental, Macro, COT Report, Quantitative Analysis, Sentimental Outlook, Intermarket Analysis, Future trend targets.. go ahead to check 👉👉👉🔗
⚠️Trading Alert : News Releases and Position Management 📰 🗞️ 🚫🚏
As a reminder, news releases can have a significant impact on market prices and volatility. To minimize potential losses and protect your running positions,
we recommend the following:
Avoid taking new trades during news releases
Use trailing stop-loss orders to protect your running positions and lock in profits
💖Supporting our robbery plan 💥Hit the Boost Button💥 will enable us to effortlessly make and steal money 💰💵. Boost the strength of our robbery team. Every day in this market make money with ease by using the Thief Trading Style.🏆💪🤝❤️🎉🚀
I'll see you soon with another heist plan, so stay tuned 🤑🐱👤🤗🤩
