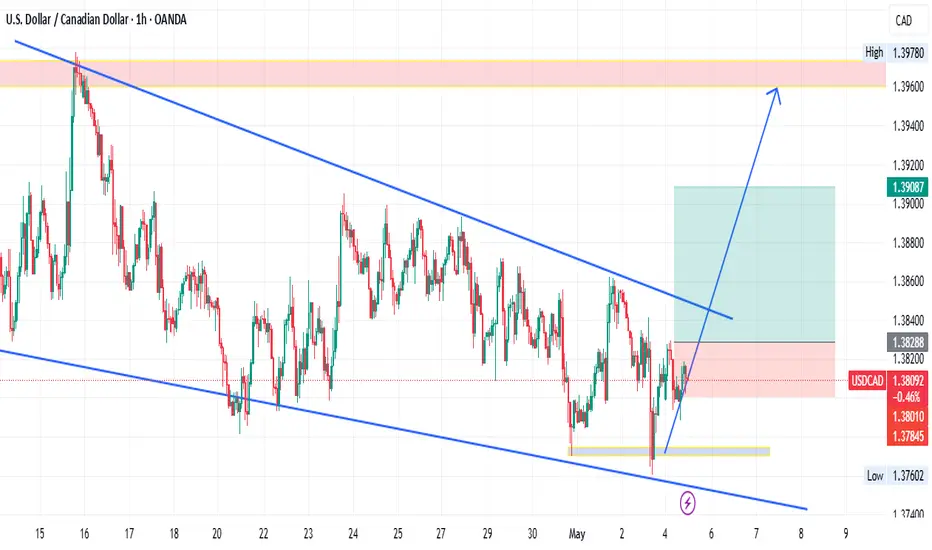
USDCADON THE 4HR TIMEFRAME
⚡️We established the key monthly zone.
⚡️weekly trendline.
⚡️wide divergence all signaling bullish and hence rhyming with the monthly,
⚡️weekly and daily bullish bias.
Our confirmation will be the break of the 4hr trend line for a possible quick entry long!!
It's Bullish🚀 guyss
USDCAD.PRO.OTMS trade ideas

USDCAD Analysis: Buyers Defend Key Level Ahead of NFP DataUSDCAD Analysis: Buyers Defend Key Level Ahead of NFP Data
Since April 20, USDCAD has been moving sideways without a clear trend. However, in recent days, the pair has found strong support around 1.3780 for the second time, suggesting that buyers are actively defending this zone.
With the upcoming NFP data, there's potential for a bullish move. If the report fuels buying momentum, USDCAD could rise toward the resistance levels at 1.3855 and 1.3890, as seen on the chart.
You may find more details in the chart!
Thank you and Good Luck!
❤️PS: Please support with a like or comment if you find this analysis useful for your trading day❤️
Disclosure: I am part of Trade Nation's Influencer program and receive a monthly fee for using their TradingView charts in my analysis.

USDCAD Massive Long! BUY!
My dear subscribers,
This is my opinion on the USDCAD next move:
The instrument tests an important psychological level 1.3792
Bias - Bullish
Technical Indicators: Supper Trend gives a precise Bullish signal, while Pivot Point HL predicts price changes and potential reversals in the market.
Target - 1.3833
My Stop Loss - 1.3777
About Used Indicators:
On the subsequent day, trading above the pivot point is thought to indicate ongoing bullish sentiment, while trading below the pivot point indicates bearish sentiment.
Disclosure: I am part of Trade Nation's Influencer program and receive a monthly fee for using their TradingView charts in my analysis.
———————————
WISH YOU ALL LUCK

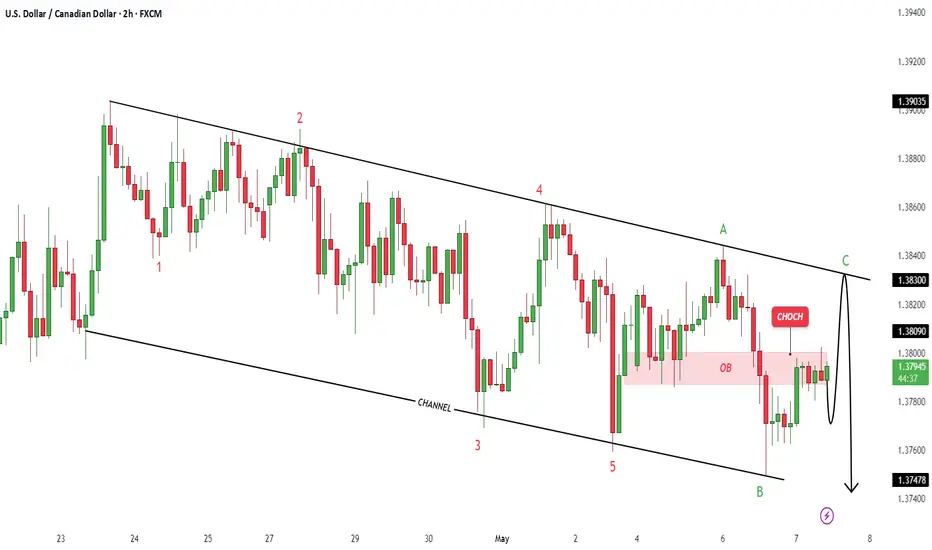
USDCADUSDCAD
- Bearish Channel as an corrective pattern in short time frame
- RSI - Divergence
- Break of Structure
- Change of Characteristics
- Completed " 12345 " Impulsive Waves and " AB " Corrective Wave
USDCAD Is Bullish! Long!
Here is our detailed technical review for USDCAD.
Time Frame: 12h
Current Trend: Bullish
Sentiment: Oversold (based on 7-period RSI)
Forecast: Bullish
The market is approaching a significant support area 1.378.
The underlined horizontal cluster clearly indicates a highly probable bullish movement with target 1.399 level.
P.S
Overbought describes a period of time where there has been a significant and consistent upward move in price over a period of time without much pullback.
Disclosure: I am part of Trade Nation's Influencer program and receive a monthly fee for using their TradingView charts in my analysis.
Like and subscribe and comment my ideas if you enjoy them!

Watching carefully USDCAD this weekWith the abundance of US & CAN data this week, we may see some interesting action in USDCAD pair.
Let's dig in.
Let us know what you think in the comments below.
Thank you.
77.3% of retail investor accounts lose money when trading CFDs with this provider. You should consider whether you understand how CFDs work and whether you can afford to take the high risk of losing your money. Past performance is not necessarily indicative of future results. The value of investments may fall as well as rise and the investor may not get back the amount initially invested. This content is not intended for nor applicable to residents of the UK. Cryptocurrency CFDs and spread bets are restricted in the UK for all retail clients.

Thu 8th May 2025 USD/CAD Daily Forex Chart Buy SetupGood morning fellow traders. On my Daily Forex charts using the High Probability & Divergence trading methods from my books, I have identified a new trade setup this morning. As usual, you can read my notes on the chart for my thoughts on this setup. The trade being a USD/CAD Buy. Enjoy the day all. Cheers. Jim

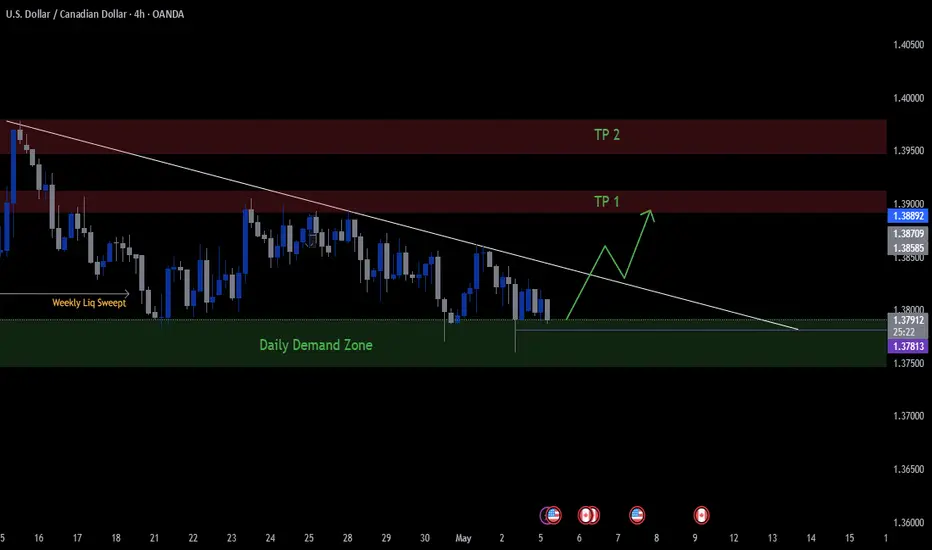
USD/CAD: Ready to Explode from Demand Zone !!Hey guys,
As you can see on the chart, price is sitting on a daily demand zone and has already swept weekly liquidity.
If we get a solid reaction from here, I’m looking at 1.39000 – 1.39500 as the next potential target area.
(Not financial advice)
#USDCAD #Forex #PriceAction #SmartMoney #LiquidityGrab #DemandZone #TechnicalAnalysis #ForexSetups #BreakoutWatch #SwingTrading #ForexTrading #TradingView
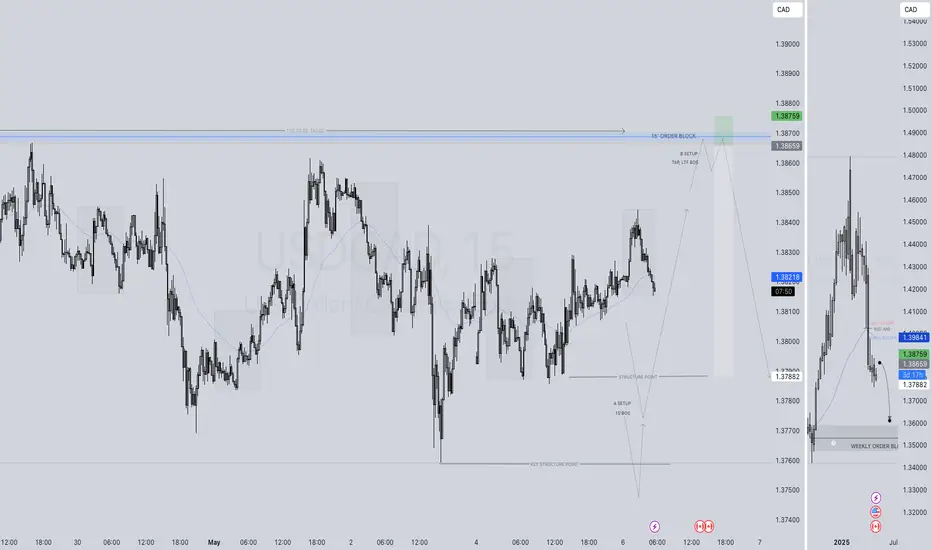
USDCAD SHORT FORECAST Q2 W19 D7 Y25USDCAD SHORT FORECAST Q2 W19 D7 Y25
Professional Risk Managers👋
Welcome back to another FRGNT chart update📈
Diving into some Forex setups using predominantly higher time frame order blocks alongside confirmation breaks of structure.
Let’s see what price action is telling us today!
💡Here are some trade confluences📝
✅Intraday breaks of structure
✅Tokyo ranges to be filled
✅15' order block identified
✅ inconclusive regarding 15' mitigated, therefore 5' order block identified after potential 15' mitigation
✅4 Hour order block
✅4 Hour 50 EMA
🔑 Remember, to participate in trading comes always with a degree of risk, therefore as professional risk managers it remains vital that we stick to our risk management plan as well as our trading strategies.
📈The rest, we leave to the balance of probabilities.
💡Fail to plan. Plan to fail.
🏆It has always been that simple.
❤️Good luck with your trading journey, I shall see you at the very top.
🎯Trade consistent, FRGNT X

BUY USDCAD for bearish false breakout STOP LOSS : STOP LOSS BUY USDCAD for bearish false breakout
STOP LOSS : STOP LOSS position is left opened ( am only closing this trade based on a candle stick pattern)
First what is false breakout, A false breakout in Forex occurs when the price breaks through a key level (like support or resistance) but quickly reverses and returns to its original range, often trapping traders who were expecting a continuation of the breakout. It's essentially a false signal, indicating a potential trend reversal or continuation, but the price doesn't follow through....
Secondly what is divergence ,In forex trading, divergence occurs when the price of a currency pair moves in one direction, while a technical indicator (like an oscillator) moves in the opposite direction. This mismatch can signal a potential trend reversal or weakening trend. There are two main types: bullish and bearish divergence........
On this trade we are taking it because we saw regular bullish Divergence,
Regular Bullish Divergence
In case of Regular Bullish Divergence:
* The Indicator shows Higher Lows
* Actual Market Price shows Lower Lows
We can see a strong divergence on the RSI already and There is a strong trend reversal on the daily time frame chart.....
The daily time frame is showing strength of trend reversal from this strong level of Support so we are looking for the trend reversal and correction push from here .....
TAKE PROFIT : take profit will be when the trend comes to an end, feel from to send me a direct DM if you have any question about take profit or anything
Remember to risk only what you are comfortable with…….trading with the trend, patient and good risk management is the key to success here
Marathon trade on USDCADUSDCAD it seems it has finished the corrective wave on 4H TF with 1-2-3 pattern
and ready to continue the up trend
we will by from 1.3815 with 65 pip stop loss at 1.3745
and try to get 1:10 RR at 1.4460

USD/CAD could decrease to C$1.35The US dollar has weakened recently against other major currencies including the euro, pound and yen. While it may not have grabbed the headlines, there’s another currency we can add to that list: the Canadian dollar.
The Canadian dollar – which was trading at around C$1.45 per US dollar at the end of January – may continue to strengthen against its southerly neighbour in the near term, potentially reaching C$1.35 per US dollar. Let’s examine why.
The area between C$1.38 and C$1.39 has previously served as a resistance zone for USD/CAD, marking significant tops in 2022, 2023 and 2024. Each time, this area ended the dollar’s gains and led to a renewed period of Canadian dollar strength. The pattern changed in October 2024, when – after multiple failed attempts to break through resistance – USD/CAD finally pushed to a new high of C$1.45. Now, as USD/CAD declines from that peak, the old resistance area of C$1.38 to C$1.39 is providing support.
If USD/CAD falls below support at C$1.38, it could decline towards C$1.347, partly because there are no meaningful levels of support to slow such a move. A falling bear flag pattern also seems to be forming, suggesting that a breakdown may be imminent, potentially supporting a drop to around C$1.35. Meanwhile, the completion of the diamond reversal top that formed from December 2024 to March 2025 could imply a return to the pattern’s origin near C$1.35.
The USD/CAD chart pattern also shows a high degree of symmetry between the left and right sides. In other words, the decline on the right side is occurring at a similar pace to the earlier rise on the left. Completing this symmetrical pattern might suggest a return to the starting point around C$1.35.
Of course, if support at C$1.38 holds and the Canadian dollar does not strengthen further, a swift rise for the US dollar back towards C$1.41 cannot be ruled out.
Written by Michael J. Kramer, founder of Mott Capital Management
Disclaimer: CMC Markets is an execution-only service provider. The material (whether or not it states any opinions) is for general information purposes only and does not take into account your personal circumstances or objectives. Nothing in this material is (or should be considered to be) financial, investment or other advice on which reliance should be placed.
No opinion given in the material constitutes a recommendation by CMC Markets or the author that any particular investment, security, transaction, or investment strategy is suitable for any specific person. The material has not been prepared in accordance with legal requirements designed to promote the independence of investment research. Although we are not specifically prevented from dealing before providing this material, we do not seek to take advantage of the material prior to its dissemination.

USDCADUSDCAD Interest Rate Differential and Upcoming Economic Data (May 2025)
Interest Rate Differential
Federal Reserve (Fed):
The Fed’s policy rate is currently around 4.25%–4.50%, having held steady in early May 2025 amid inflation concerns and economic uncertainty.
Bank of Canada (BoC):
The BoC has been on a rate-cutting path, with the benchmark rate at 2.75% as of April 2025, reflecting weaker Canadian economic data and inflation cooling. Further easing is expected through 2025, likely at a faster pace than the Fed.
Resulting Differential:
The widening interest rate gap of approximately 1.5–1.75 percentage points favors the U.S. dollar, supporting USD strength against the Canadian dollar.
Upcoming Economic Data and Events
Canada:
BoC Monetary Policy Reports and Rate Decisions: Next key updates expected mid-to-late May 2025, with markets pricing in further rate cuts.
GDP and Trade Data: Early Q2 releases will indicate how tariffs and global demand are impacting Canada’s export-driven economy.
Employment Data: Labor market strength or weakness will influence BoC’s policy stance.
United States:
Inflation (CPI, PCE) and Employment Reports: These will guide Fed’s future rate decisions and impact USD strength.
GDP Growth and Manufacturing Data: Key indicators for economic momentum amid tariff-related uncertainties.
The widening interest rate differential between the Fed and BoC, combined with expected further BoC rate cuts and relatively resilient U.S. economic data, supports a bullish bias for USD/CAD in the near term. Key Canadian inflation and GDP data in May will be critical in determining the pace of BoC easing and CAD’s outlook, while U.S. inflation and employment reports will influence Fed policy and USD strength.
The Canadian dollar (CAD) is historically and fundamentally closely linked to oil prices due to Canada’s status as one of the world’s largest oil producers and exporters. Here’s how oil prices affect the CAD:
1. Direct Correlation Between Oil Prices and CAD Value
Canada earns a significant portion of its U.S. dollar revenue from crude oil exports. When oil prices rise, Canada receives more U.S. dollars per barrel exported, increasing the inflow of foreign currency into the Canadian economy.
This increased demand for Canadian dollars to pay for oil-related transactions tends to strengthen the CAD relative to the U.S. dollar. Conversely, when oil prices fall, the CAD typically weakens.
Historically, the correlation between oil prices and USD/CAD has been strong and negative (when oil rises, USD/CAD falls, meaning CAD strengthens).
2. Impact on Canada’s Trade Balance and Economy
Higher oil prices improve Canada’s trade balance by increasing export revenues, which supports economic growth and boosts investor confidence in the CAD.
The energy sector contributes significantly to Canada’s GDP and employment, so oil price movements have broader economic implications that influence currency strength.
3. Changing Dynamics and Recent Weakening of Correlation
In recent years, the tight link between oil prices and the CAD has weakened due to several factors:
A larger share of oil company revenues goes to foreign shareholders rather than being reinvested domestically, reducing the flow of U.S. dollars back into Canada.
Discounts on Canadian oil prices (e.g., Western Canada Select vs. WTI) reduce the effective revenue Canada earns.
Other factors like global risk sentiment, U.S.-Canada trade dynamics, and diverging economic fundamentals have become more influential on CAD movements.
The 3-month correlation between oil prices and USD/CAD has recently dropped close to zero, indicating oil prices alone no longer dominate CAD valuation.
In essence:
While oil prices remain an important factor for the Canadian dollar, especially over the long term, the direct correlation has diminished recently. The CAD’s value now reflects a more complex mix of oil market dynamics, foreign investment flows, trade relations, and broader economic conditions. Nonetheless, sharp moves in oil prices still tend to influence the price action especially in periods of strong market sentiment or volatility.

USDCAD: Short Trading Opportunity
USDCAD
- Classic bearish pattern
- Our team expects retracement
SUGGESTED TRADE:
Swing Trade
Sell USDCAD
Entry - 1.3880
Stop - 1.3901
Take - 1.3838
Our Risk - 1%
Start protection of your profits from lower levels
Disclosure: I am part of Trade Nation's Influencer program and receive a monthly fee for using their TradingView charts in my analysis.
❤️ Please, support our work with like & comment! ❤️

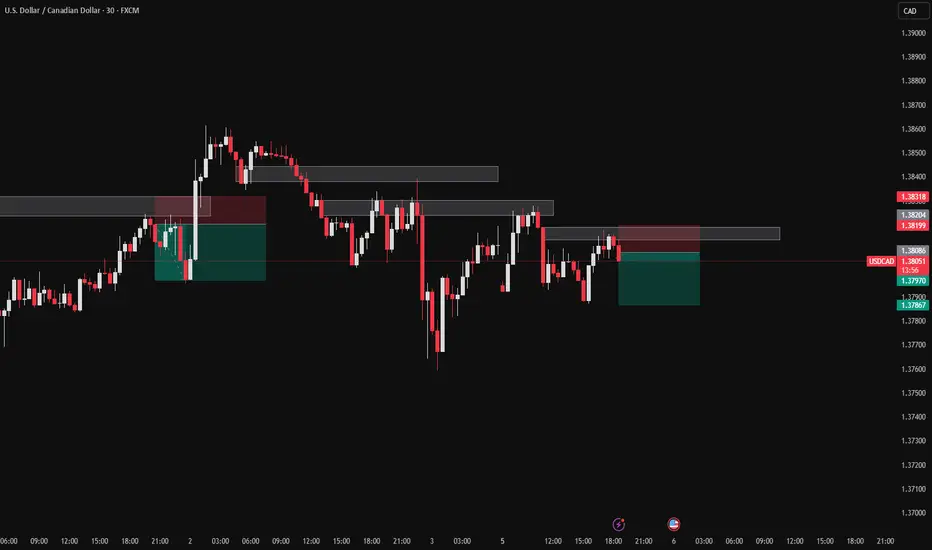
USDCAD SHORT FORECAST Q2 W19 D6 Y25USDCAD SHORT FORECAST Q2 W19 D6 Y25
Professional Risk Managers👋
Welcome back to another FRGNT chart update📈
Diving into some Forex setups using predominantly higher time frame order blocks alongside confirmation breaks of structure.
Let’s see what price action is telling us today!
💡Here are some trade confluences📝
✅Intraday breaks of structure
✅Tokyo ranges to be filled
✅15' order block identified
✅ inconclusive regarding 15' mitigated, therefore 5' order block identified after potential 15' mitigation
🔑 Remember, to participate in trading comes always with a degree of risk, therefore as professional risk managers it remains vital that we stick to our risk management plan as well as our trading strategies.
📈The rest, we leave to the balance of probabilities.
💡Fail to plan. Plan to fail.
🏆It has always been that simple.
❤️Good luck with your trading journey, I shall see you at the very top.
🎯Trade consistent, FRGNT X
USDCAD PREPARING FOR BULLISHIn this video I will be sharing my USDCAD analysis today, by providing my complete technical analysis by using candlesticks in order to have confidence over the market/control over your emotion no matter what the fundamentals are saying concerning the market, so you can watch it and improve your forex trading skill.

USDCAD massive breakout on Friday? - superswingI´m expecting massive breakout of this pair on Friday due to US (and CAD) NFP. If you decide to trade this pair, you can enter now at current market price 1,38218 or wait for premium-rejection zone at 1,39300-600. Personally I will use the 1. option and average higher if market let me. Use logical size to trade this idea. Every red line is a rejection zone, so TP your trade partially at these line. Do not try to reach the final target with full size. You can consider to trail your profit by moving the SL continuously down when red line is reached. Wish you good luck.

Usdcad PWL?!Good day traders, we back with USDCAD on the 4h TF. Well for this setup I am looking for price to take out out previous week low, previous week we had a candle stick pattern recognition after we saw price move lower but failing to close lower told a different story that price is not yet ready to start moving higher which honestly speaking was my bias last week. For the rest of the day I believe we can expect lower prices to close the day.

usdcadDisclaimer:
Trading involves risk. These signals are for informational purposes only and do not constitute financial advice. Past performance is not indicative of future results. Use at your own risk. Always trade responsibly.
USDCAD Monthly – Seller Initiative in PlayHey traders and investors!
Take a look at the monthly chart of USDCAD.
The price has been in a sideways range for quite some time, and the seller initiative is currently active.
📌 At the upper boundary of the range, a seller zone (red box) has formed, along with a seller-side Decision bar (IKC), which has now hit the buyer zone (blue box).
⚠️ With this structure, it makes more sense to look for short setups.
This analysis is based on the Initiative Analysis concept (IA).
Wishing you profitable trades!

USD/CAD Bulls Emerge at Support- Breakout ExtendsUSD/CAD rebounded off the lower parallel of the March downtrend with a breakout of the weekly opening-range extending into pivotal resistance.
Support now rests with the low-day close (LDC) / 61.8% retracement of the December 2023 advance / monthly open at 1.3778/98- a break / close below this threshold would be needed to mark downtrend resumption towards the 78.6% retracement of the September advance at 1.3714 and the March high at 1.3614 .
A topside breach above this pivot zone at the median-line exposes key resistance at 1.3977-1.4010 - a region defined by the 2022 high, the 2020 March weekly reversal close and the 200-day moving average. A close above this region would be needed to suggest a more significant low was registered this week / a larger reversal is underway with subsequent objectives eyed at the 1.41 -handle and 1.4149/78 - look for a larger reaction there IF reached.
Bottom line: A rebound off downtrend support takes USD/CAD into the topside of a multi-week range – risk of a larger recovery while above the weekly open. From a trading standpoint, losses should be limited to 1.3778 IF price is heading higher on this stretch – look for a larger reaction on test of the 200-day moving average.
-MB

Bearish trend in USD CAD chartA bearish trend in the USD CAD chart after following the technical analcis.

USDCAD BUY STOPHaven't been checking the chats in a while. There was a double bottom set up forming on the H4 chat. I missed the initially sniper entry but i'm hoping to catch the rest of the formation of the pattern. This is not a signal but an anticipation.