USDCAD: Growth & Bullish Forecast
Remember that we can not, and should not impose our will on the market but rather listen to its whims and make profit by following it. And thus shall be done today on the USDCAD pair which is likely to be pushed up by the bulls so we will buy!
Disclosure: I am part of Trade Nation's Influencer program and receive a monthly fee for using their TradingView charts in my analysis.
❤️ Please, support our work with like & comment! ❤️
USDCAD.PRO.OTMS trade ideas

Bullish MovementOverall trend of USDCAD is uptrend. waiting for breakout and retest from the short term bearish trend, then I will put in for BUY... as per my trading plan 1% risk only.

bullish moveUSDCAD overall trend is bullish, so I'm waiting for the retest @ the strong zone before i enter for a buy and it to the next zone risking 2% for this.

USDCAD_4H USDCAD_4H BULLISH
Everything is mentioned on Charts.
Please always look for double confirmation before entry.
Wish you Happy & safe Trading.
Trade as per your own RISK
Please Note:
My studies are for educational purpose only.
Please consult your financial advisor before Trading or Investing.
I'm not responsible for any kinds of your Profits & Losses.
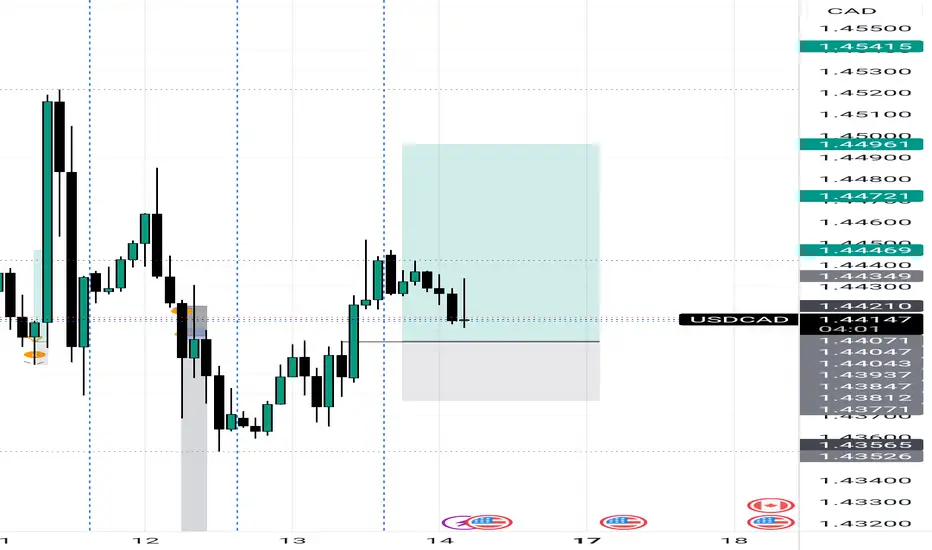
USDCAD bullish bias Price has broken out and probably fully retraced. I am expecting a push up from the yellow zone. Currently looking for entry point. Goodluck.

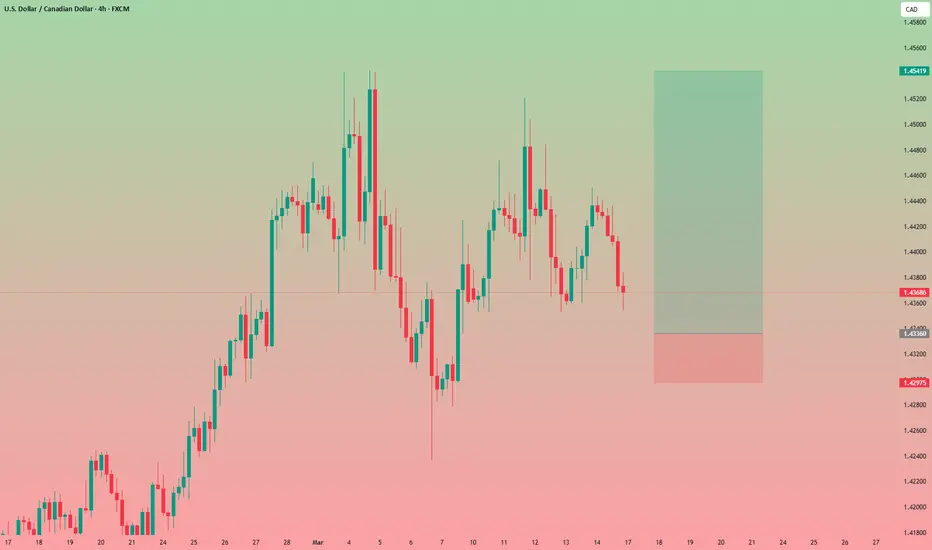
USDCAD Wave Analysis – 14 March 2025
- USDCAD reversed from key resistance level 1.4500
- Likely to fall to support level 1.4300
USDCAD currency pair recently reversed from the key resistance level 1.4500, which has been reversing the price since the middle of January.
The resistance level 1.4500 was further strengthened by the intersecting upper daily Bollinger Band.
Given the strength of the resistance level 1.4500 and the bearish US dollar sentiment seen today, USDCAD currency pair can be expected to fall to the next support level 1.4300.

USDCAD uptrend continuation supported at 1.4350The USD/CAD currency pair price action sentiment remains bullish, supported by the prevailing long-term uptrend. Recent intraday movements indicate a bullish breakout above the previous resistance level, which has now established itself as a new support zone.
Key Levels and Price Action
The primary trading level to watch is 1.4390, representing the previous consolidation range. A corrective pullback to this level, followed by a bullish rebound, could signal continued upward momentum. In this scenario, the pair may aim for upside resistance levels at 1.4487, 1.4530, and 1.4590 over the longer timeframe.
However, if the 1.4390 support level fails to hold and there is a confirmed daily close below it, the bullish outlook would be invalidated. This breakdown could lead to a deeper retracement, targeting the 1.4350 support level, followed by 1.4310 and 1.4230.
Conclusion
The sentiment remains bullish as long as the 1.4390 support level holds, with potential upside targets at 1.4487, 1.4530, and 1.4590. A confirmed breakdown below 1.4390 would shift the outlook to bearish, signaling a potential move toward 1.4350, 1.4310, and 1.4230. Traders should closely monitor daily closing levels around the key support to gauge sentiment shifts and make informed trading decisions.
This communication is for informational purposes only and should not be viewed as any form of recommendation as to a particular course of action or as investment advice. It is not intended as an offer or solicitation for the purchase or sale of any financial instrument or as an official confirmation of any transaction. Opinions, estimates and assumptions expressed herein are made as of the date of this communication and are subject to change without notice. This communication has been prepared based upon information, including market prices, data and other information, believed to be reliable; however, Trade Nation does not warrant its completeness or accuracy. All market prices and market data contained in or attached to this communication are indicative and subject to change without notice.

USDCAD Buy/Long IdeaUSDCAD is grinding higher and higher. I think a retrace for a further move up is complete.

UCAD Buy Limit OrderLooking to buy this pair off of on a Rally base Drop a trading pattern tht plays a huge part in changing directions of the pairs NB : this trade is a 50/50 it may go both ways, risk wise
USDCAD H4 ShortRemember, successful trading relies on proper risk management and a disciplined approach. Use stop-losses to safeguard your assets and carefully plan each trade. Analysis is the key to making informed decisions. Stay updated and continue refining your strategies!


check the trendThe upward trend will be possible if the price can stabilize the resistance range. Otherwise, with the defeat of the support range, the downward trend will be likely.
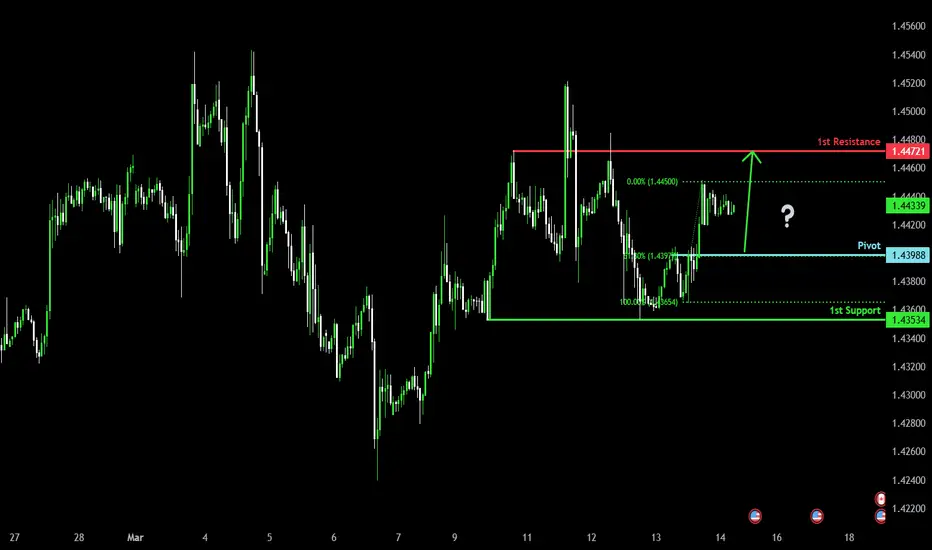
Bullish bounce off pullback support?The Loonie (USD/CAD is falling towards the pivot and could bounce to the 1st resistance which is a pullback resistance.
Pivot: 1.4398
1st Support: 1.4353
1st Resistance: 1.4472
Risk Warning:
Trading Forex and CFDs carries a high level of risk to your capital and you should only trade with money you can afford to lose. Trading Forex and CFDs may not be suitable for all investors, so please ensure that you fully understand the risks involved and seek independent advice if necessary.
Disclaimer:
The above opinions given constitute general market commentary, and do not constitute the opinion or advice of IC Markets or any form of personal or investment advice.
Any opinions, news, research, analyses, prices, other information, or links to third-party sites contained on this website are provided on an "as-is" basis, are intended only to be informative, is not an advice nor a recommendation, nor research, or a record of our trading prices, or an offer of, or solicitation for a transaction in any financial instrument and thus should not be treated as such. The information provided does not involve any specific investment objectives, financial situation and needs of any specific person who may receive it. Please be aware, that past performance is not a reliable indicator of future performance and/or results. Past Performance or Forward-looking scenarios based upon the reasonable beliefs of the third-party provider are not a guarantee of future performance. Actual results may differ materially from those anticipated in forward-looking or past performance statements. IC Markets makes no representation or warranty and assumes no liability as to the accuracy or completeness of the information provided, nor any loss arising from any investment based on a recommendation, forecast or any information supplied by any third-party.
USDCAD SHORT USDCAD is facing a high resistance area an is likely to go down, it is also rejected from the higher high level of the ascending channel.

Head and Shoulder patternThe price has made a head and shoulder pattern, and the price also broke out of a bullish trendline, followed by a pullback, now the price has also made a smaller pullback, suggesting a bearish move is at hand at the lower low. Time to go short
WE ONLY TRADE PULLBACKS

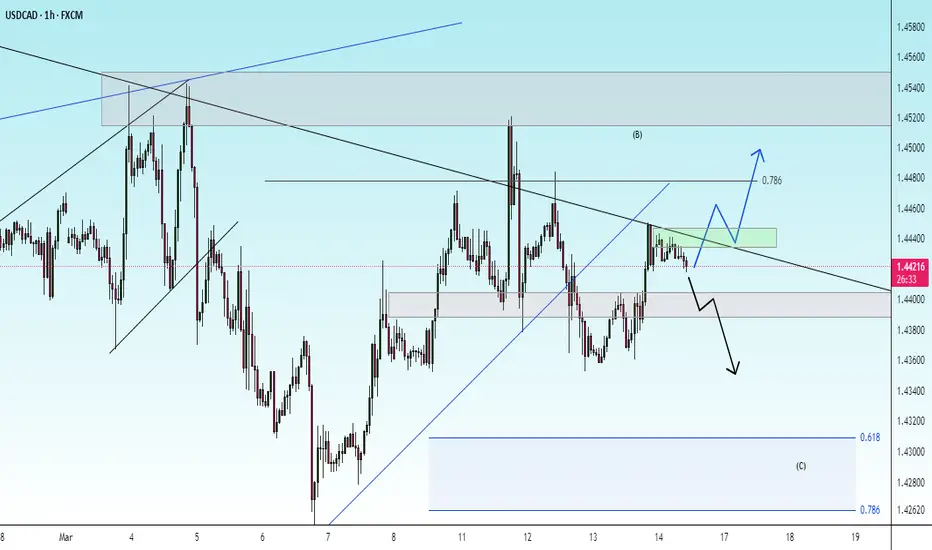
USDCAD Trade Idea (1H Chart Analysis)**USDCAD Trade Idea (1H Chart Analysis)**
**Market Structure:**
- The price is in a **downtrend** on the 1H chart, with lower highs and lower lows forming.
- It is currently testing a **key support level** around **1.4350**.
- The **50 EMA (black line) is above the price**, confirming bearish momentum.
- The recent candles show **decreasing volume**, indicating possible consolidation before the next move.
**Trade Plan**
**Scenario 1: Bearish Breakdown (Sell Trade)**
📉 **Entry:** Below **1.4350**, after a strong bearish candle closes.
🎯 **Target 1:** **1.4320** (previous minor support)
🎯 **Target 2:** **1.4280** (stronger support zone)
🛑 **Stop Loss:** **1.4375** (above recent lower high)
📊 **Risk-to-Reward Ratio:** 1:2 or better
**Confirmation:** If price breaks 1.4350 with strong volume, it signals continuation of the downtrend.
**Scenario 2: Bullish Reversal (Buy Trade)**
📈 **Entry:** If price **bounces from 1.4350** and forms a strong bullish engulfing candle.
🎯 **Target 1:** **1.4395** (previous resistance)
🎯 **Target 2:** **1.4415-1.4420** (major resistance zone)
🛑 **Stop Loss:** **1.4335** (below recent low)
📊 **Risk-to-Reward Ratio:** 1:2
**Confirmation:** A strong rejection from 1.4350 with bullish volume indicates potential reversal.
**Final Thoughts**
- **Bias:** Bearish unless we see a clear reversal signal at 1.4350.
- **Watch for a breakout or bounce at key levels before entering.**
- **Always use risk management** – never risk more than 1-2% per trade!

Bearish reversalAfter a long bullish trend the price has changed character and suppliers have gained momentum again. Head and shoulder formed to confirm a reversal and neckline has been broken

USDCAD POSSIBLE BUY OPPORTUNITY Price looking promising for a buy as it falls back to a trend line supporting price so far this month. A buy opportunity is envisaged upon bouncing off the trend line. We keep a close watch to see how price reacts around that area.

USDCAD beautiful head and shoulderUSDCAD beautiful head and shoulders creating , i think after the retest it will be okay to take a short possition risking 1-2% of the capital

Bullish bounce?USD/CAD is falling towards the support level which is a pullback support that is slightly above the 78.6% Fibonacci projection and could bounce from this level to our take profit.
Entry: 1.4299
Why we like it:
There is a pullback support level that is slightly above the 78.6% Fibonacci projection.
Stop loss: 1.4222
Why we like it:
There is a pullback support level.
Take profit: 1.4416
Why we like it:
There is a pullback resistance level.
Enjoying your TradingView experience? Review us!
Please be advised that the information presented on TradingView is provided to Vantage (‘Vantage Global Limited’, ‘we’) by a third-party provider (‘Everest Fortune Group’). Please be reminded that you are solely responsible for the trading decisions on your account. There is a very high degree of risk involved in trading. Any information and/or content is intended entirely for research, educational and informational purposes only and does not constitute investment or consultation advice or investment strategy. The information is not tailored to the investment needs of any specific person and therefore does not involve a consideration of any of the investment objectives, financial situation or needs of any viewer that may receive it. Kindly also note that past performance is not a reliable indicator of future results. Actual results may differ materially from those anticipated in forward-looking or past performance statements. We assume no liability as to the accuracy or completeness of any of the information and/or content provided herein and the Company cannot be held responsible for any omission, mistake nor for any loss or damage including without limitation to any loss of profit which may arise from reliance on any information supplied by Everest Fortune Group.

USDCAD downfall?USDCAD facing strong bearish resistance around price 1.4500. With multiple rejections already and the break of this 4hr trendline. We can capitalize on a potential 150+ pips to the downside.
Trade cautiously!!

USDCAD INTRADAY bullish sideways consolidationThe USD/CAD currency pair price action sentiment remains bullish, supported by the prevailing long-term uptrend. Recent intraday movements indicate a bullish breakout above the previous resistance level, which has now established itself as a new support zone.
Key Levels and Price Action
The primary trading level to watch is 1.4390, representing the previous consolidation range. A corrective pullback to this level, followed by a bullish rebound, could signal continued upward momentum. In this scenario, the pair may aim for upside resistance levels at 1.4487, 1.4530, and 1.4590 over the longer timeframe.
However, if the 1.4390 support level fails to hold and there is a confirmed daily close below it, the bullish outlook would be invalidated. This breakdown could lead to a deeper retracement, targeting the 1.4350 support level, followed by 1.4310 and 1.4230.
Conclusion
The sentiment remains bullish as long as the 1.4390 support level holds, with potential upside targets at 1.4487, 1.4530, and 1.4590. A confirmed breakdown below 1.4390 would shift the outlook to bearish, signaling a potential move toward 1.4350, 1.4310, and 1.4230. Traders should closely monitor daily closing levels around the key support to gauge sentiment shifts and make informed trading decisions.
This communication is for informational purposes only and should not be viewed as any form of recommendation as to a particular course of action or as investment advice. It is not intended as an offer or solicitation for the purchase or sale of any financial instrument or as an official confirmation of any transaction. Opinions, estimates and assumptions expressed herein are made as of the date of this communication and are subject to change without notice. This communication has been prepared based upon information, including market prices, data and other information, believed to be reliable; however, Trade Nation does not warrant its completeness or accuracy. All market prices and market data contained in or attached to this communication are indicative and subject to change without notice.

Sell Limit USDCADwe've seen the CPI spike just recently let's attempt one last trade for the day and see if we can bag these sells my tp is usually 1/2RR bt if you'd like if activated you can hold to tp if loss is not hit
