Bank of Canada Expected to Reduce RatesSeveral desks forecast that the Bank of Canada (BoC) will reduce the overnight rate by another 25 basis points (bps) to 2.75% (from 3.00%) today at 1:45 pm GMT. Since June (2024), the central bank has lowered rates by 200 bps over six consecutive meetings, bringing the overnight rate closer to the mid-point of the BoC’s neutral range of 3.25% - 2.25%.
The swaps market is pricing in a 94% chance that the BoC will opt for another 25 bp cut today. Eleven out of twelve economists polled by the Wall Street Journal also forecast a 25 bp reduction, in line with current market pricing. Additionally, some desks are airing the possibility of a 50 bp decrease. However, I doubt this will be the case; cutting the overnight rate to such an extent at this juncture might indicate serious concerns in the Canadian economy, and I do not think the BoC will want to alarm the markets.
BoC Rate Cut; US Tariffs on the Front Line
Let’s be frank, the BoC has a challenging task ahead. At a time when the Canadian economy shows signs of persistent inflation – the central bank’s preferred measures of inflation have been hovering around the upper boundary of its 1%-3% inflation target band – and reasonably robust GDP growth (Gross Domestic Product), running at an annualised rate of 2.6% in Q4 24, the central bank will likely cut rates again today.
You may also recall that before Friday’s jobs numbers, rate pricing was roughly 50/50 for most of February (and early March) regarding whether the BoC would hold or cut. As mentioned above, money markets are now nearly fully pricing in another 25 bp cut. According to Statistics Canada, job growth was minimal in February, adding a mere 1,100 jobs; this was significantly lower than economists’ forecasts and followed three consecutive months of strong hiring. Despite this, the unemployment rate remained unchanged at 6.6%, defying analysts’ estimates of a 6.7% increase.
Unquestionably, the BoC’s primary focus is on US tariffs, with some economists cautioning that a recession could be around the corner in the event of a prolonged trade war. The most recent technical recession in Canada, brought about by the COVID-19 pandemic, was seen in 2020. BoC Governor Tiff Macklem stated that prolonged and widespread US tariffs could significantly hinder the Canadian economy’s recovery.
This week's latest developments saw US President Donald Trump dial back on his 50% tariff threats on Canadian aluminium and steel, retreating to his originally planned 25% tariffs; Trump also recently downplayed the possibility of a US recession.
What Does this Mean for the Canadian Dollar?
Versus the US dollar (USD), the Canadian dollar (CAD) remains on the ropes, with the USD/CAD currency pair refreshing multi-decade highs of C$1.4793 in February. Technically, following a test of monthly resistance-turned-support at C$1.4193 last month, buyers and sellers are now contained between said support and overhead monthly resistance at C$1.4533. Overall, though, the long-term trend still favours buyers, so a breakout higher would not come as a surprise, potentially paving the way for a run to another layer of monthly resistance at C$1.4925. Meanwhile, on the daily chart, the pair rebounded from support at C$1.4262, with scope to run to resistance from C$1.4595.
Consequently, while the trend leans in favour of buyers now, monthly and daily resistance between C$1.4533 and C$1.4595 could be problematic. This area will likely need to be absorbed before further upside is seen towards C$1.4793, closely shadowed by monthly resistance at C$1.4925.
Should the BoC cut the overnight rate by 25 bps, maintain cautious forward guidance, and not pre-commit to additional policy easing, I see limited volatility drawn from this risk event. However, if the central bank held the rate at 3.00% and underscored a strong economy, this could send the CAD higher (USD/CAD lower). If the BoC opts for a bulkier 50 bps cut and signals further easing, this would likely open the door to a shorting opportunity in the CAD (USD/CAD higher).
Written by FP Markets Market Analyst Aaron Hill
USDCAD.PRO.OTMS trade ideas

USDCAD-SELL strategy 6 hourly RENKO chartThe pair is correcting downwards, and I feel we have good chance to see 1.4300 tested. MACD and SMI both are negative.
Strategy SELL @ 1.4410-1.4450 and take profit near 1.4317 for now.

USDCAD - UniverseMetta - Signal#USDCAD - UniverseMetta - Signal
H4 - Formation of the 3rd wave from the level + retest. Stop for the maximum of the 1st wave.
Entry: 1.44145
TP: 1.42619 - 1.40674 - 1.39061 - 1.37509
Stop: 1.45514

Why are you hesitating? Sell USDCADThis will be a big move. CADCHF has begun its movement up. Dont miss this trade

Canadian dollar calm ahead of BoC, US inflationThe Canadian dollar posted gains earlier but couldn't consolidate. In the European session, USD/CAD is trading at 1.4439, up 0.03% on the day.
It's decision day at the Bank of Canada, which is widely expected to lower rates by 25 basis points. This would lower the cash rate to 2.75%, its lowest level since July 2022. The BoC has been aggressive and has lowered rates at five straight meetings, chopping 200 basis points during that time.
The economy remains weak despite the sharp drop in interest rates and the central bank plans to continue lowering rates in order to boost economic growth. The BoC finds itself in a difficult position as far as rate policy. The labor market is showing weakness, with almost no job growth in February, while at the same time inflation remains sticky, above the BoC's 2% target. Throw into the mix the Trump administration's tariffs on Canada, and the situation has become fluid. The specter of a long trade war between Canada and the US would be disastrous for Canada and has complicated matters for the BoC.
In the US, inflation has been contained but remains above the Federal Reserve's target of 2%. Headline CPI for February is expected to ease to 0.3% m/m, down from 0.5% in January, and down to 2.9% y/y from 3.0%. The core rate is projected to drop to 0.3% m/m from 0.4% and to 3.2% from 3.3%.
If the CPI estimates prove to be on target, it would point to little movement in inflation and investors may feel relieved that Trump's tariffs policies have not yet raised inflation. The Federal Reserve is widely expected to hold rates at next week's meeting but it's unclear what happens after that, with the chances of a May cut at around 50/50.
USD/CAD is testing resistance at 1.4445. Above, there is resistance at 1.4511
1.4370 and 1.4304 are the next support levels

USDCAD could be about to deliver a 330 pips moveUSDCAD is forming an ascending triangle pattern, suggesting a potential breakout if it surpasses 1.4546, with an upside target of around 322 pips. Economic factors include U.S. tariffs on Canadian goods, a Canadian boycott of U.S. products, and slowing economic data in both countries, which could pressure the CAD as an export-driven currency.
This content is not directed to residents of the EU or UK. Any opinions, news, research, analyses, prices or other information contained on this website is provided as general market commentary and does not constitute investment advice. ThinkMarkets will not accept liability for any loss or damage including, without limitation, to any loss of profit which may arise directly or indirectly from use of or reliance on such information

check the trendGiven the price behavior within the current resistance range, it is expected that a trend change will take place and we will witness the start of a downward trend.

USDCAD SHORTLongterm oportunity to short USDCAD. We are in bigger consolidation that we can see on Monthly chart. On weekly we touch upper area of consolidation and now we brake UP trend and currently we are in retracement.
Try to look for enteries for short.
SL: above highest point
TP: above lower band of consolidation (dont be too greedy)

Different Shades of DisciplineIn my decade of trading experience I've come to realize through huge number of trials and errors that discipline in trading is a rather unique and not always universal beast.
While there are definitely broad categories of discipline trading like taking high-quality setups, correctly managing risk, taking profits, and so on; There are also many unique underlying reasons and mind-tangled cognitive dissonances that can become the cause of these lapses.
What I understood in my experience is that discipline seems to be transferrable from 1 area to another. Addicted to smoking? Perhaps, quitting can be beneficial to one's trading. However, not necessarily as some traders smoke (and can't quit that habit) for a different underlying reason and thus quitting for them might NOT be as beneficial for the former one. The devil seems to be in the details. Why one smokes? Is it a coping mechanism for stress, or is it a little ritual that one employs to consciously recalibrate themselves?
The key seems to be in action and number of trials and experiments. Attempting to try the routine of other people might not yield the best results for the expended effort. One person may run for many miles and enjoy that time, for another it will be excruciating agony to do that. The discipline required in that example would obviously be vastly different, and thus the effect that action produces also - different.
At the end of the day - the most important thing in trading is consistency, but coupled with PERSONAL unique discipline is something that gives us edge in the markets.

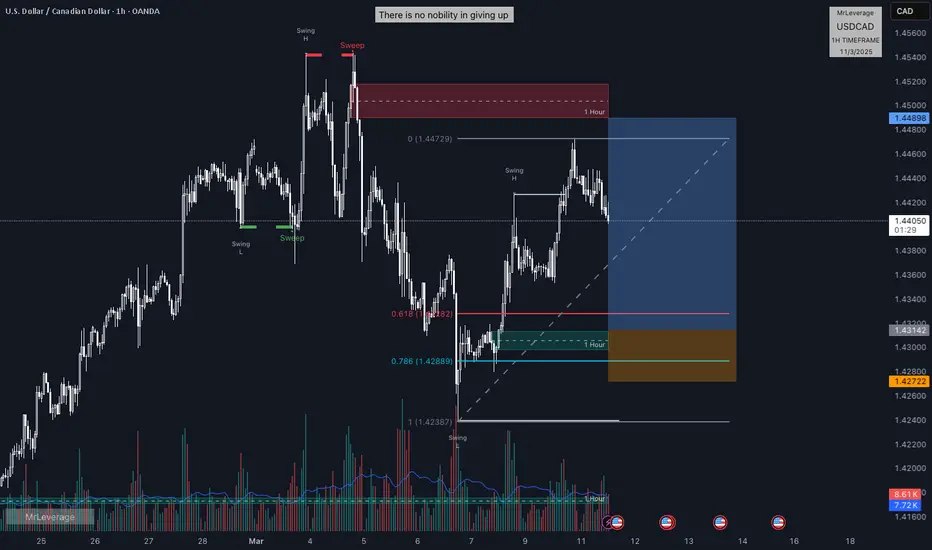
USD/CADBuy side Liquidity has been swept.
Rejection off previous Supply zone has been made
Order Block has been created and we are looking for a retracement into the Liquidity Trend taking sell side Liquidity
Good luck to all the traders that will follow

Bearish drop?USD/CAD is reacting off the resistance level which is a pullback resistance and could drop from this level to our take profit.
Entry: 1.4430
Why we like it:
There is a pullback resistance.
Stop loss: 1.4539
Why we like it:
There is a pullback resistance level.
Take profit: 1.4382
Why we like it:
There is an overlap support level that aligns with the 78.6% Fibonacci projection.
Enjoying your TradingView experience? Review us!
Please be advised that the information presented on TradingView is provided to Vantage (‘Vantage Global Limited’, ‘we’) by a third-party provider (‘Everest Fortune Group’). Please be reminded that you are solely responsible for the trading decisions on your account. There is a very high degree of risk involved in trading. Any information and/or content is intended entirely for research, educational and informational purposes only and does not constitute investment or consultation advice or investment strategy. The information is not tailored to the investment needs of any specific person and therefore does not involve a consideration of any of the investment objectives, financial situation or needs of any viewer that may receive it. Kindly also note that past performance is not a reliable indicator of future results. Actual results may differ materially from those anticipated in forward-looking or past performance statements. We assume no liability as to the accuracy or completeness of any of the information and/or content provided herein and the Company cannot be held responsible for any omission, mistake nor for any loss or damage including without limitation to any loss of profit which may arise from reliance on any information supplied by Everest Fortune Group.

International politics is now a high school dramaSo, Trump was all like, “Let’s slap an extra 25% tariff on Canadian steel and aluminum,” which meant total duties shot up to 50%.
Why? Because Ontario put a 25% tax on electricity exports to the U.S. And Doug Ford? He was not having it—saying he’d “respond appropriately” and “not back down.” But —he totally backed down and scrapped the tax on electricity exports to Michigan, New York, and Minnesota.
And now, Trump just ditched the extra 25% tariff, and boom— USDCAD broke below the recent low of 1.43986

USDCAD - Correction and then move towards 1.44999Given the flow of bearish orders on the higher timeframes (weekly and daily, four-hour), I think the price could move towards 1.44999 after a minor correction and liquidity clearing.
This move is just a pullback on the higher timeframes, and with this move, the price is trying to reach the fifty percent level of the structure on the higher timeframe.

USD/CAD SELLERS WILL DOMINATE THE MARKET|SHORT
Hello, Friends!
USD/CAD pair is trading in a local downtrend which know by looking at the previous 1W candle which is red. On the 1D timeframe the pair is going up. The pair is overbought because the price is close to the upper band of the BB indicator. So we are looking to sell the pair with the upper BB line acting as resistance. The next target is 1.411 area.
Disclosure: I am part of Trade Nation's Influencer program and receive a monthly fee for using their TradingView charts in my analysis.
✅LIKE AND COMMENT MY IDEAS✅

USD/CAD: Textbook Waves—ABC Correction Next?Discover the Power of Elliott Waves with This USD/CAD Setup!
Hey traders! If you’re looking for a clean, textbook Elliott Wave example to sharpen your analysis skills, you’re in the right place. Let’s break it down together—and who knows, this could be the edge your trading needs!
Elliott Wave Breakdown
Wave 1: Kicked things off with a strong move higher, marking the start of the current trend.
Wave 2 (Flat): A sideways, flat correction—think of it like the market catching its breath. It moved in three waves (A-B-C), holding up price and hinting at the strength to come.
Wave 3: The rocket ship! Wave 3 is typically the powerhouse, and USD/CAD delivered. Traders who caught this move likely enjoyed a nice ride.
Wave 4 (Zigzag): True to Elliott Wave theory, we saw alternation. After the flat Wave 2, Wave 4 gave us a sharp A-B-C zigzag down. Quick, clean, and offering a second chance for those who missed Wave 3.
Wave 5: The final push completed the 5-wave impulse, potentially wrapping up the current trend.
What’s Next? An ABC Correction!
This is where it gets exciting. After completing a 5-wave pattern, markets often retrace in an A-B-C correction. This could be your chance to plan the next move. Will it pull back to the 38.2%, 50%, or even 61.8% retracement? Smart traders are already watching these levels!
Why This Matters for You
Understanding wave structures like this can give you a huge advantage. It’s not about predicting the future—it’s about stacking probabilities in your favor. And when a textbook pattern like this shows up, it’s an opportunity worth watching.
Actionable Tips for Traders
Be ready for the ABC correction—this could be your ideal entry for the next impulse move.
Use tools like RSI, MACD, or trendline breaks for extra confirmation.
Manage risk wisely. No setup is guaranteed, but the odds are on your side when you follow the waves!
Stick around for more insights like this. If you find this breakdown helpful, give it a thumbs up and follow me for more real-time analyses and trading tips!
Good luck and happy trading!

USDCAD, A simple swing structure S/D paired with OTEThe supply zone is fresh , i would expect some reaction or bounce from the zone since its also present at the OTE of the swing.
USDCAD SHORT we have a lot of confirmation USDCAD, Daily timeframe is short, and weekly same. Moreover the price hit the 60% fibbonacci level on daily and rejected from that level. I expect the price to get down from the 2 hour orderblock on 1.4482.

USDCAD Short H4 UpdateRemember, successful trading relies on proper risk management and a disciplined approach. Use stop-losses to safeguard your assets and carefully plan each trade. Analysis is the key to making informed decisions. Stay updated and continue refining your strategies!

The 3 Step Rocket Booster Strategy In Forex TradingI have been quiet for the past few days as am
trying to refine
my trading strategy so that I could
have an edge on the markets.
After sitting in a cave and refining
My trading strategy
am back with a new all all-improved strategy
to take advantage during this bear market
that we are in.
This bear market is very brutal
and its taking a lot of prisoners
meaning that unless you
are learning a trading strategy
that will put you ahead of the competition
you are probably expecting
some bad trades as well
The key is to follow the
rocket booster strategy
it has 3 steps as follows:
#1- The price has to be above the 50 EMA
#2- The price has to be above the 200 EMA
#3 -The price should gap up
or pass the Buy stop order line
This last step is very important because it will give
you the signal to enter your trade or not.
Remember it has to pass that
line to confirm the last step.
Remember to rocket boost this post
to learn more
Disclaimer:Trading is risky please learn
risk manamgnet and profit taking strategies
also feel free to use a simulation trading account
before you trade with real money.

USDCAD Major Zone (Sell/Bearish)We have now reached a zone that has been hit twice in the past 11 or so years (Jan 19, 2016 and March 19, 2020) as seen on the chart. Will we see this respected zone once again?
THIS SELL PROVIDED IS NOT OFFICIAL, ONLY FOR DRAFT!

USDCAD Eyes on BoC Interest Rate DecisionUSDCAD Eyes on BoC Interest Rate Decision
On Friday, the Bank of Canada reported a contraction in employment data. However, it was positive that the unemployment rate remained unchanged at 6.6% from the previous month, and the average hourly wages for February were higher than the previous month. Overall, the Canadian economy is performing well.
Despite this, USDCAD is expected to advance further in the coming days. On Wednesday, March 12, the BoC will announce its interest rate decision. The market anticipates a rate cut of 25 basis points, bringing the rate down to 2.75% from the current 3%2.
This expectation is causing CAD weakness ahead of the news. The price may test our target areas soon.
If this does not happen by Wednesday, trading could become riskier.
You may find more details in the chart!
Thank you and Good Luck!
❤️PS: Please suppo rt with a like or comment if you find this analysis useful for your trading day❤️
Disclosure: I am part of Trade Nation's Influencer program and receive a monthly fee for using their TradingView charts in my analysis.

USDCAD 1H TimeFrame BuyUSDCAD good potential for a scalp buy. total trend is bullish
now we found some good support area to enter position

USDCAD, more waterfall ahead for the next few weeks!USDCAD, benefited from a mid term market correction as it has risen back to resistance levels.
But this rise is always met with well -- resistance.
A shift has been spotted already at these higher levels and a significant trim down is expected from here on. DXY is also looking to continue its descend journey.
Spotted at .14430
Interim Target at 1.4300
Mid Target at 1.4200
Trade safely.
TAYOR.
